Key Points
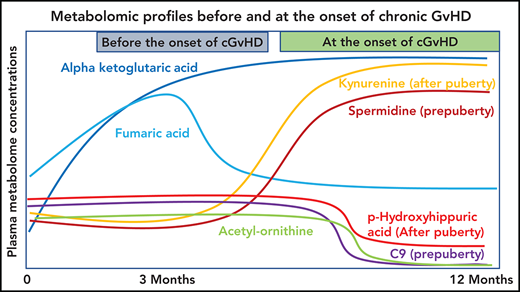
Plasma α-ketoglutaric acid was consistently elevated both before and at the onset of cGVHD in children and adolescents.
Metabolomics profiling of a large pediatric cohort found distinctive patterns in cGVHD, late aGVHD, and clinical presentations of cGVHD.

Abstract
Chronic graft-versus-host disease (cGVHD) is the most common cause for non-relapse mortality postallogeneic hematopoietic stem cell transplant (HSCT). However, there are no well-defined biomarkers for cGVHD or late acute GVHD (aGVHD). This study is a longitudinal evaluation of metabolomic patterns of cGVHD and late aGVHD in pediatric HSCT recipients. A quantitative analysis of plasma metabolites was performed on 222 evaluable pediatric subjects from the ABLE/PBMTC1202 study. We performed a risk-assignment analysis at day + 100 (D100) on subjects who later developed either cGVHD or late aGVHD after day 114 to non-cGVHD controls. A second analysis at diagnosis used fixed and mixed multiple regression to compare cGVHD at onset to time-matched non-cGVHD controls. A metabolomic biomarker was considered biologically relevant only if it met all 3 selection criteria: (1) P ≤ .05; (2) effect ratio of ≥1.3 or ≤0.75; and (3) receiver operator characteristic AUC ≥0.60. We found a consistent elevation in plasma α-ketoglutaric acid before (D100) and at the onset of cGVHD, not impacted by cGVHD severity, pubertal status, or previous aGVHD. In addition, late aGVHD had a unique metabolomic pattern at D100 compared with cGVHD. Additional metabolomic correlation patterns were seen with the clinical presentation of pulmonary, de novo, and progressive cGVHD. α-ketoglutaric acid emerged as the single most significant metabolite associated with cGVHD, both in the D100 risk-assignment and later diagnostic onset analysis. These distinctive metabolic patterns may lead to improved subclassification of cGVHD. Future validation of these exploratory results is needed. This trial was registered at www.clinicaltrials.gov as #NCT02067832.
Background
Hematopoietic stem cell transplant (HSCT) has been the preferred curative option for children and adolescents with refractory hematological malignancies and life-threatening non-malignant disorders. However, it is associated with serious long-term complications, including chronic graft-versus-host disease (cGVHD). The incidence of cGVHD varies from 30% to 60% in adults to 10% to 25% in pediatric HSCT recipients and has been recognized as the leading cause for non-relapse mortality post-HSCT.1,2 The lack of early diagnostic tests can result in chronic and often irreversible organ damage contributing to high mortality and morbidity rates.3,4 Immune cell populations and cytokine patterns in pediatric cGVHD have been analyzed by our group previously,5 however, we still lack well-established biomarkers for cGVHD.6
Mass-spectrometry-based metabolomic analysis has played a crucial role in the derivation of potential biomarker profiles for early detection and to monitor therapeutic responses, especially in the field of oncology, toxicology, immunology, and nutrition. The potential role of metabolic biomarkers in the prediction and diagnosis of cGVHD has not been widely explored.7,8 Some adult studies have evaluated the plasma or serum metabolic changes associated with cGVHD. One study explored the plasma metabolites in 40 adult allogeneic HSCT recipients and found 10 differentially expressed metabolites belonging to amino acid, lipid, and energy metabolism to be associated with cGVHD.9 Another study found reduced serum branched-chain amino acids (leucine and isoleucine) and elevated cystine in the day + 100 (D100) samples in 6 adult patients with cGVHD10 (supplemental Table 2, available on the Blood Web site). A recent case-control study on the D100 plasma samples in 10 patients with cGVHD and 43 controls found reduced butyrate and propionate levels in patients with cGVHD.11 However, the study faced issues with cross-validation in a second cohort. Most studies have been limited by small patient numbers and lack of a longitudinal study design with time-matched control populations to account for the impact of post-HSCT immune reconstitution.
We analyzed plasma samples from the Applied Biomarkers of Late Effects of Childhood Cancer/Pediatric Blood and Marrow Transplant Consortium 1202 protocol (ABLE/PBMTC 1202), a prospective study aimed at discovering biomarkers for pediatric cGVHD.5,11 The study addresses many of the limitations of the previous metabolomic studies in cGVHD with a longitudinal design, incorporation of multiples centers to minimize center effect and improve sample size, and close clinical adjudication of GVHD to standardize cGVHD classification using the 2005 National Institutes of Health-Consensus Conference (NIH-CC) criteria for cGVHD. The metabolomic analysis aimed to evaluate: (1) risk-assignment analysis of D100 plasma metabolomic patterns for later development of late acute GVHD (aGVHD) or cGVHD, and (2) metabolomic patterns at the onset of cGVHD compared with time-matched non-cGVHD controls. In addition, we evaluated the impact of certain clinical variables on the metabolomic patterns, including time of onset of cGVHD, pubertal status of the subjects, impact of previous aGVHD, and clinical presentation of cGVHD.
Materials and methods
ABLE/PBMTC 1202 cGVHD biomarker study design
The samples were obtained from the ABLE/PBMTC 1202 study cohort. The study included 27 pediatric transplant centers (6 Canadian, 20 US, and 1 Austrian) and enrolled 302 subjects between August 2013 and February 2017, as previously described.5,12 Of these, 222 had evaluable samples with exclusion due to toxic mortality, nonengraftment relapse, withdrawal from study, lost to follow-up, transplant not performed after enrollment, and samples shipping/processing issues. Patients 0 to 18 years had a sample collection and clinical assessment on D100 ± 14 days, 6 months (180 days ± 30 days), and 12 months (365 days ± 30 days) post-HSCT. cGVHD classification of the enrolled subjects was according to the 2005 NIH-CC criteria,13 and all GVHD classification was centrally adjudicated by an arms-length committee. Subjects were classified into 3 groups with available samples for risk-assignment (prediction before onset) D100 analysis including (supplemental Table 1): (1) no late aGVHD or cGVHD on D100 (n = 110) (control group); (2) Onset of late aGVHD >114 days post-HSCT (n = 45); and (3) Onset of cGVHD >114 days post-HSCT including overlap syndrome (n = 27). In the analysis for the onset of cGVHD (diagnostic analysis) ≤120 days, we had 110 subjects with no cGVHD, 11 with cGVHD, 45 with late aGVHD, and 27 controls that later developed cGVHD. For the analysis of patients that developed cGVHD between 121 and 240 days, there were 113 with no cGVHD, 22 with cGVHD, 49 with late aGVHD, and 10 controls that later developed cGVHD (supplemental Table 1). The analysis that evaluated the onset of cGVHD >240 days after transplant had 97 with no cGVHD, 7 with cGVHD, and 38 with late aGVHD samples. All clinical GVHD grading was concluded on outcomes ≤1 year after HSCT.
Blood samples and plasma isolation
Peripheral blood samples were collected into BD Vacutainer Sodium Heparin tubes (Becton, Dickinson) and shipped overnight at ambient temperatures to the Transplantation Applied Biomarker Laboratory at BC Children’s Hospital Research Institute (Vancouver, BC, Canada). Upon arrival of the blood samples, plasma was isolated from blood cellular components and stored at -80°C. A heparinized plasma aliquot was collected from the subjects at the onset of cGVHD and from the controls at 100 ± 14 days, 180 ± 30 days, and 365 ± 30 days post-HSCT. The plasma samples were shipped frozen to the Metabolomics Innovation Centre (AB, Canada) for analysis.
TMIC prime assay DI/LC-MS/MS method
We performed a targeted metabolic analysis of plasma samples by using a combination of direct injection mass spectrometry with a reverse-phase liquid chromatography and gas chromatography. The custom assay identified and quantified up to 150 endogenous metabolites, including amino acids, acylcarnitines, biogenic amines and derivatives, glycerophospholipids, sphingolipids, and sugars. Sample preparation and liquid chromatography/gas chromatography mass spectrometry was performed using previously published methods.14,15
Statistical analysis
In this study, we focused on cGVHD risk assignment and effects of cGVHD at onset. For the D100 risk-assignment analysis, we used fixed-effect multiple regression to contrast metabolite values for subjects that went on to develop either cGVHD or late aGVHD against controls at D100 with each metabolite taken as the response variable. The control group in the risk assignment analysis included subjects that did not develop either late aGVHD or cGVHD at the particular time point. Subjects with either active aGVHD (n = 28) or active cGVHD (n = 10) prior to day +114 (since a D100 sample could be collected as late as day 114) were excluded from the risk-assignment analysis. For the onset analysis, we applied mixed-effect multiple regression to contrast metabolite values of the entire cGVHD cohort against non-cGVHD controls across all measurement time points, with subject-specific intercepts and the number of days post-HSCT to blood drawn as random effects to account for within-subject correlations.
We explored the impact of certain clinical factors as outlined below. To explore the effect of different cGVHD onset periods, we classified the subjects with cGVHD into early-onset (day 0 to 120), intermediate-onset (day 121 to 240), and late-onset (>day 240) and applied fixed-effect multiple regression to contrast metabolite values of subjects with cGVHD at time of onset against their corresponding non-cGVHD controls at D100, 6 months, and 12 months. To examine the diagnostic potential of the metabolites, we compared samples at the onset of cGVHD to the samples obtained from the entire study cohort at various time points, including subjects with GVHD using mixed-effect multiple regression. To evaluate the impact of pubertal status on the metabolic patterns, we classified the subjects into 2 groups, prepubertal and pubertal, based on previously published puberty “cut-off” criteria.16 Specifically, the subjects were divided into 2 groups: girls <10.9 years old and boys <12.4 years old as the prepubertal group, and girls ≥10.9 years old and boys ≥12.4 years old as the pubertal group.16 We also evaluated the impact of various clinical types of cGVHD, such as de novo, progressive, and pulmonary cGVHD, on the metabolic patterns by comparing the metabolite values in the onset sample of each clinical type with the onset samples of remaining subjects with cGVHD.
For all analyses, the following clinical variables were used as fixed-effect confounding factors: graft type (peripheral blood stem cells, bone marrow, or cord), donor source (sibling or unrelated), histocompatible (HLA) mismatch, sex (donor and recipient), ABO blood type mismatch, reduced-intensity conditioning or myeloablative conditioning, serotherapy (including anti-thymocyte globulin [ATG] and alemtuzumab), recipient age, the use of total body irradiation, and number of days post-HSCT to sample collection. A metabolite was considered as biologically relevant only if it satisfied all of the following criteria: (1) P ≤ .05; (2) receiver operator characteristic (ROC) area under the curve (AUC) ≥0.60; and (3) effect ratio of ≥1.3 or ≤0.75. ROC AUC was computed by estimating the true positive rate (proportion of cGVHD or late aGVHD correctly classified) against the false positive rate (proportion of controls falsely classified as cGVHD or late aGVHD) for different metabolite thresholds. The effect ratio was calculated as the average metabolite value of subjects with cGVHD (or late aGVHD) divided by the average metabolite value of controls. We chose to use P ≤ .05 to provide a more encompassing view of the metabolomic patterns and explicitly highlight metabolites that either pass the strict Bonferroni correction or the relaxed false discovery rate (FDR) correction. Given that there were numerous tests conducted, the probability of a type 1 error likely exceeded .05, but this would be moderated by the additional ROC AUC and effect ratio criteria, which we confirmed with permutation testing. All analyses were performed using MatLab (MathWorks, Natick, MA).
Informed consent was obtained as per the Declaration of Helsinki.
Results
Risk-assignment analysis of D100 plasma metabolomic patterns prior to the onset of cGVHD and late aGVHD
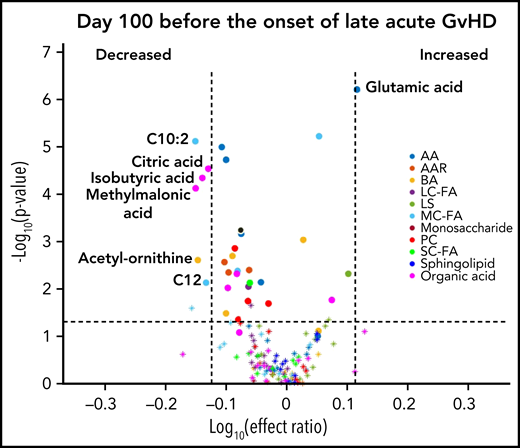
We designed the D100 risk-assignment cohort to include only subjects with no GVHD at the time of sample collection on D100 ± 14 posttransplant. The metabolic patterns of D100 samples of subjects that later developed either cGVHD or late aGVHD were compared with controls that developed no GVHD during the follow-up period. The analysis found elevations in the plasma α-ketoglutaric acid and fumaric acid levels in the D100 samples of subjects who subsequently went on to develop cGVHD when compared with the controls (Figure 1A). Since these metabolites only showed nominal significance, we randomly permuted the sample labels 1000 times to test if type 1 error was moderated by our additional ROC AUC and effect ratio criteria. With this permutation test, we found that these metabolites passed our 3 criteria for <2% of the permutations, hence type 1 error was indeed moderated. Removal of the subjects with mild cGVHD by restricting the analysis to only subjects that later developed the moderate to severe type of cGVHD found a similar metabolic pattern (Figure 1B). Evaluation of D100 samples in subjects that subsequently developed late aGVHD found significantly decreased citric acid, isobutyric acid, methylmalonic acid, and the medium-chain fatty acids (C10:2) with Bonferroni correction when compared with controls. In addition, the late aGVHD cohort had significantly elevated glutamic acid with Bonferroni correction (Figure 2).
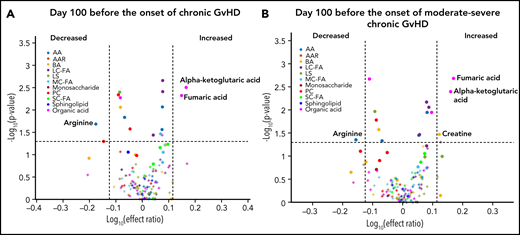
D100 risk-assignment analysis of plasma metabolites to predict the later development of cGVHD. We compared plasma samples obtained at D100 from subjects who later developed: (A) cGVHD ≥day 114 (n = 27), (B) moderate to severe cGVHD ≥day 114 to those who did not develop either late aGVHD or cGVHD. Different groups of metabolites are identified by different colors: amino acids (blue), amino acid-related metabolites (orange), biogenic amines (yellow), long-chain fatty acids (dark purple), lysophosphatidyl cholines (dark green), medium-chain fatty acids (light blue), monosaccharides (dark red), phosphatidyl cholines (red), short-chain fatty acids (bright green), sphingolipids (indigo), and organic acids (pink). Rigorous selection criteria were used, and for markers to be considered biologically relevant they must meet all 3 of the following criteria: (1) P ≤ .05; (2) ROC AUC ≥0.60; and (3) effect ratio of ≥1.3 or ≤0.75.
D100 risk-assignment analysis of plasma metabolites to predict the later development of cGVHD. We compared plasma samples obtained at D100 from subjects who later developed: (A) cGVHD ≥day 114 (n = 27), (B) moderate to severe cGVHD ≥day 114 to those who did not develop either late aGVHD or cGVHD. Different groups of metabolites are identified by different colors: amino acids (blue), amino acid-related metabolites (orange), biogenic amines (yellow), long-chain fatty acids (dark purple), lysophosphatidyl cholines (dark green), medium-chain fatty acids (light blue), monosaccharides (dark red), phosphatidyl cholines (red), short-chain fatty acids (bright green), sphingolipids (indigo), and organic acids (pink). Rigorous selection criteria were used, and for markers to be considered biologically relevant they must meet all 3 of the following criteria: (1) P ≤ .05; (2) ROC AUC ≥0.60; and (3) effect ratio of ≥1.3 or ≤0.75.

D100 risk-assignment analysis of plasma metabolites to predict the later development of late aGVHD. We compared plasma samples obtained at D100 from subjects who later developed late aGVHD ≥day 114 (n = 45) with controls (n = 110) to those who did not develop either late aGVHD or cGVHD. The identical identifying metabolic color code and selection criteria as in Figure 1 were used in this figure.
D100 risk-assignment analysis of plasma metabolites to predict the later development of late aGVHD. We compared plasma samples obtained at D100 from subjects who later developed late aGVHD ≥day 114 (n = 45) with controls (n = 110) to those who did not develop either late aGVHD or cGVHD. The identical identifying metabolic color code and selection criteria as in Figure 1 were used in this figure.
Analysis of the metabolomic pattern at the onset of cGVHD and potential diagnostic biomarker
Using a mixed-effect multi-regression analysis, we compared the plasma metabolomic changes at the onset of cGVHD against controls with no cGVHD across all measurable time points and found increases in the levels of glutamic acid, kynurenine, and α-ketoglutaric acid in the cGVHD group, which are significant with Bonferroni correction (Figure 3A). We also saw decreases in the plasma levels of the medium-chain fatty acid C9, biogenic acid acetyl ornithine, and organic acid p-hydroxyhippuric acid at the time of onset of cGVHD, which are significant with FDR correction (Figure 3A). When we removed subjects with mild cGVHD and restricted our analysis to moderate to severe type of cGVHD, a similar metabolic pattern was noted (Figure 3B). The metabolomic analysis for the onset of late aGVHD could not be performed as the study design did not include the collection of samples at the onset of late aGVHD. We evaluated the impact of previously resolved aGVHD (before D100) on metabolic patterns by removing those that had previous aGVHD as part of the control group. Comparison of patients that had cGVHD to an immune tolerant group that developed neither aGVHD or cGVHD (Figure 3C) found a similar pattern to that seen in Figure 3A.
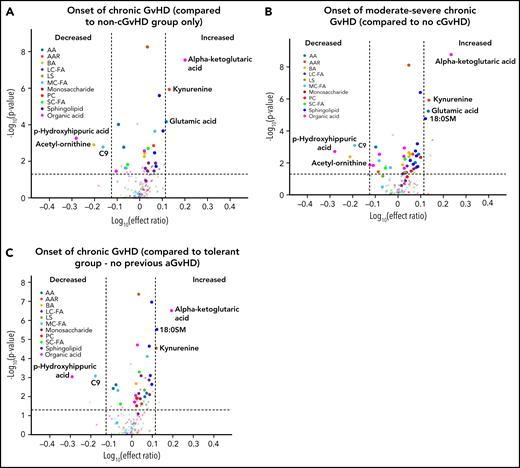
Biological evaluation of metabolic patterns at the onset of cGVHD compared with time-matched controls. We compared plasma metabolomic samples from (A) all subjects at onset of cGVHD (n = 40) to control samples from subjects that did not develop cGVHD at any time point (n = 320); (B) subjects with moderate to severe cGVHD (n = 32) at onset with control samples from subjects that did not develop cGVHD at any time (n = 320); (C) all subjects at onset of cGVHD (n = 40) to immune-tolerant cohort (n = 219), which excluded subjects with previous aGVHD. The identical identifying metabolic color code and selection criteria as in Figure 1 were used in this figure.
Biological evaluation of metabolic patterns at the onset of cGVHD compared with time-matched controls. We compared plasma metabolomic samples from (A) all subjects at onset of cGVHD (n = 40) to control samples from subjects that did not develop cGVHD at any time point (n = 320); (B) subjects with moderate to severe cGVHD (n = 32) at onset with control samples from subjects that did not develop cGVHD at any time (n = 320); (C) all subjects at onset of cGVHD (n = 40) to immune-tolerant cohort (n = 219), which excluded subjects with previous aGVHD. The identical identifying metabolic color code and selection criteria as in Figure 1 were used in this figure.
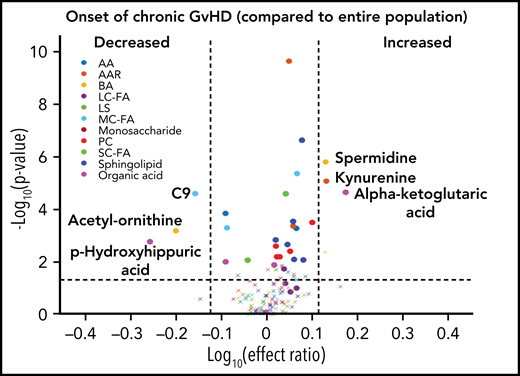
To evaluate the ability of a metabolite to be used as a potential diagnostic biomarker, we performed a mixed-effect multi-regression analysis to contrast the plasma metabolites at the onset of cGVHD (n = 40) against the total samples analyzed across all measurable time points (n = 491) that included subjects with active aGVHD, late aGVHD, and cGVHD (Figure 4). Once again, significant elevations in the plasma levels of α-ketoglutaric acid and kynurenine with Bonferroni correction and significant reductions in the levels of acetyl-ornithine and p-hydroxyhippuric acid with FDR correction were observed, similar to results with non-cGVHD controls only (Figure 3A).

Diagnostic biomarker analysis adjusted for the time of onset of cGVHD on metabolomic biomarker patterns. We compared plasma samples (n = 40) at onset of cGVHD at any time point to all samples (n = 491) from subjects enrolled on the study. The identical identifying metabolic color code and selection criteria as in Figure 1 were used in this figure.
Diagnostic biomarker analysis adjusted for the time of onset of cGVHD on metabolomic biomarker patterns. We compared plasma samples (n = 40) at onset of cGVHD at any time point to all samples (n = 491) from subjects enrolled on the study. The identical identifying metabolic color code and selection criteria as in Figure 1 were used in this figure.
Impact of the time of onset of cGVHD and pubertal status on the metabolomic patterns
We previously observed that the time of onset of cGVHD and the pubertal status of the subjects can impact the immune cell and cytokine patterns associated with cGVHD.16,17 To evaluate the impact of the time of onset of cGVHD on the observed metabolomic patterns, we performed a fixed-effect multiregression analysis where early-onset cGVHD (days 0 to 120 post-HSCT) was compared with the D100 control samples, intermediate-onset cGVHD (days 121 to 240 post-HSCT) was compared with the 6-month control samples, and late-onset cGVHD (>240 days post-HSCT) to the 12-month control samples. A consistent elevation in plasma α-ketoglutaric acid was observed across all 3 time periods. Elevated glutamic acid and kynurenine and decreased p-hydroxyhippuric acid were seen in the early- and late-onset cGVHD cohorts (Figure 5A,C). Arginine was decreased only in the early-onset cGVHD group, and citric acid, glutamine, and betaine were decreased in the late-onset group (Figure 5A,C). The intermediate-onset cGVHD cohort had an increase in the biogenic amines, spermidine, asymmetric dimethylarginine, and methionine sulfoxide (Figure 5B). Evaluation of the entire population samples as in Figure 4, but with restriction to moderate to severe cGVHD found a similar pattern to that seen with the inclusion of mild cGVHD cases (supplemental Figure 1).
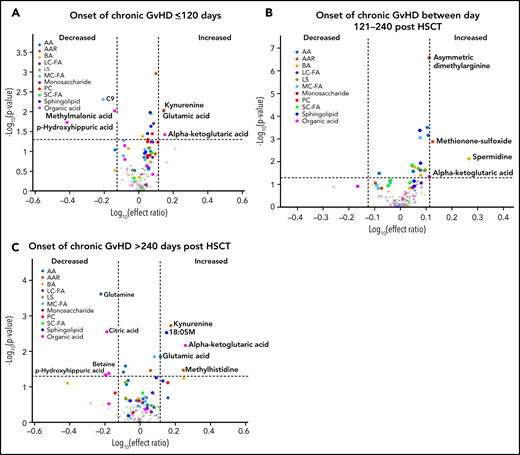
Diagnostic biomarker analysis divided into subgroups for the time of onset of cGVHD on metabolomic biomarker patterns. Subjects were divided into 3 groups based on the time of onset of cGVHD, and the onset samples were compared with time-matched control. (A) The early-onset cGVHD (0-120 days post-HSCT; n = 11) samples to non-cGVHD control samples obtained at 100 ± 7 days (n = 110). (B) The intermediate-onset cGVHD (onset between 121 and 240 days post-HSCT; n = 22) samples to non-cGVHD control samples obtained at 6 months (n = 113). (C) The late-onset cGVHD (onset >240 days post-HSCT; n = 7) and to non-cGVHD control sample obtained at 12 months post-HSCT (n = 97). The identical identifying metabolic color code and selection criteria as in Figure 1 were used in this figure.
Diagnostic biomarker analysis divided into subgroups for the time of onset of cGVHD on metabolomic biomarker patterns. Subjects were divided into 3 groups based on the time of onset of cGVHD, and the onset samples were compared with time-matched control. (A) The early-onset cGVHD (0-120 days post-HSCT; n = 11) samples to non-cGVHD control samples obtained at 100 ± 7 days (n = 110). (B) The intermediate-onset cGVHD (onset between 121 and 240 days post-HSCT; n = 22) samples to non-cGVHD control samples obtained at 6 months (n = 113). (C) The late-onset cGVHD (onset >240 days post-HSCT; n = 7) and to non-cGVHD control sample obtained at 12 months post-HSCT (n = 97). The identical identifying metabolic color code and selection criteria as in Figure 1 were used in this figure.
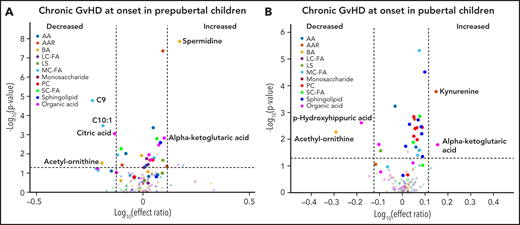
Using the same age and sex-based estimation for the onset of puberty that we used previously,16 the cohort was classified as prepubertal or pubertal. In both cohorts, subjects with cGVHD had elevated levels of α-ketoglutaric acid and reduced levels of acetyl ornithine in their onset samples (significant with FDR correction for the prepubertal cohort) when compared with their respective controls with no cGVHD, with the effect ratio for α-ketoglutaric acid in the prepubertal cohort being very close to our cut off at 1.26 (Figure 6A-B). At the onset of cGVHD, subjects in the prepubertal cohort also had increases in spermidine levels and a decrease in the medium-chain fatty acids C9 and C10:1, and citric acid when compared with prepubertal subjects with no cGVHD (Figure 6A), which are significant with FDR correction. The pubertal cohort had elevated levels of kynurenine and decreased levels of p-hydroxyhippuric acid in their subjects at the onset of cGVHD when compared with controls (Figure 6B), which are significant with FDR correction.

Impact of pubertal status on metabolic biomarker patterns at onset of cGVHD. Subjects were divided into (A) prepubertal and (B) pubertal based on previously published criteria.16 We compared the plasma samples at the onset of cGVHD in (A) prepubertal subjects with cGVHD to prepubertal subjects who did not develop cGVHD, and (B) pubertal subjects with cGVHD to pubertal subjects who did not develop cGVHD. The identical identifying metabolic color code and selection criteria as in Figure 1 were used in this figure.
Impact of pubertal status on metabolic biomarker patterns at onset of cGVHD. Subjects were divided into (A) prepubertal and (B) pubertal based on previously published criteria.16 We compared the plasma samples at the onset of cGVHD in (A) prepubertal subjects with cGVHD to prepubertal subjects who did not develop cGVHD, and (B) pubertal subjects with cGVHD to pubertal subjects who did not develop cGVHD. The identical identifying metabolic color code and selection criteria as in Figure 1 were used in this figure.
Evaluation of metabolomic changes in different clinical types of cGVHD
We performed a subgroup analysis of different types of cGVHD by limiting the controls to those with cGVHD only (n = 40). In this analysis, subjects with de novo cGVHD (n = 7) had elevated plasma indole acetic acid in their onset sample when compared with other subjects with cGVHD (Figure 7A). Subjects with progressive cGVHD (n = 16) had elevated glutamic acid, phosphatidyl choline (PC36:6AA), and lysophosphatidyl choline (LYSOC26:1) at time of onset (Figure 7B). The subjects with pulmonary cGVHD (n = 10) had a significant decrease in plasma serotonin levels and an increase in phospholipids, LYSOC14:0, and PC36:6AA in their onset samples (Figure 7C).
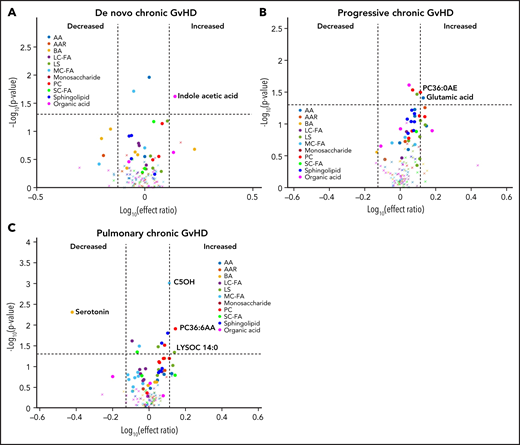
Evaluation of metabolic patterns in different clinical presentation of cGVHD. We categorized different subgroups of cGVHD based on their clinical types at onset and compared them to other subjects with cGVHD. We compared each category to onset plasma samples of the remaining subjects with cGVHD: (A) de novo cGVHD; (B) progressive cGVHD; (C) pulmonary cGVHD. The identical identifying metabolic color code and selection criteria as in Figure 1 were used in this figure.
Evaluation of metabolic patterns in different clinical presentation of cGVHD. We categorized different subgroups of cGVHD based on their clinical types at onset and compared them to other subjects with cGVHD. We compared each category to onset plasma samples of the remaining subjects with cGVHD: (A) de novo cGVHD; (B) progressive cGVHD; (C) pulmonary cGVHD. The identical identifying metabolic color code and selection criteria as in Figure 1 were used in this figure.
Discussion
The identification of valid biomarkers, both risk-assignment biomarkers to predict future development of cGVHD and diagnostic biomarkers, has been difficult given the clinical heterogeneity and biologic complexity of cGVHD. We used a targeted metabolomic approach in a relatively large pediatric HSCT cohort to identify risk-assignment metabolic patterns for both cGVHD and late aGVHD. Previously, our group found distinct D100 immune cell population and cytokine profiles prior to the onset of both cGVHD and late aGVHD.5 Our current analysis, using the same cohort of subjects, found distinctive D100 metabolic patterns for both late aGVHD and cGVHD prior to their clinical onset (Figures 1 and 2). The timing of sample collection has been considered crucial in GVHD studies as introduction of therapeutic immune-suppressive agents can affect the biomarker pattern. By excluding subjects with active GVHD and adjusting the metabolites for multiple clinical variables such as use of serotherapy, a well-characterized cohort was analyzed. The different metabolic patterns observed in the study for late aGVHD and cGVHD, as well as the previously observed immune cell populations and cytokine profiles, support the hypothesis that they are not only clinically different but also have separate biological entities.5,18 These unique patterns in combination may help in the derivation of risk-assignment algorithms for late aGVHD or cGVHD.
The most consistent plasma metabolic pattern seen in our cGVHD cohort is an elevated plasma α-ketoglutaric acid, both prior to the onset and at the time of the onset of cGVHD (Table 1). Notably, α-ketoglutaric acid was elevated in the clinically important moderate to severe grades of cGVHD. The diagnostic biomarker analysis also observed an elevation in α-ketoglutaric acid for moderate to severe cGVHD. To test the predictive power of α-ketoglutaric acid, we performed 2 preliminary classification analyses. To assess how well α-ketoglutaric acid predicted a patient at risk for cGVHD, we randomly set aside 10 patients who will develop cGVHD and 10 non-GVHD controls for testing and used the rest of the day 100 patient samples for training a logistic regression model. Over 1000 repeats of this random resampling procedure, the average accuracy, log odd ratio, positive predictive value, and negative predictive value and their standard errors are 0.5677 ± 0.0024, 0.6577 ± 0.0053, 0.6625 ± 0.0068, and 0.5887 ± 0.0042, respectively. To assess how well α-ketoglutaric acid can classify cGVHD patients against all other patients, we randomly set aside 10 cGVHD patients’ onset samples and 10 control samples for testing and used the rest of the patient samples for training a logistic regression model. Samples from cGVHD patients prior to cGVHD development were included as control samples. Over 1000 repeats of this random resampling procedure, the average accuracy, log odd ratio, positive predictive value, and negative predictive value and their standard errors are 0.6042 ± 0.0031, 0.6938 ± 0.0034, 0.6484 ± 0.0061, 0.5988 ± 0.0034, respectively. Our preliminary results suggest that α-ketoglutaric acid, most likely in combination with other markers, will be applied in the future as a potential risk assignment (Figure 1A) and diagnostic biomarker (Figure 4). While the time of onset of cGVHD affected the concentration of many other metabolites (Figure 5A-C), α-ketoglutaric acid was elevated in the early-, intermediate-, and late-onset cGVHD subgroups. Previously, we observed that immune cellular and cytokine profiles of cGVHD vary with the time of posttransplant, given the dynamic nature of immune constitution postallogeneic transplant.19 By using time-matched controls, the confounding effect of immune reconstitution postallogeneic transplant has been adjusted in our analysis. The variability in other metabolites supports the immune cell and cytokine findings, and the persistent elevation of α-ketoglutaric acid supports its role as a time-independent marker. Given that elevation in α-ketoglutaric acid on D100 persisted until the onset of cGVHD at different onset times, serial measurements postdiagnosis could help to monitor for cGVHD.
α-Ketoglutaric acid is a key intermediary metabolite of the mitochondrial tricarboxylic acid (TCA) cycle and a product of glutaminolysis. Besides the TCA cycle, α-ketoglutaric acid also plays a role in epigenetic remodeling and has been associated with a number of immune-modulatory effects, including T-cell differentiation and activation of innate and adaptive immune cells.19 α keto glutaric acid also appears to promote collagen translation through mTOR activation and proline hydroxylation, potentially accelerating myofibroblast-mediated fibrosis, a mechanism described in cGVHD.20 Both glutaminolysis and the TCA cycle have been shown to play a central role in the metabolic reprogramming of T cells during their activation,21-24 which is crucial for immune cell responses to external signals like alloantigen.25 Other metabolites found to be significant in our analysis, such as arginine and ornithine, are crucial players in polyamine metabolism. This metabolic pathway was recently shown to play a vital role in CD4+ cell differentiation into defined helper T-cell subsets, and perturbations in polyamine metabolism led to profound proinflammatory changes in preclinical murine models.26 The identification of kynenurine in our analysis also supports the role of indoleamine 2,3-dioxygenase (IDO) in cGVHD, as previously described.27 IDO catalyzes the rate-limiting step in the tryptophan-kynenurine pathway, and inflammatory cytokines induce IDO, which in turn can activate the conversion of l-tryptophan to kynenurine. Preclinical studies in mice have demonstrated upregulation of IDO, especially in the intestinal cells during GVHD.28 Further mechanistic studies in cGVHD are needed to help uncover possible mechanistic pathways driving this complex disease.
In addition to a consistent elevation in α-ketoglutaric acid with cGVHD, we were able to identify changes associated with different clinical presentations of cGVHD, including de novo and progressive types of cGVHD (Table 2). Interestingly, subjects with pulmonary cGVHD had a unique metabolic pattern with elevated lipid derivatives and decreased serotonin levels in their onset samples. As we previously described in the ABLE cohort, pulmonary cGVHD is challenging to diagnose in pediatric patients given the inability to perform pulmonary function tests reliably in young children and lung biopsy being the only available alternative diagnostic option.12 Aberrations involving the phospholipid and sphingolipid metabolisms are being evaluated as potential biomarkers for other pulmonary inflammatory and fibrotic disorders.29,30 A less invasive rapid plasma-based clinical biomarker could potentially aid in the early diagnosis of pulmonary GVHD, especially in children. Since these analyses included small numbers of each cGVHD subgroup, validation in additional cohorts is needed.
Identification of potential biomarkers using high throughput metabolic data can be challenging, especially with a small sample size and limited variability in the distribution of output in various clinical phenotypes. The metabolic patterns observed in the published adult cGVHD studies are different from our pediatric cohort (supplemental Table 2). Whether this reflects the impact of recipient age on the metabolic patterns is unclear as α-ketoglutaric acid appears to be an age-independent marker in our pediatric analysis (Figure 6; Table 2). Also, there is a lack of consistency in the metabolic patterns seen among the adult cohorts. This may be due to the use of different metabolic platforms or the need to control for the impact of clinical variables and the impact of post-HSCT immune reconstitution. The use of a targeted metabolomic approach in our study may be perceived as a drawback due to limited coverage of metabolomes and the risk of overlooking metabolites of interest. However, we feel that a targeted assay based on metabolomic protocols can be replicated more easily among various cohorts, allowing for a quicker transition from bench to clinical application. This study represents the largest prospective, well-characterized pediatric cohort with cGVHD and late aGVHD to date and is larger than any other adult study. The use of a thoroughly adjudicated clinical database with metabolic parameters adjusted for multiple clinical factors affecting GVHD should help to make the biomarkers more reproducible. A prospective, longitudinal validation PTCTC trial involving 350 patients is currently underway.
Although α-ketoglutaric acid has emerged as the single most consistent metabolite, the variation in other metabolites suggests a dynamic metabolic environment post-HSCT. The use of a single marker as a potential diagnostic or predictive biomarker has not been very successful for cGVHD, and we need to crossvalidate the performance of the metabolites in an independent cohort to arrive at a biomarker panel.31,32 Combining potential metabolic biomarker panels with immune cellular and cytokine markers along with clinical criteria may result in the creation of a biomarker algorithm for accurate risk assignment and diagnosis of GVHD.
Acknowledgments
The study was funded by a Canadian Institutes of Health Research (CIHR) Team grant, CIHR Foundation grant, and Leukemia Lymphoma Canada Grant. The authors thank all caring transplant physicians, nurses, and research personnel that participated in this study to ensure completion. The authors also thank Anat Halevy, the study coordinator for the ABLE study. Ethics committee approval was obtained at all participating institutions.
Authorship
Contribution: G.D.E.C. wrote the manuscript and provided oversight of the clinical aspects of the trial; K.R.S. designed the studies, wrote the manuscript, provided oversight of all aspects of the studies, and evaluated results; D.S. wrote the manuscript, performed analysis, and interpreted results; B.N. performed all statistical analyses; A.K. performed and interpreted all laboratory studies, evaluated results, and wrote the manuscript; S.A. and M.L. performed and interpreted all laboratory studies; E.R.N., J.R., S.K., C.L.K., V.A.L., and T.S. contributed study subjects, adjudicated clinical classification, wrote the manuscript, and interpreted results; D.A.J. and A.C.H. contributed study subjects, adjudicated clinical classification, wrote the manuscript, and interpreted results; M.A.P. provided PBMTC infrastructure, contributed study subjects, adjudicated clinical classification, wrote the manuscript, and interpreted results; H.B., S.W.C., E.H.C., K.A.C., K.A.K., M.B., B.R.O., D.C., J.H.C., M.J., A.B.P., G.C.M., and A.L. contributed study subjects, wrote the manuscript, and interpreted results; E.O. interpretated data and wrote the manuscript; and R.K.G. wrote the manuscript and evaluated results.
Conflict-of-interest disclosure: The authors declare no competing financial interests.
Correspondence: Kirk R. Schultz, BC Children’s Hospital and Research Institute, 950 West 28th Ave, Rm 3102, Vancouver, BC V5Z 4H4, Canada, e-mail: kschultz@nmail.ubc.ca.
The online version of this article contains a data supplement.
There is a Blood Commentary on this article in this issue.
The publication costs of this article were defrayed in part by page charge payment. Therefore, and solely to indicate this fact, this article is hereby marked “advertisement” in accordance with 18 USC section 1734.