Key Points
Paired functional and proteomic measurements of single human CD34+ cord blood cells reveal variable processes leading to lineage-restricted states.
Signaling profiles of individual CD34+ cord blood cells suggest that external cues contribute to the lineage restriction pathways they pursue.

Abstract
Recent advances in single-cell molecular analytical methods and clonal growth assays are enabling more refined models of human hematopoietic lineage restriction processes to be conceptualized. Here, we report the results of integrating single-cell proteome measurements with clonally determined lymphoid, neutrophilic/monocytic, and/or erythroid progeny outputs from >1000 index-sorted CD34+ human cord blood cells in short-term cultures with and without stromal cells. Surface phenotypes of functionally examined cells were individually mapped onto a molecular landscape of the entire CD34+ compartment constructed from single-cell mass cytometric measurements of 14 cell surface markers, 20 signaling/cell cycle proteins, and 6 transcription factors in ∼300 000 cells. This analysis showed that conventionally defined subsets of CD34+ cord blood cells are heterogeneous in their functional properties, transcription factor content, and signaling activities. Importantly, this molecular heterogeneity was reduced but not eliminated in phenotypes that were found to display highly restricted lineage outputs. Integration of the complete proteomic and functional data sets obtained revealed a continuous probabilistic topology of change that includes a multiplicity of lineage restriction trajectories. Each of these reflects progressive but variable changes in the levels of specific signaling intermediates and transcription factors but shared features of decreasing quiescence. Taken together, our results suggest a model in which increasingly narrowed hematopoietic output capabilities in neonatal CD34+ cord blood cells are determined by a history of external stimulation in combination with innately programmed cell state changes.
Introduction
Stable long-term clonal outputs of different types of mature blood cells from transplants of human CD34+ cells have been reported in recipients of genetically manipulated transplants.1-3 However, the mechanisms orchestrating the timing, durability, and diversity of the underlying differentiation processes remain poorly understood. Historically, these have been modeled as involving sequential bifurcating events, similar to processes believed to occur during early development.4,5 These models were based largely on the identification of in vitro conditions that support the concomitant production of multiple lineages of cells and the identification of phenotypes that allow the differential enrichment of the progenitors thus detected.6-12 However, studies have suggested that different, and even alternative, lineage restriction pathways may exist.6,13,14 Related high-content single-cell transcriptome data also now point to a more continuous process of hematopoietic lineage restriction in both mice15,16 and humans.14,17,18 Accruing epigenomic data also support the concept of a continuum in which cells with progressively “primed” lineage features are distributed throughout previously defined progenitor phenotypes.15,17-20
These findings have evoked interest in agnostic molecular characterizations of primitive hematopoietic cells and the use of index sorting to pair proteomic and biological properties of closely matched phenotypes.21-23 Mass cytometry24 is well suited to such studies because it allows the simultaneous quantification of dozens of surface epitopes as well as intracellular proteins at high resolution in hundreds of thousands of individual cells. It thus overcomes the inability to infer protein levels from some transcript measurements,21,25-27 particularly proteins that undergo externally induced posttranslational modifications implicated in cell fate changes.28,29 The combined use of surface and intracellular single-cell measurements also enables different levels of internal regulators to be correlated with the precise surface marker profiles used to interrogate the biological properties of viable cells.21,30,31
We now report the application of this general strategy to the entire lineage-negative (lin–) CD34+ subset of normal human cord blood (CB) cells in conjunction with an assessment of their clonal outputs in short-term cultures that support the efficient and simultaneous production of erythroid (E), neutrophil/monocyte (NM), and lymphoid (L) cells. Integration of data from both types of measurements produced a probabilistic display of variable molecular transitions that individual CD34+ CB cells undergo during their restriction in vivo to single mature blood cell precursor states.
Materials and methods
Preparation of human CB cells
Anonymized consented heparinized samples of normal CB cells were obtained with informed consent according to University of British Columbia Research Ethics Board–approved protocols. CD34+ cells (>50%) were isolated by using the EasySep kit from the light-density fraction of RosetteSep-depleted CD11b+CD3+CD19+ cells (STEMCELL Technologies, Vancouver, BC, Canada) and then used either directly or after cryopreservation in dimethyl sulfoxide and fetal bovine serum (STEMCELL Technologies).
Flow cytometry and index sorting
Cells were suspended in Hanks’ Balanced Salt Solution supplemented with 5% human serum and 1.5 µg/mL anti-human CD32 antibody (Clone IV.3; STEMCELL Technologies). They were then stained with designated antibodies (supplemental Table 1, available on the Blood Web site) for 1 to 2 hours on ice before index sorting on a FACSAria Fusion sorter (BD Biosciences, Franklin Lakes, NJ).
In vitro assays
Colony formation in methylcellulose was assessed by single, randomly selected, index-sorted cells deposited directly and individually into the 60 inner wells of a flat bottom Nunc 96-well polystyrene plate (Thermo Fisher Scientific, Waltham, MA) preloaded with 50 µL of methylcellulose medium; the medium was supplemented with 50 ng/mL stem cell factor (SCF), 20 ng/mL granulocyte-macrophage colony-stimulating factor, interleukin-3 (IL-3), interleukin-6, granulocyte-colony stimulating factor (G-CSF), and 3 U/mL erythropoietin (EPO) (STEMCELL Technologies). Plates were incubated for 2 to 3 weeks at 37°C in a humidified atmosphere of 5% carbon dioxide in air; each well was then imaged to allow colony type assignments.
For assays in short-term stroma-containing cultures, randomly selected, index-sorted cells were deposited into the 60 inner wells of a 96-well plate. The plate was preloaded with 9000 MS-5 cells and 333 each of M210B4 mouse fibroblasts expressing human IL-3 and G-CSF, and sl/sl mouse fibroblasts expressing human SCF and IL-3, and human FLT3L, with Minimum Essential Medium–alpha modification with 2 mM glutamine, 7.5% fetal bovine serum, and 10−4 M β-mercaptoethanol (MilliporeSigma, Burlington, MA); 50 ng/mL SCF (Novartis, East Hanover, NJ), 10 ng/mL FLT3L (Immunex Corporation, Seattle, WA), 10 ng/mL interleukin-7 (R&D Systems, Minneapolis, MN), and 3 U/mL EPO (STEMCELL Technologies) were added for the first 2 weeks, and 3 U/mL EPO and 10 ng/mL interleukin-7 only for the last week. These cultures were also incubated at 37°C in 5% carbon dioxide in air, and weekly half-medium changes were performed. After 3 weeks, all cells were harvested, stained with antibodies (supplemental Table 2), and assessed by fluorescence-activated cell sorting to detect clones of >10 cells belonging to one or more of the following cell populations: NM (CD45+11b+33+14+/−), B (CD45+11b–33–10+19+56–), natural killer (NK) (CD45+56+11b+/−33–14–7–), E (CD45–GPA+), or T-precursor (CD45+11b–33–56–10–19–CD7+). Clones containing >10 CD45+34+ events in the absence of any mature cells were defined as “blast” clones.
Data analysis
Statistical testing and cytometry data were analyzed with R statistical software (using a combination of package “flowCore” and custom scripts; R Foundation for Statistical Computing, Vienna, Austria). Additional details are given in the supplemental Methods.
Results
Conventionally accepted CD34+ progenitor phenotypes fail to isolate lineage-restricted subsets
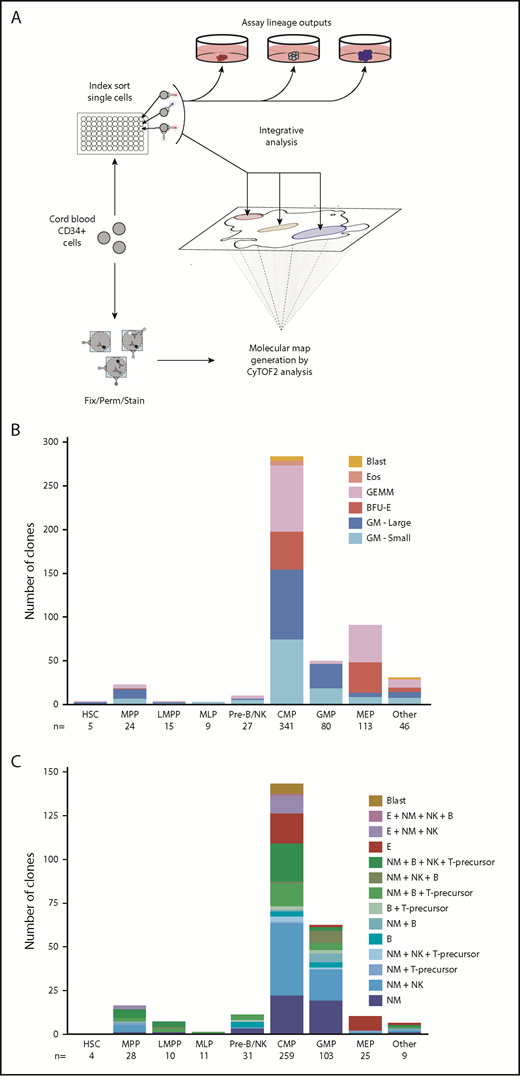
The general experimental plan used to ascertain previously undocumented relationships between proteomic features and lineage output potentialities of lin–CD34+ CB cells is shown schematically in Figure 1A. The initial experiments were undertaken to determine the relative frequencies of cells with different clonal outputs of maturing erythroid cells (E), granulocytes (G), macrophages (M), eosinophils (Eos), and/or blasts in 660 micro-methylcellulose cultures (MCs), initiated with single index-sorted cells drawn randomly from the entire lin–CD34+ CB compartment (in assays of 3 separate large pooled CB samples stained with 13 cell surface antibodies) (supplemental Figure 1A; supplemental Table 1). The lineage composition of each of the 491 clones detected 2 to 3 weeks later (>20 cells/clone, 74% cloning efficiency) was scored blind, and the origin of each was then assigned retrospectively to 1 of 8 conventionally accepted CD34+ subsets based on its indexed surface marker profile (Figure 1B). Thirteen percent of the clones contained exclusively E (hemoglobinized) cells, 39% either many (>1000) or fewer (20-1000) exclusively GM (clear spherical) cells, 0.8% exclusively Eos (highly refractile) cells, 21% an obvious mixture of E+GM cells (GEMM colonies), and 1% contained <100 dispersed cells not readily assigned to any lineage (designated as blasts). Megakaryocytes known to be produced under these conditions32 were not specifically identified.

Distribution of differentiated cell outputs of defined phenotypes of lin– CD34+ CB cells. (A) General experimental design. (B-C) Number of input cells in each of the 8 CD34+ input phenotypes analyzed with the output activities shown. Hematopoietic stem cells (HSC): CD34+CD38–CD45RA–CD90+CD49f+. MPPs: CD34+CD38–CD45RA–CD90–CD49f–. LMPPs: CD34+CD38–CD10–CD45RA+. MLPs: CD34+CD38–CD10+CD45RA+. CMPs: CD34+CD38+CD10–CD135+CD45RA–. MEPs: CD34+CD38+CD10–CD135–CD45RA–. GMPs: CD34+CD38+CD10–CD135+CD45RA+. Pre–B/NKs: CD34+CD38+CD10+CD45RA+. The number of input cells (n) within each phenotype is also shown. Legends indicate the combinations of lineages observed visually in (B) MC assays or (C) according to flow cytometry in STCs. (B) Number of 6 types of clonogenic cells identified in single-cell MC assays of 660 randomly selected, index-sorted lin–CD34+ CB cells (3 experiments). (C) Number of cells with indicated cellular outputs assessed in 3-week single-cell STC assays of 480 randomly selected, index-sorted lin–CD34+ CB cells (2 experiments).
Distribution of differentiated cell outputs of defined phenotypes of lin– CD34+ CB cells. (A) General experimental design. (B-C) Number of input cells in each of the 8 CD34+ input phenotypes analyzed with the output activities shown. Hematopoietic stem cells (HSC): CD34+CD38–CD45RA–CD90+CD49f+. MPPs: CD34+CD38–CD45RA–CD90–CD49f–. LMPPs: CD34+CD38–CD10–CD45RA+. MLPs: CD34+CD38–CD10+CD45RA+. CMPs: CD34+CD38+CD10–CD135+CD45RA–. MEPs: CD34+CD38+CD10–CD135–CD45RA–. GMPs: CD34+CD38+CD10–CD135+CD45RA+. Pre–B/NKs: CD34+CD38+CD10+CD45RA+. The number of input cells (n) within each phenotype is also shown. Legends indicate the combinations of lineages observed visually in (B) MC assays or (C) according to flow cytometry in STCs. (B) Number of 6 types of clonogenic cells identified in single-cell MC assays of 660 randomly selected, index-sorted lin–CD34+ CB cells (3 experiments). (C) Number of cells with indicated cellular outputs assessed in 3-week single-cell STC assays of 480 randomly selected, index-sorted lin–CD34+ CB cells (2 experiments).
Lineage outputs from the 8 conventionally described phenotypes confirmed expected associations6,33 but with several notable deviations (Figure 1B; supplemental Table 3). This outcome included the finding that one-half of the 68% of input cells classified as megakaryocyte/erythroid progenitors (MEPs) that produced some E cells also had GM activity, and another 12% of the MEPs appeared GM-restricted. Input cells classified as granulocyte-macrophage progenitors (GMPs) had more closely predicted GM-restricted progenitor content (58%), but this accounted for only 18% of all of the CD34+ GM-restricted progenitors detected, 60% of which were identified as common myeloid progenitors (CMPs). For the input cells classified phenotypically as pre–B/NK progenitors (pre-B/NKs), 11% exhibited GEMM clonogenic activity. Most of the small blast colonies, and all of the Eos colonies, were generated from CMPs. These results show that all of the phenotypes of CD34+ CB cells conventionally accepted as lineage-restricted contained cells able to generate some progeny of another lineage and also did not capture all of those progenitors that did display a lineage-restricted output potential.
We then repeated this analysis by using a 3-week version of a previously described 6-week stroma-containing clonal culture system, with added EPO to detect the production of E progeny as well as NM and multiple types of lymphoid (L) precursors21 from CD34+CD38+ CB cells. A total of 480 single index-sorted CB cells, again drawn randomly from the total lin–CD34+ compartment, were then evaluated for their differentiation potential in this short-term culture (STC) system (2 independent experiments). After 3 weeks, 55% of these cultures (263 of 480) contained ≥50 round translucent cells (Figure 1C) and 54% (256 of 480) contained sufficient cells for their individual analysis according to flow cytometry (>10 viable human cells detected/culture) (supplemental Figure 2; supplemental Table 4). Because not all granulocytes share a common upstream progenitor,13 we used the more specific term, NM, to describe neutrophil/macrophage outputs in the STC assays.
Analysis of the clonally determined lineage outputs of the same 8 retrospectively assigned CD34+ CB phenotypes in the STC system (Figure 1C; supplemental Table 4) showed that these displayed an even broader heterogeneity than was evident in the MC assays. Thus, 8% of MEPs showed either NM or B-lineage potential, and a greater proportion of GMPs displayed combinations of B-lineage, T-precursor, and/or NK as well as NM progeny vs NM-restricted activity (36%), extending results from recent related reports.6,13,18 Similarly, most of the clonogenic pre–B/NK cells (73%) produced NM progeny, and in 3, only NM. No clones of exclusively NK or T-precursors were detected, and most clones containing T-precursors also contained NM and B-lineage cells (83%), nearly two-thirds of which (63%) also contained NK cells. Most of the clones derived from CMPs (80%) contained some NM progeny and B-lineage cells, and were detected in 30% overall. Interestingly, all CMP-derived clones that contained both NM and E progeny (8% of all CMP-derived clones) also contained NK cells, and 1 also contained B-lineage cells. Another 4% of the CMP-derived clones contained CD45+34+ cells in the absence of any cells expressing mature lineage markers, similar to the origin of the putative “blast” colonies identified in the MC cultures. Only 1 of the 11 multilymphoid progenitors (MLPs) tested produced a clone, and it contained NM, B, and NK cells; however, 7 of the 10 lymphoid-primed multipotent progenitors (LMPPs) produced detectable clones, 6 of which contained NM+B with NK and/or T-precursors. All but 1 of the 16 clonogenic multipotent progenitors (MPPs) produced both L and NM progeny, and 2 also produced E cells. Analyzable progeny were not evident in the very small number of STCs initiated with a cell with the hematopoietic stem cell phenotype.
Phenotypes with improved purities of lineage-restricted progenitors
We next analyzed the index sort data to identify the phenotypes of cells that had been classified as E, NM, or L-restricted in the STC assay. This analysis yielded a new 6-marker gating strategy for these cells (Figure 2A; supplemental Table 5). From these data, in combination with the results of clonal STC assays of these latter phenotypes isolated from 2 additional single CB donors, we found 36% of CD45+34+38hi71+ (P-Es) to be E-restricted, 37% of CD45+34+38hi71– (P-NMs) to be NM-restricted, 34% of CD45+34+38mid71–45RA+10hi (P-Ls) to be B/T/NK-restricted, and CD45hi34hi38mid71–10– (P-Mix) to be multipotent (47% able to produce NM+L±E progeny). The lineage output purities of P-NM and P-L phenotypes are both higher than those of the GMP (P = .004) and pre–B/NK (P = .01) phenotypes, respectively (supplemental Table 6). The more primitive CD34+38– fraction could also be subdivided on the basis of CD10 and CD45RA expression to segregate cells with lymphoid-restricted potential (CD45RA+10hi) from those with NM+L±E mixed-lineage potential (CD10–) (Figure 2B).
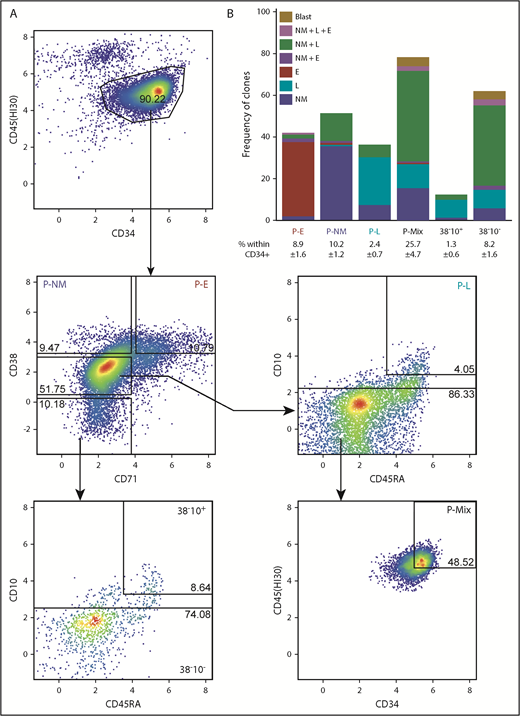
Phenotypes of clonogenic cells with relatively homogeneous output activities. (A) Representative fluorescence-activated cell sorting plot of a gating strategy to isolate functionally more homogeneous lin–CD34+ CB progenitors. (B) Mean combinatorial outputs of NM, E, and L (B, NK, or T-precursor) cells from each gated population in clonal STC assays (4 independent experiments). Mean ± SD for the frequency of each population within the lin–CD34+ compartment is indicated below the relevant labels. See also supplemental Tables 4 and 5.
Phenotypes of clonogenic cells with relatively homogeneous output activities. (A) Representative fluorescence-activated cell sorting plot of a gating strategy to isolate functionally more homogeneous lin–CD34+ CB progenitors. (B) Mean combinatorial outputs of NM, E, and L (B, NK, or T-precursor) cells from each gated population in clonal STC assays (4 independent experiments). Mean ± SD for the frequency of each population within the lin–CD34+ compartment is indicated below the relevant labels. See also supplemental Tables 4 and 5.
CD34+ cells with highly restricted lineage outputs remain molecularly heterogeneous
We next explored how the variable levels of 40 proteins previously measured by using mass cytometry in 280 298 similarly isolated, single viable lin–CD34+ CB cells are distributed across the phenotypically and functionally defined subsets analyzed. The 40 proteins examined consisted of 6 transcription factors (TFs), 18 activated cell-signaling intermediates, 2 indicators of cell cycle status, and 14 cell surface markers (given in the FlowRepository database with repository identification #FR-FCM-ZYFV). Comparison of the mass cytometry data with publicly accessible transcriptome data for the same phenotypically defined cell types (GSE4241434 ) (supplemental Figure 1B; supplemental Table 7) revealed a significant positive correlation with any probe in the Illumina data for 21 of the 40 proteins examined (median r = 0.51; interquartile range, 0.35-0.60 for positively correlated probes/markers). All remaining markers had either no correlation or a negative correlation (supplemental Figure 3), highlighting the novel information obtained from analyzing protein levels rather than transcript levels.21,30,31,35
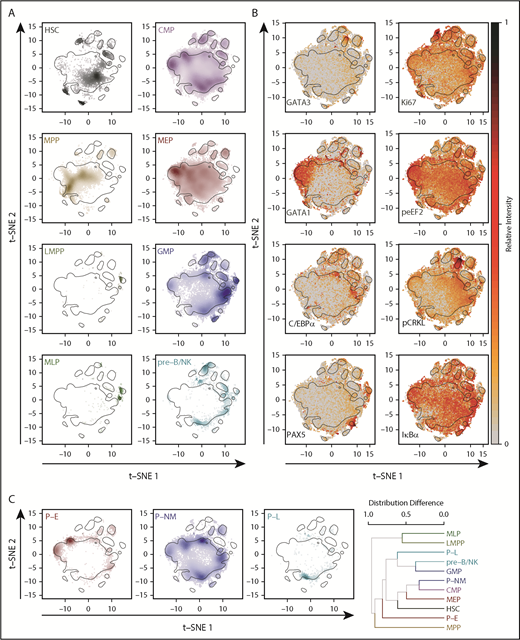
The 2-dimensional molecular profiles obtained for each of the 8 conventionally defined phenotypes were separable in the t-distributed stochastic neighbor embedding (t-SNE)36,37 space (Figure 3A) (P values < .001 in both t-SNE dimensions, Kruskal-Wallis rank sum test) and showed numerous anticipated associations (eg, GATA1 with MEPs,38,39 C/EBPα with GMPs,40,41 PAX5 with pre-B/NK and MLPs42 ) (Figure 3B; supplemental Figure 4). When the overall protein distribution was analyzed, the interrelatedness of phenotypic populations was also generally as expected, including a high degree of overlap between the GMP and pre–B/NK phenotypes (median, 64%; interquartile range, 61%-66%), consistent with functional evidence of their relatedness13 (Figure 3C). Nevertheless, significant deviation from unimodality was present in all subsets (Hartigan’s Dip test, Holm-corrected P < .01 in ≥1 dimension) and was particularly notable in the CMP phenotype in which 5 modes could be readily distinguished (supplemental Figure 5A). Some of these modes identified cells expressing high levels of GATA1 and lower levels of PU.1 and C/EBPα, and others had opposite profiles (supplemental Figure 5B). A higher expression of CD71 was also noted in the GATA1-high CMPs, with higher expression of CD114 (G-CSF receptor), CD33, and CD133 in the PU.1-high CMPs (supplemental Figure 5C). These latter results support the concept that CB CMPs comprise a mixture of molecularly distinct subsets, including some with either erythropoietic or granulopoietic potential.14 Interestingly, a number of signaling intermediates also exhibited differential distributions across the t-SNE landscape with significant differences between phenotypes.

Progenitor phenotypes exhibit distinct but overlapping molecular profiles. (A) t-SNE distributions determined from the levels of different surface and intracellular markers for each lin–CD34+ CB phenotype analyzed. Increasing cell densities are indicated by increasing color intensities. Black contours delineate the 75th quantile of the overall density distribution. Plots for the CD34+CD38– subpopulations are shown on the left, and for the CD34+CD38+ subpopulations, on the right. (B) Relative levels of different TFs (left) and signaling proteins (right) across the t-SNE distributions of all CD34+ cells analyzed. (C) t-SNE distributions for alternative phenotypes are shown as in (A). The far-right panel shows a hierarchical clustering of all phenotypically defined populations (8 conventional phenotypes plus 3 new phenotypes) based on pairwise differences in their density distributions. HSC, hematopoietic stem cells.
Progenitor phenotypes exhibit distinct but overlapping molecular profiles. (A) t-SNE distributions determined from the levels of different surface and intracellular markers for each lin–CD34+ CB phenotype analyzed. Increasing cell densities are indicated by increasing color intensities. Black contours delineate the 75th quantile of the overall density distribution. Plots for the CD34+CD38– subpopulations are shown on the left, and for the CD34+CD38+ subpopulations, on the right. (B) Relative levels of different TFs (left) and signaling proteins (right) across the t-SNE distributions of all CD34+ cells analyzed. (C) t-SNE distributions for alternative phenotypes are shown as in (A). The far-right panel shows a hierarchical clustering of all phenotypically defined populations (8 conventional phenotypes plus 3 new phenotypes) based on pairwise differences in their density distributions. HSC, hematopoietic stem cells.
We also re-analyzed the mass cytometry data on the basis of our more lineage-restricted phenotypes (Figure 3C). However, even these remained significantly multimodal (Hartigan’s Dip test, Holm-corrected P < .001 in ≥1 t-SNE dimension). However, despite the overall heterogeneity in the protein profiles of all phenotypes analyzed, their interrelatedness (derived from pairwise calculations of the overlap of their molecular properties in the t-SNE distributions) was similar to the expected hierarchical structure. Importantly, these results were consistent even when the data for each CB sample were analyzed individually (congruence among distance matrices test, a permutation-based test for concordance among distance matrices,43 Holm-corrected P < .001 for all samples).
To test whether the observed molecular relatedness/heterogeneity might be an artifact of the analytical methods used, we also subjected the same data to pairwise correlation analyses, hierarchical clustering, principal component analysis, and iso- and diffusion mapping. For these tests, a spiked-in CD34–CD33–CD45RA+ cell population of mature lymphoid cells (designated as B/T) was included to serve as an out-group. In all tests, the mature B/T cells were separated from the entirety of the CD34+ cells, with the latter still remaining poorly resolved (supplemental Figure 6). The poor resolution of the lin–CD34+ cells into subsets was also not improved by increasing the number of dimensions.
To investigate the major proteomic contributors to the heterogeneity seen in the t-SNE data for the 8 conventionally defined lin–CD34+ CB cell phenotypes, we also examined the various classes of markers assessed separately or together in groups. As anticipated, a good separation between the designated phenotypes was observed when the analysis was confined to the surface marker data (Figure 4). However, addition of the TF data to the surface marker data decreased rather than improved the resolution of subsets (Holm-corrected P < .001), and exclusive analysis of TF levels, or of the signaling intermediates, yielded similar relationships between populations to the overall data set (congruence among distance matrices test, Holm-corrected P < .01), albeit with reduced coherence.
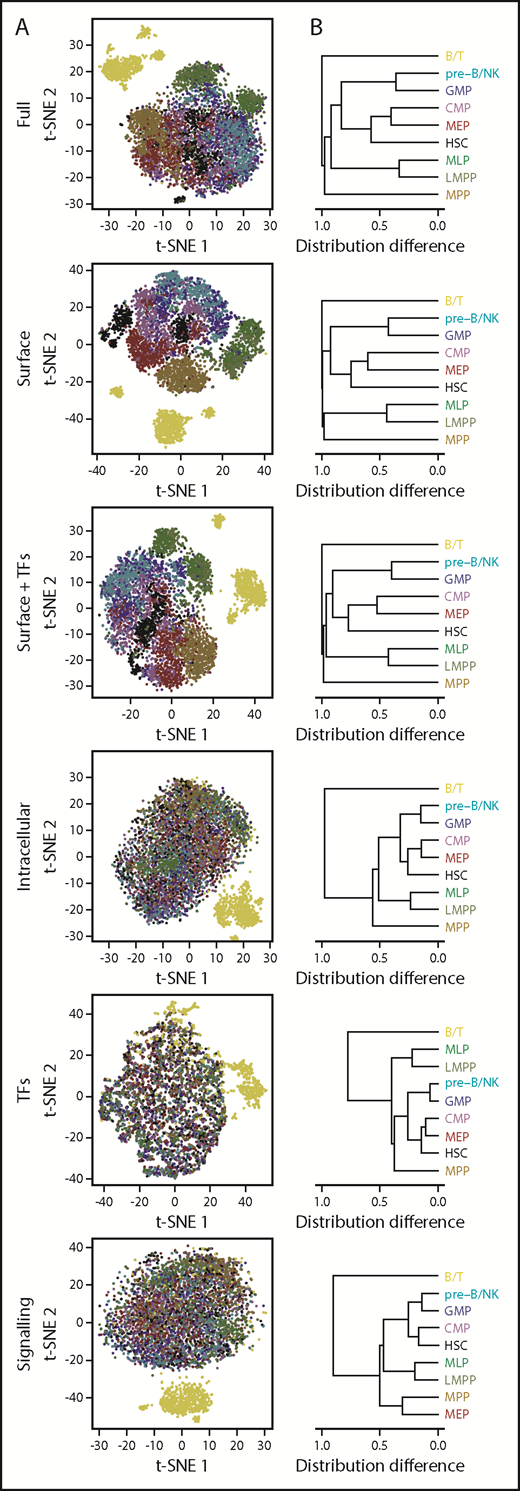
Lineage information is contained in multiple protein parameters, including signaling states. (A) t-SNE distributions obtained using all 40 analyzed parameters; TFs only (GATA3, PAX5, PU.1, TAL1, CEBPα, and GATA1); surface markers only (CD45RA, CD71, CD45, CD114, CD123, CD34, CD33, CD49f, CD10, CD135, CD38, CD90, HLADR, and CD133); intracellular markers only (pSHP2, GATA3, pCRKL, pSrc, pACC, Cyclin B1, PAX5, PU.1, pSTAT5, pAKT, pSTAT1, pSMAD2/3, pP38, pSTAT3, pMAPKAPK2, IκBα, pCREB, active β-catenin, pERK1/2, Ki67, pSykZap70, TAL1, CEBPα, pS6, GATA1, and peEF2); active signaling intermediates (pSHP2, pCRKL, pSrc, pACC, pSTAT5, pAKT, pSTAT1, pSMAD2/3, pP38, pSTAT3, pMAPKAPK2, IκBα, pCREB, active β-catenin, pERK1/2, pSyk/Zap70, pS6, and peEF2), or surface markers together with TFs. (B) Hierarchical clustering of phenotypically defined populations based on pairwise differences in each of their t-SNE distributions from (A).
Lineage information is contained in multiple protein parameters, including signaling states. (A) t-SNE distributions obtained using all 40 analyzed parameters; TFs only (GATA3, PAX5, PU.1, TAL1, CEBPα, and GATA1); surface markers only (CD45RA, CD71, CD45, CD114, CD123, CD34, CD33, CD49f, CD10, CD135, CD38, CD90, HLADR, and CD133); intracellular markers only (pSHP2, GATA3, pCRKL, pSrc, pACC, Cyclin B1, PAX5, PU.1, pSTAT5, pAKT, pSTAT1, pSMAD2/3, pP38, pSTAT3, pMAPKAPK2, IκBα, pCREB, active β-catenin, pERK1/2, Ki67, pSykZap70, TAL1, CEBPα, pS6, GATA1, and peEF2); active signaling intermediates (pSHP2, pCRKL, pSrc, pACC, pSTAT5, pAKT, pSTAT1, pSMAD2/3, pP38, pSTAT3, pMAPKAPK2, IκBα, pCREB, active β-catenin, pERK1/2, pSyk/Zap70, pS6, and peEF2), or surface markers together with TFs. (B) Hierarchical clustering of phenotypically defined populations based on pairwise differences in each of their t-SNE distributions from (A).
Integration of molecular and cell output data identifies broad groupings of cells with different lineage potentials
We then questioned how lin–CD34+ CB cells with distinct differentiation properties in the MC/STC assays would be distributed in the molecular space described by the mass cytometric data obtained on the entire lin–CD34+ cell compartment. For this analysis, we defined groups of cells according to their lineage outputs and used a k-nearest (10) neighbor algorithm approach to identify probability distributions in the t-SNE space of the molecular properties of each group of cells.21 This approach revealed a general separation of the cells that produced different types of colonies in the MC assays, with the exception of those with GM-restricted activity but variable proliferative ability, and those that generated pure Eos and blast colonies (false discovery rates ≤0.01 in ≥1 t-SNE dimension) (Figure 5A). In addition, all of these distributions were unimodal in both bioassays (P > .05 in both t-SNE directions, Hartigan’s dip test) (Figure 5A-B), with the exception of cells that were not clonogenic or that produced exclusively CD34+ progeny. Cells with multilineage outputs in STC were centrally located and highly overlapping in the t-SNE space (Figure 5B; supplemental Figure 7A). Resampling-based robustness analyses revealed the distributions for all types of progenitors to be highly reproducible (80% to 95% for most), although less so for rarer types, as expected for small data sets (supplemental Methods; supplemental Figure 7B-C).

Functionally defined progenitors with NM, L, and/or E potential display partially overlapping molecular profiles. (A-B) Distribution of each progenitor type in t-SNE space. Index sort information was used to map each progenitor to its nearest 10 neighbors in the mass cytometry data based on the scaled intensity of expression of CD45RA, CD71, CD45, CD123, CD34, CD33, CD49f, CD10, CD135, CD38, CD90, HLA-DR, and CD133. The nearest neighbors for all members of a given progenitor type were pooled and used to generate a probability density, indicated by the intensity of the color shown. The lowest level contains 95% of the total probability density, with each higher 10% density levels indicated thereafter. The black contour shows the 75th quantile of the overall density. (A) Mappings for all progenitor types assessed visually in methylcellulose assays as shown in Figure 1B. (B) Mappings for a representative selection of lineage competencies assessed in the STC assays as shown in Figure 1C. (C) A hierarchical clustering of the progenitor types analyzed based on a pairwise assessment of differences in the density distributions between all mappings of functionally and phenotypically defined cell types. Closely related groups are highlighted and given a descriptive name. (D) Multidimensional scaling indicating the relative distances (based on the distribution differences) between all phenotypically and functionally defined progenitor subsets.
Functionally defined progenitors with NM, L, and/or E potential display partially overlapping molecular profiles. (A-B) Distribution of each progenitor type in t-SNE space. Index sort information was used to map each progenitor to its nearest 10 neighbors in the mass cytometry data based on the scaled intensity of expression of CD45RA, CD71, CD45, CD123, CD34, CD33, CD49f, CD10, CD135, CD38, CD90, HLA-DR, and CD133. The nearest neighbors for all members of a given progenitor type were pooled and used to generate a probability density, indicated by the intensity of the color shown. The lowest level contains 95% of the total probability density, with each higher 10% density levels indicated thereafter. The black contour shows the 75th quantile of the overall density. (A) Mappings for all progenitor types assessed visually in methylcellulose assays as shown in Figure 1B. (B) Mappings for a representative selection of lineage competencies assessed in the STC assays as shown in Figure 1C. (C) A hierarchical clustering of the progenitor types analyzed based on a pairwise assessment of differences in the density distributions between all mappings of functionally and phenotypically defined cell types. Closely related groups are highlighted and given a descriptive name. (D) Multidimensional scaling indicating the relative distances (based on the distribution differences) between all phenotypically and functionally defined progenitor subsets.
We then compared the distribution of the 8 surface marker–defined conventional phenotypes and our newly described progenitors (P-E, P-NM, and P-L) with the mass cytometrically identified groups of cells with different functionally identified lineage output abilities. This comparison revealed a number of distinct groupings and some newly defined associations. One of the latter was an “early” cluster that included MPPs, Eos-restricted progenitors, and a subset of STC-initiating cells that generated only CD34+ progeny and was localized between the erythroid/Mk and mixed lineage clusters (Figure 5C-D). In addition, cells with E potential in the MC or STC were found to cluster with MEPs but were also related as a group closer to the erythroid/MK cluster, and more distantly to the other clusters. Cells with mixed-lineage or L-only potential clustered together, as did those with predominantly NM-restricted outputs in the bioassays. Interestingly, the GMPs, LMPPs, MLPs, and pre–B/NK phenotypes all clustered away from all of the functionally defined cells, suggesting that many of the cells with these latter phenotypes may lack clonogenic activity in the assays performed.
Differences in CD34+ CB cell lineage output capabilities are associated with coordinate changes in signaling, cell cycle status, and TF expression
Mapping of the functionally defined groups of cells from the MC/STC assays onto our 40-parameter molecular map to identify parameters associated with cells capable of different lineage output types confirmed elevated expression of CD135, CD45RA,6 CD133,13 PU.1, and C/EBPα to be associated with NM (± B/T) potential; elevated CD10 with B-restricted activity,8,18 and CD71 and GATA1 with E potential44,45 (supplemental Figure 8-10). Differences in levels of CD34, CD38, and CD33 expression between progenitor types were also evident, with notably higher CD38 expression on cells with restricted E or NM potential. Lineage outputs were also significantly associated with certain active signaling intermediates and indicators of cell cycle status. This finding included increased levels of phosphorylated eEF2 and active (dephosphorylated) β-catenin as selective features of E progenitors.
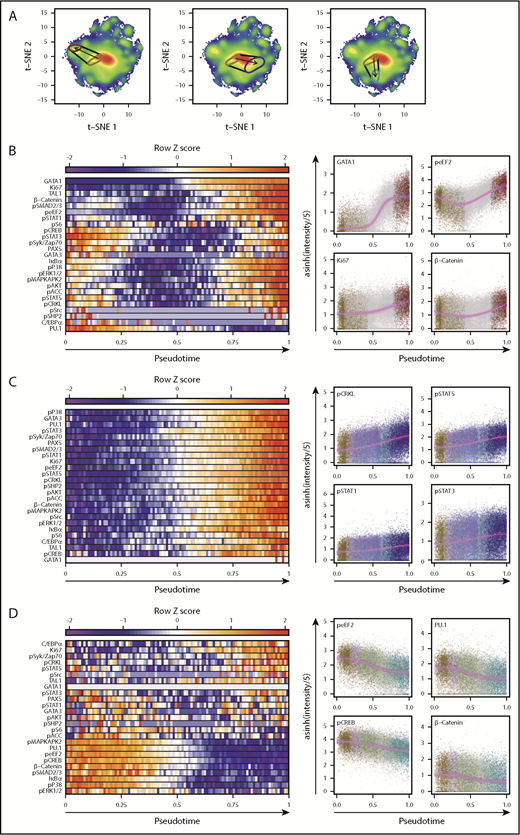
We then used pseudo-temporal ordering to infer paths of differentiation in the overall t-SNE plot starting from cells that produce only CD34+ cells (and no differentiated cells) within 3 weeks in STC to a final E-restricted, NM-restricted, or B-lymphoid–restricted state (Figure 6A). Bootstrap resampling revealed that the fits obtained were highly reproducible in repeatedly resampled data for each trajectory. The results showed numerous parameter levels changed markedly and differentially across the 3 trajectories (Figure 6B-D). The transition to an E-restricted state was the most complex with different parameter-specific dynamics, some of which increased, others that decreased, and a large group that decreased initially and then increased. In contrast, restriction to NM activity showed a unilateral increase in most parameters, and restriction to B-lymphopoiesis was associated with a progressive decrease in most parameters, with subtle increases in a few. Notably, all 3 trajectories were accompanied by an increase in Ki67, suggesting that progressive emergence from deep quiescence is a shared aspect of multiple lineage restriction processes.

Molecular transitions reveal that changes in signaling and cell cycle parameters accompany TF alterations. (A) Pseudo-time axes for transitions between cells that produced CD34+ cells but no mature cells in STC, to STC-E (left), STC-NM (middle), and STC-B (right). Areas enclosing the most probable regions (minimum area containing 15% of the total probability density) of cells with these lineage capabilities are indicated. Start and end points were set as the most probable point in the first category and the progenitors of single lineages, respectively. (B-D) Normalized levels of each intracellular marker are shown across 100 bins of pseudo-time in the left plots. Bin values represent the median level of a given marker for all cells within that pseudo-time bin. Single cells, colored based on their most probable lineage outputs, are shown for the 4 markers that differ the most over pseudo-time in the left plots (highest residuals). Solid violet lines indicate best fits for either linear, sigmoidal, or Gaussian regressions (fit selected by using the Bayesian Information Criterion). Fits from 1000 bootstrap replicates of 1% of the total cells are shown as faint violet lines to indicate a probable range. Transitions from cells that produced only CD34+ progeny in STC to STC-E are shown in (B), to STC-NM in (C), and to STC-B in (D).
Molecular transitions reveal that changes in signaling and cell cycle parameters accompany TF alterations. (A) Pseudo-time axes for transitions between cells that produced CD34+ cells but no mature cells in STC, to STC-E (left), STC-NM (middle), and STC-B (right). Areas enclosing the most probable regions (minimum area containing 15% of the total probability density) of cells with these lineage capabilities are indicated. Start and end points were set as the most probable point in the first category and the progenitors of single lineages, respectively. (B-D) Normalized levels of each intracellular marker are shown across 100 bins of pseudo-time in the left plots. Bin values represent the median level of a given marker for all cells within that pseudo-time bin. Single cells, colored based on their most probable lineage outputs, are shown for the 4 markers that differ the most over pseudo-time in the left plots (highest residuals). Solid violet lines indicate best fits for either linear, sigmoidal, or Gaussian regressions (fit selected by using the Bayesian Information Criterion). Fits from 1000 bootstrap replicates of 1% of the total cells are shown as faint violet lines to indicate a probable range. Transitions from cells that produced only CD34+ progeny in STC to STC-E are shown in (B), to STC-NM in (C), and to STC-B in (D).
Changes in TF levels in these trajectories included previously reported reciprocal changes in GATA1 and PU.1 levels during the early differentiation of E progenitors46-49 (Figure 6B; supplemental Figure 11) and a late activation of TAL1 after the acquisition of peak GATA1 levels, consistent with the reported role of TAL1 in terminal erythropoiesis.50 Unexpectedly, changes immediately preceding GATA1 activation included fluctuations in phospho-eEF2 and active β-catenin (Figure 5B), PKA and MAPK intermediates phospho-STAT5, and phospho-STAT3. This analysis also showed associated early increases in PU.1 and then CEBP/α leading to an NM-restricted state49,51 (Figure 6C; supplemental Figure 12), with an inverse pattern accompanying B-lymphoid restriction (Figure 6D; supplemental Figure 13). Interestingly, this latter sequence was not accompanied by an increase in PAX5, which was, however, evident in the trajectory to NM-restricted cells and was associated with cells having NM+T-precursor or NM+B potential (supplemental Figure 10). NM restriction was also associated with an increase in phospho-CRKL along with all 3 phospho-STATs. Several MAPK intermediates and β-catenin also showed increasing activation with initiation of differentiation, but this finding did not extend to PKA intermediates. In contrast, during B-lymphoid restriction, the levels of most signaling intermediates decreased, except for minimal changes in the phospho-STATs and an early transient increase in phospho-SMAD2/3, followed by a decrease in IκBα (suggestive of activated NF-κB signaling).
Discussion
The present study integrated measurements of the differentiation activity and the levels of 40 proteins determined in large numbers of single cells drawn randomly from the entire CD3–CD19–CD11b–CD34+ population present in normal human CBs. Key to this analysis was the use of a 3-week, growth factor–supplemented, stromal cell–containing culture system that supports the identification of single-input CD34+ cells able to produce any combination of most of the major blood cell lineages. Computational mapping of index-sorted cells to their mass cytometry profiles then allowed a deep interrogation of the relationships between differentiation potentials and molecular states at the single-cell level. The results provide new evidence of extensive promiscuity in the lineage outputs of phenotypes still widely used to isolate cells assumed to have a relatively homogeneous set of lineage potentialities. They also made possible the identification and validation of new phenotypes that reproducibly allow CB progenitors with more consistent differentiation potentials to be isolated. Use of these in a pseudo-temporal ordering approach to identify molecularly defined differentiation trajectories strongly suggests coherent changes in signaling intermediates as consistent aspects of the hematopoietic lineage restriction processes assessed.
The proteomic and functional heterogeneity of conventionally used phenotypes highlight the need for caution in interpreting data derived from their bulk-level analysis. This problem was exemplified in extreme form by the CMP phenotype, which comprises most of the CD34+ compartment and where at least 5 distinct subsets with features expected of either E or NM progenitors, but not both, could be readily discriminated. Interestingly, we detected very few lin–CD34+ CB cells that produced E+NM progeny that did not also generate detectable L cells. These results thus confirm and extend recent similar findings for cells defined as mouse,15,16,52 as well as human, CMPs.14 They also now provide a molecular explanation for the recent report that most cells capable of differentiating into all lineages have an MPP rather than a CMP phenotype. From our survey of the differentiation potential exhibited by >1000 single index-sorted cells, we observed a number of combinations of lineage potencies outside currently described hierarchical models. Conversely, we confirmed that a high expression of CD38 enables progenitors lacking lymphopoietic activity to be separated from others (Figure 2A; supplemental Figure 10), and a high expression of CD71 selects for progenitors with E potential (supplemental Figure 7C).14,18,32,44,53 Together with various recent single-cell studies, these results suggest that although surface marker phenotypes may enrich for different lineage potencies, the sequences of events underlying lineage restriction may not be adequately described at a molecular level by global bifurcations.4,5
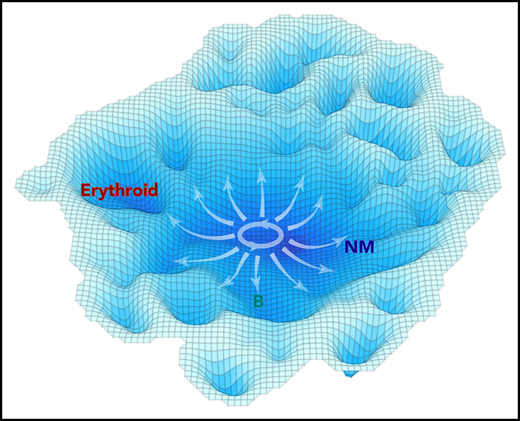
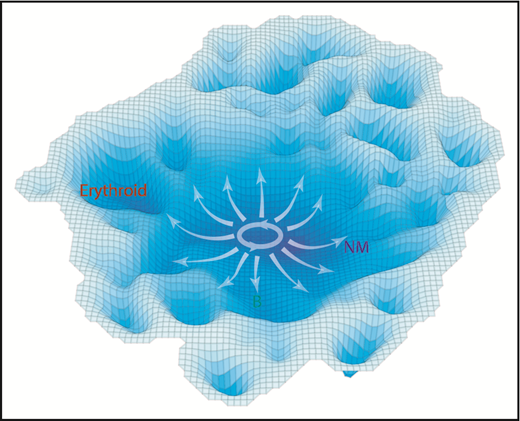
Assuming CD34+ CB cells can be modeled as a nonsynchronized population at equilibrium, the frequency of those in a given molecular state might be considered to be proportional to the stability of that state. Based on this assumption, we generated a model of neonatal hematopoietic differentiation states from the density of progenitors present in the multidimensional space defined by the 40 different molecular features analyzed (Figure 7). Importantly, this model does not reveal highly discriminated states or trajectories within the lin–CD34+ population. Rather, it suggests shallower barriers delimiting distinct differentiation behaviors than previously anticipated, related in part to the history of environmental cues encountered at each stage. Consistent with this model is the finding that the probability densities between all functionally defined subsets are highly overlapping, including those displaying single lineage-restricted outputs. These observations underscore the possibility that relatively small molecular variations may result in lineage restriction. Indeed, one of the more novel findings here is the close association noted between changes in signaling profiles and lineage potential. These results extend previous limited evidence that environmental factors may play an influential role during the process of lineage restriction.54,55 More detailed investigation of the extent and nature of such influences will be an important challenge for the future.

A schematic representation of the molecular landscape of human CD34+ CB cell differentiation. Contours shown are derived from the molecular data using the inverse of the cell density in t-SNE space to estimate the stability of different molecular states. Annotation was added based on functional mapping data. Arrows indicate the multidirectional paths that could be taken from primitive to more restricted differentiation states based on the experimental data.
A schematic representation of the molecular landscape of human CD34+ CB cell differentiation. Contours shown are derived from the molecular data using the inverse of the cell density in t-SNE space to estimate the stability of different molecular states. Annotation was added based on functional mapping data. Arrows indicate the multidirectional paths that could be taken from primitive to more restricted differentiation states based on the experimental data.
The online version of this article contains a data supplement.
The publication costs of this article were defrayed in part by page charge payment. Therefore, and solely to indicate this fact, this article is hereby marked “advertisement” in accordance with 18 USC section 1734.
Acknowledgments
The authors thank M. Hale and G. Edin and the British Columbia Cancer Agency Stem Cell Assay Laboratory staff for technical assistance, including the initial processing of CB samples.
This work was supported by a Terry Fox Foundation New Frontiers Program Project (#1074), a Stem Cell Network of Centres of Excellence grant (#F17/DT2), grants from the Canadian Cancer Society Research Institute (all to C.J.E., #704257 and #705047) and grants from Genome British Columbia and the Canadian Institutes of Health Research (CIHR) as part of the Canadian Epigenetics, Environment and Health Research Consortium Network (CIHR-262119). D.J.H.F.K. held a CIHR Vanier Scholarship, C.A.H. and P.H.M. held CIHR Frederick Banting and Charles Best Doctoral Scholarships, and F.W. held a University of British Columbia Graduate Fellowship. DVS Sciences provided the Palladium barcoding reagents used in the mass cytometry experiments.
Authorship
Contribution: D.J.H.F.K., C.A.H., F.W., and C.J.E. conceived the experiments and wrote the manuscript; D.J.H.F.K. performed all methylcellulose assays, mass cytometry, and data analysis; C.A.H. and F.W. optimized and performed all STC assays; P.H.M. and P.A.B. assisted with experimental design and interpretation; N.A., D.P., C.H., and M.V. assisted with data analysis and interpretation; and S.C.B. and G.P.N. assisted with mass cytometry panel design. All authors read and approved the manuscript.
Conflict-of-interest disclosure: The authors declare no competing conflicts of interest.
Correspondence: Connie J. Eaves, Terry Fox Laboratory, BC Cancer Research Centre, 675 West 10th Ave, Vancouver, BC V5Z 1L3, Canada; e-mail: ceaves@bccrc.ca.