Key Points
miR-144/451 represses only a small subset of bound mRNAs in mouse erythroblasts.
miR-451 represses mitochondrial respiration during erythropoiesis.

Abstract
The microRNA (miRNA) locus miR-144/451 is abundantly expressed in erythrocyte precursors, facilitating their terminal maturation and protecting against oxidant stress. However, the full repertoire of erythroid miR-144/451 target messenger RNAs (mRNAs) and associated cellular pathways is unknown. In general, the numbers of mRNAs predicted to be targeted by an miRNA vary greatly from hundreds to thousands, and are dependent on experimental approaches. To comprehensively and accurately identify erythroid miR-144/451 target mRNAs, we compared gene knockout and wild-type fetal liver erythroblasts by RNA sequencing, quantitative proteomics, and RNA immunoprecipitation of Argonaute (Ago), a component of the RNA-induced silencing complex that binds miRNAs complexed to their target mRNAs. Argonaute bound ∼1400 erythroblast mRNAs in a miR-144/451–dependent manner, accounting for one-third of all Ago-bound mRNAs. However, only ∼100 mRNAs were stabilized after miR-144/451 loss. Thus, miR-144 and miR-451 deregulate <10% of mRNAs that they bind, a characteristic that likely applies generally to other miRNAs. Using stringent selection criteria, we identified 53 novel miR-144/451 target mRNAs. One of these, Cox10, facilitates the assembly of mitochondrial electron transport complex IV. Loss of miR-144/451 caused increased Cox10 mRNA and protein, accumulation of complex IV, and increased mitochondrial membrane potential with no change in mitochondrial mass. Thus, miR-144/451 represses mitochondrial respiration during erythropoiesis by inhibiting the production of Cox10.
Introduction
MicroRNAs (miRNAs) are small RNAs that regulate gene expression posttranscriptionally through a process termed RNA interference (RNAi).1 miR-144/451 is a bicistronic miRNA gene that is the most abundantly expressed miRNA locus in erythroblasts. The miR-451 level rises during erythropoiesis to constitute ∼60% of all miRNA molecules in late erythroblasts.2,3 Deletion of miR-144/451 impairs mouse fetal and adult erythropoiesis. miR-144/451 knockout (KO) fetal livers (FLs) contain reduced numbers of erythroblasts that are delayed in maturation4-6 ; adult KO mice have mild anemia and splenomegaly with increased sensitivity to oxidant stress, profound anemia, and reduced survival after treatment with phenylhydralazine.4,5,7 This phenotype is partly attributable to derepression of the target Ywhaz, causing reduced expression of antioxidant genes,4,7 as well as of Cab39, causing increased adenosine 5′ monophosphate–activated protein kinase/mammalian target of rapamycin signaling.6 However, the full repertoire of messenger RNAs (mRNAs) regulated directly by miR-144/451, and the effects of these interactions on erythropoiesis, are not known.
miRNAs complexed to Argonaute (Ago) and other proteins form the RNA-induced silencing complex (RISC), which binds target mRNAs through base complementarity, typically at a 7 to 8 nucleotide (nt) canonical “seed sequence.” This interaction can inhibit gene expression, primarily not only by inducing mRNA degradation, but also by repressing translation. Although it is clear that RNAi extensively regulates normal tissue homeostasis and disease processes in higher eukaryotes,8 estimated numbers of miRNA-regulated mRNAs in any given cell type vary greatly, ranging from a few hundred9 to one-third of the transcriptome.10-12 To better define physiological roles for RNAi, it is essential to identify all functionally important miRNA-target interactions and their downstream consequences. Solving this problem is technically challenging. Standard RNA sequencing (RNA-Seq) cannot distinguish changes occurring at the transcriptional level from those at the level of mRNA stability. miRNAs can bind mRNAs through canonical and noncanonical seed-sequence matching, complicating the prediction of target genes. Multiple reports estimate that a single miRNA can bind and repress thousands of mRNAs via canonical and noncanonical targeting.13 However, recent work suggests that not all Ago-miRNA–bound mRNAs are repressed, with repression occurring largely through miRNA-mRNA binding at canonical seed sequences.14 Overall, the full repertoire of mRNAs bound by any miRNA and the in vivo consequences of these interactions are incompletely understood, both generally and during erythropoiesis.
We used integrated genomic and proteomic approaches to better define the role of miR-144/451 in erythropoiesis and to investigate general principles of RNAi. Comparison of wild-type (WT) and KO primary erythroblasts by Ago high-throughput sequencing of RNA isolated by crosslinking immunoprecipitation (HITS-CLIP) identified >1000 mRNAs bound by Ago in a miR-144/451–dependent fashion, accounting for approximately one-third of all Ago-bound mRNAs. However, only ∼100 miR-144/451–bound mRNAs were derepressed in KO erythroblasts. Thus, under physiological conditions, most erythroblast mRNAs bound to Ago–miR-144 or Ago–miR-451 are not repressed, a property that likely applies to other miRNAs in other tissues. Our comprehensive approach identified new miR-144/451 targets, including Cox10 mRNA, which encodes an assembly factor for the cytochrome oxidase electron transport complex (COX). Thus, miR-451 inhibits mitochondrial activity during erythroid maturation by repressing Cox10.
Materials and methods
Animal studies were performed under approved ethical protocols at The Children’s Hospital of Philadelphia, St. Jude Children’s Research Hospital, and the National Institutes of Health. miR-144/451−/− mice were generated as described.7 Heterozygous male and female mice were mated to generate +/+ (WT) and −/− (KO) embryos. Embryonic day 14.5 (E14.5) pregnant female mice were euthanized with CO2; FLs were excised from embryos under sterile conditions and dissociated to produce single-cell suspensions of FL cells.
See supplemental Methods (available on the Blood Web site) for additional methods.
Results
miR-144/451 directly represses just over 100 erythroid genes
To comprehensively identify erythroblast genes repressed by miR-144/451, we performed quantitative comparisons of miRNAs (miRNA sequencing [miRNA-Seq]), mRNAs (RNA-Seq), and proteins (tandem mass tag labeling followed by liquid chromatography coupled with tandem mass spectrometry analysis) on E14.5 FL cells from miR-144/451 WT and KO mice. At this developmental stage, ∼95% of FL cells are erythroblasts undergoing semisynchronous maturation.15 miR-451, the most abundant miRNA in WT erythroblasts,3 accounted for almost 20% of miRNA reads by miRNA-Seq (Figure 1A). miR-144-3p and miR-144-5p were much less abundant, despite being encoded on the same bicistronic primary transcript as miR-451.2,7 Notably, loss of miR-144/451 did not alter the relative abundance of other miRNAs in vivo (Figure 1B).
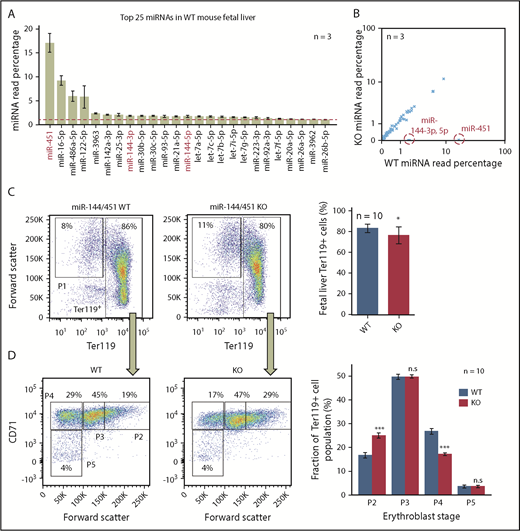
miR-144/451 deletion reduces mature erythroblasts in mouse FL. (A) The 25 most abundant miRNAs in WT erythroblasts, measured by miRNA-Seq. The miRNAs absent in KO erythroblasts are labeled red. Graph shows mean plus or minus standard error of the mean (SEM) for 3 biological replicates. The dotted red line marks 1% abundance. (B) Relative expression of miRNAs in WT vs KO erythroblasts. Each point represents a single miRNA plotted as percentage of total (average for 3 biological replicates). miRNAs absent in KO erythroblasts are circled and labeled in red. (C) Flow cytometry analysis of forward scatter and Ter119 expression in miR-144/451 WT and KO FL erythroblasts. (D) CD71 expression and forward scatter in the Ter119+ populations from panel C. Four progressive stages of erythroblast maturation (P2 to P5) are boxed. Bar graphs at right show mean plus or minus SEM for data from 10 biological replicates. *P < .05; ***P < .001. n.s., not significant by Mann-Whitney U test.
miR-144/451 deletion reduces mature erythroblasts in mouse FL. (A) The 25 most abundant miRNAs in WT erythroblasts, measured by miRNA-Seq. The miRNAs absent in KO erythroblasts are labeled red. Graph shows mean plus or minus standard error of the mean (SEM) for 3 biological replicates. The dotted red line marks 1% abundance. (B) Relative expression of miRNAs in WT vs KO erythroblasts. Each point represents a single miRNA plotted as percentage of total (average for 3 biological replicates). miRNAs absent in KO erythroblasts are circled and labeled in red. (C) Flow cytometry analysis of forward scatter and Ter119 expression in miR-144/451 WT and KO FL erythroblasts. (D) CD71 expression and forward scatter in the Ter119+ populations from panel C. Four progressive stages of erythroblast maturation (P2 to P5) are boxed. Bar graphs at right show mean plus or minus SEM for data from 10 biological replicates. *P < .05; ***P < .001. n.s., not significant by Mann-Whitney U test.
We compared the developmental maturation stages of WT and KO FL erythroblasts by flow cytometry analysis for Ter119, CD71, and forward scatter.16 In agreement with previous findings,4 KO erythroblasts exhibited developmental delay with an increased proportion of immature erythroblasts (P2) relative to mature ones (P4) (Figure 1C-D). KO FLs exhibited reductions in the absolute number of total (Ter119+) erythroblasts and late (P3 and P4) erythroblasts (supplemental Figure 1A-B). Transcriptome studies of unfractionated WT and KO erythroblasts were consistent with this maturation block, but differences in expression of developmental stage-regulated genes were relatively minor (supplemental Figure 1C) and therefore should not confound identification of candidate miRNA targets ascertained through comparative RNA-Seq analysis of whole FL cells. We detected numerous differences in RNA and protein expression between WT and KO erythroblasts (Figure 2A; supplemental Tables 1 and 2). Changes in protein expression correlated with changes in mature mRNA transcripts. For example, the established miR-451 targets Cab39, Ywhaz, and Vapa4,7 were proportionately increased at mRNA and protein levels in KO erythroblasts (Figure 2A; supplemental Figure 1D; supplemental Table 1), in accord with the model that miRNAs repress target mRNAs largely by inducing their degradation, rather than by inhibiting translation.17
![Figure 2. miR-144/451 directly represses just over 100 erythroid genes in E14.5 FL erythroblasts. (A) Fold-change (KO/WT) in protein abundance quantified by tandem mass tag labeling followed by liquid chromatography coupled with tandem mass spectrometry analysis vs mRNA abundance quantified by RNA-Seq. Each point represents a single RNA and protein (average value, 3 biological replicates for RNA-Seq and 5 for quantitative proteomics). Ago family members and known miR-451 targets (Cab39, Ywhaz, Vapa) are indicated. (B) Fold change (KO/WT) in mature mRNA levels vs mRNA stability (KO/WT exon signal divided by KO/WT intron signal). Each point indicates a single mRNA (average, 3 biological replicates). The red oval includes 131 genes (black dots) with significantly increased mRNA abundance and mRNA stability (≥0.4-fold [log 2] increase, false discovery rate [FDR] < 0.1). Positive controls Cab39, Ywhaz and Vapa are indicated by colored symbols. (C) qRT-PCR validation for mRNAs predicted by RNA stability analysis (B) to have: (1) no change in RNA level (Ago2, Hbb2), or (2) increased transcription with upregulated primary and spliced transcripts (Muc6, Vwa5a), or (3) increased mRNA stability leading to increased spliced transcript abundance without change in primary transcripts (Vapa, Ywhaz). Bar graphs show mean plus or minus SEM for data from 6 biological replicates. *P < .05; **P < .01.](https://ash.silverchair-cdn.com/ash/content_public/journal/blood/133/23/10.1182_blood.2018854604/3/m_blood854604f2.png?Expires=1767714911&Signature=VbZsB1sQgf0BkeHumbvZl-7JNca0i1yB8PN08rAaOGf0FQgdYn6y3U0vIHxcGmowz19OFnCfX4oHxGdfPSAp3v89zSv~nfI0QfzT5Eu0ZANQR4YJv2tpHohiCn6RE~oqdm5z9Vt7H6wOQb46alLfp4CcNW30PbB43fSSEBzoHNHgzw3N-~Qfll7obOpQZF82JRDkbfIb4s7LPthtF-yndDtiO2kR69HBxcHNjCRTq~0a2hsODqxpK7je95SPj-p5IASwOg-7kW8Ld3FHRPZ0FcZ4cQYDL9xiPfrh73atNfrX1fvvARETWVZnkZa~LrOVl7PphcZAQBio4L9VKp8J9g__&Key-Pair-Id=APKAIE5G5CRDK6RD3PGA)
miR-144/451 directly represses just over 100 erythroid genes in E14.5 FL erythroblasts. (A) Fold-change (KO/WT) in protein abundance quantified by tandem mass tag labeling followed by liquid chromatography coupled with tandem mass spectrometry analysis vs mRNA abundance quantified by RNA-Seq. Each point represents a single RNA and protein (average value, 3 biological replicates for RNA-Seq and 5 for quantitative proteomics). Ago family members and known miR-451 targets (Cab39, Ywhaz, Vapa) are indicated. (B) Fold change (KO/WT) in mature mRNA levels vs mRNA stability (KO/WT exon signal divided by KO/WT intron signal). Each point indicates a single mRNA (average, 3 biological replicates). The red oval includes 131 genes (black dots) with significantly increased mRNA abundance and mRNA stability (≥0.4-fold [log 2] increase, false discovery rate [FDR] < 0.1). Positive controls Cab39, Ywhaz and Vapa are indicated by colored symbols. (C) qRT-PCR validation for mRNAs predicted by RNA stability analysis (B) to have: (1) no change in RNA level (Ago2, Hbb2), or (2) increased transcription with upregulated primary and spliced transcripts (Muc6, Vwa5a), or (3) increased mRNA stability leading to increased spliced transcript abundance without change in primary transcripts (Vapa, Ywhaz). Bar graphs show mean plus or minus SEM for data from 6 biological replicates. *P < .05; **P < .01.
miR-144/451 directly represses just over 100 erythroid genes in E14.5 FL erythroblasts. (A) Fold-change (KO/WT) in protein abundance quantified by tandem mass tag labeling followed by liquid chromatography coupled with tandem mass spectrometry analysis vs mRNA abundance quantified by RNA-Seq. Each point represents a single RNA and protein (average value, 3 biological replicates for RNA-Seq and 5 for quantitative proteomics). Ago family members and known miR-451 targets (Cab39, Ywhaz, Vapa) are indicated. (B) Fold change (KO/WT) in mature mRNA levels vs mRNA stability (KO/WT exon signal divided by KO/WT intron signal). Each point indicates a single mRNA (average, 3 biological replicates). The red oval includes 131 genes (black dots) with significantly increased mRNA abundance and mRNA stability (≥0.4-fold [log 2] increase, false discovery rate [FDR] < 0.1). Positive controls Cab39, Ywhaz and Vapa are indicated by colored symbols. (C) qRT-PCR validation for mRNAs predicted by RNA stability analysis (B) to have: (1) no change in RNA level (Ago2, Hbb2), or (2) increased transcription with upregulated primary and spliced transcripts (Muc6, Vwa5a), or (3) increased mRNA stability leading to increased spliced transcript abundance without change in primary transcripts (Vapa, Ywhaz). Bar graphs show mean plus or minus SEM for data from 6 biological replicates. *P < .05; **P < .01.
We wondered whether loss of miR-144/451 could alter RNAi regulation in erythroblasts by increasing the availability of Ago proteins for other miRNAs. Levels of the Ago proteins Ago1, Ago2, and Ago3 were reduced in KO erythroblasts without changes in their corresponding mRNAs (Figure 2A; supplemental Figure 1D), consistent with the report that mature miRNAs stabilize Ago proteins by inhibiting their proteasomal degradation.18 These findings, together with the miRNA-Seq data (Figure 1B), indicate that, in KO erythroblasts, total cellular Ago protein is reduced proportionally to the amount of miR-144/451 lost, without altering the levels of other Ago-bound miRNAs. Thus, total cellular miRNA levels regulate Ago protein levels.
Typically, miRNAs regulate bound mRNAs by enhancing their degradation. Therefore, loss of an miRNA will stabilize its targets, resulting in their accumulation. However, comparisons of mature mRNA levels by traditional RNA-Seq analysis cannot distinguish between direct mRNA stabilization and increased transcription from indirect effects. To resolve these possibilities, we used intronic signals in RNA-Seq data sets to approximate nascent transcripts. Increased transcription of a gene should raise intronic and exonic sequence reads proportionally, whereas stabilization of a mature mRNA will increase only exonic reads. We determined the KO/WT fold change separately for exon- and intron-mapping reads and calculated their ratio to infer RNA stability (Figure 2B y-axis). This analysis confirmed that the stability and levels of known miR-144/451 target mRNAs (Cab39, Ywhaz, Vapa) were increased in KO cells. We validated this approach further by using quantitative reverse transcription polymerase chain reaction (qRT-PCR) to measure the primary transcripts and mature mRNAs of representative genes predicted to be regulated by transcription rate or mRNA stability (Figure 2C). To confirm that we were not capturing spurious differences, we further quantified genes with reduced stability. Relative to WT erythroblasts, KO erythroblasts contain a disproportionate number of mRNAs with increased stability and abundance (n = 131) vs those with decreased stability and abundance (n = 19) (supplemental Figure 2A), consistent with the expectation that loss of miR-144/451 stabilizes target mRNAs. In contrast, analysis of steady-state (mature) mRNA levels, which are often used to predict miRNA targets, showed 310 upregulated and 363 downregulated transcripts (supplemental Figure 2B), most of which are likely altered by miR-144 or miR-451 indirectly. Quantitative proteomics identified corresponding proteins for 99 of the 131 stabilized mRNAs. Most of these 99 proteins were increased in KO erythroblasts relative to WT (supplemental Table 1). Thus, miR-144/451 regulates the stability of no more than 131 mRNAs in FL erythroblasts.
miR-144/451 recruits Ago to more than 1000 erythroid mRNAs
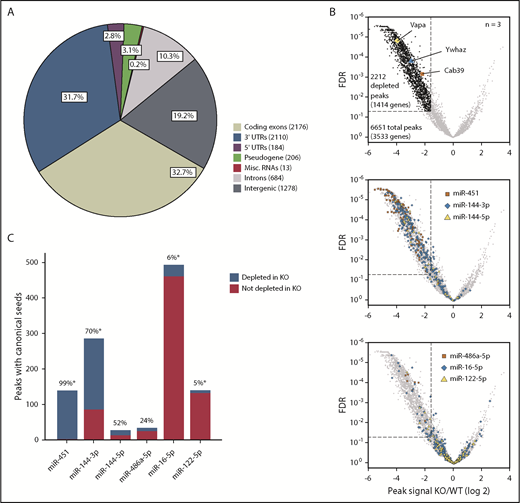
To perform Ago HITS-CLIP comparisons of WT and KO FL erythroblasts, we cross-linked RNAs to proteins with UV radiation, immunoprecipitated using anti-Ago antibody19 or control immunoglobulin G (IgG), and sequenced bound RNA fragments (supplemental Figures 3A-C and 4A). We designed a custom pipeline to map reads to the mouse genome and a novel software termed YODEL to call signal peaks.20 After filtering for mRNA abundance and IgG signal (supplemental Figure 4B-D), we established a high-confidence set of 6651 HITS-CLIP peaks (Figure 3A). This may underestimate the actual number of miRNA-bound sequences because our stringent filtering criteria were designed for optimal specificity. In contrast to our findings, some HITS-CLIP studies report Ago binding to tens of thousands of sites.12,21 Predicted Ago-binding sites (ie, “peaks”) on erythroblast mRNAs were distributed primarily in 3′ untranslated regions (UTRs; 31.7%) and coding exons (32.7%), as reported for other cell types.21 After normalization for mRNA length, Ago HITS-CLIP peaks were enriched in 3′ UTRs and depleted in 5′ UTRs relative to coding exons (supplemental Figure 4E).

miR-144/451 recruits Ago to thousands of erythroid mRNAs. (A) Genomic locations of 6651 Ago HITS-CLIP peaks for all miRNAs. (B) Fold change (x-axis) of Ago HITS-CLIP peak signals in miR-144/451 KO vs WT erythroblasts. The dotted line indicates more than threefold depletion in KO erythroblasts at FDR ≤ 0.05. The top volcano plot highlights KO-depleted HITS-CLIP peaks in black and 3 established miR-451 targets in color. The middle panel highlights peaks containing canonical seed matches to miR-144 or miR-451. The bottom panel highlights peaks containing canonical seed matches to 3 abundant miRNAs that are expressed normally in KO cells. (C) The number of peaks containing canonical seeds for the miRNAs depicted in panel B with the percentage depleted in KO erythroblasts indicated above each bar. *P < .0001 by the χ2 test. Misc., miscellaneous.
miR-144/451 recruits Ago to thousands of erythroid mRNAs. (A) Genomic locations of 6651 Ago HITS-CLIP peaks for all miRNAs. (B) Fold change (x-axis) of Ago HITS-CLIP peak signals in miR-144/451 KO vs WT erythroblasts. The dotted line indicates more than threefold depletion in KO erythroblasts at FDR ≤ 0.05. The top volcano plot highlights KO-depleted HITS-CLIP peaks in black and 3 established miR-451 targets in color. The middle panel highlights peaks containing canonical seed matches to miR-144 or miR-451. The bottom panel highlights peaks containing canonical seed matches to 3 abundant miRNAs that are expressed normally in KO cells. (C) The number of peaks containing canonical seeds for the miRNAs depicted in panel B with the percentage depleted in KO erythroblasts indicated above each bar. *P < .0001 by the χ2 test. Misc., miscellaneous.
To identify miR-144– and miR-451–bound mRNAs, we compared read counts mapping to all Ago HITS-CLIP peaks in WT and KO samples (Figure 3B). The differentially regulated peaks were distributed asymmetrically, with the majority being depleted in KO erythroblasts (Figure 3B, top panel). In total, 2212 peaks in 1414 genes were depleted in KO erythroblasts, whereas only 77 peaks in 50 genes were enriched in KO. The KO-depleted set included peaks at previously identified miR-451–binding sites on Cab39, Ywhaz, and Vapa mRNAs. To validate this analysis further, we compared peaks containing canonical seed-sequence matches for miRNAs miR-451, miR-144-3p, and miR-144-5p, which are absent in KO cells, to peaks with canonical seed matches for miR-486-5p, miR-16-5p, and miR-122-5p, which are expressed abundantly in WT and KO erythroblasts (Figure 1A-B). Peaks encompassing canonical seed matches for miR-451 and miR-144-3p were highly enriched in the KO-depleted fraction (Figure 3B middle panel; Figure 3C), whereas peaks for miR-16-5p and miR-122-5p were predominantly unchanged (Figure 3B bottom panel; Figure 3C). Thus, miR-144/451 KO selectively inhibits Ago binding to mRNAs with miR-144 or miR-451 seed sequences relative to mRNAs with seed sequences for other abundant erythroid miRNAs. This finding indicates that the differentially bound mRNAs reflect true miR-144/451 targets rather that nonspecific artifacts arising from reduced Ago abundance in the KO cells.
Of note, canonical seed matches to miR-144-5p and miR-486a-5p were present within a relatively small number of peaks (27 and 33, respectively) and exhibited no obvious skewing in WT vs KO cells (Figure 3B-C). These peaks may simply contain randomly detected miR-144-5p or miR-486a-5p seed matches and not represent true miRNA-binding sites. Overall, the HITS-CLIP results identified 2212 miR-144/451-Ago–binding sites on 1414 mRNAs.
Most mRNAs bound by miR-144/451-Ago are not repressed
Among all Ago-binding sites on erythroblast mRNAs identified by HITS-CLIP (n = 6651), approximately one-third were miR-144 or miR-451 dependent (n = 2212). However, as noted earlier, only 131 mRNAs were stabilized by loss of miR-144/451 in KO cells (Figure 2B). A prototypical miRNA-regulated target mRNA is predicted to bind Ago in an miRNA-dependent fashion and be stabilized after miRNA knockout. Fifty-three mRNAs meet this criterion for miR-144/451 and therefore represent high-confidence targets (Figure 4A; supplemental Table 1). Among these, only 5 were reported previously as miR144/451 targets: Cab39,22 Ywhaz,7 and Vapa4 (which we used as positive controls in our analyses), as well as Rab1423 and Rac1.24 The 78 mRNAs that were stabilized in KO cells but did not exhibit miR-144/451–dependent HITS-CLIP peaks may either be regulated indirectly, or, more likely, the HITS-CLIP methodology may not capture all Ago-miRNA–bound sites on target mRNAs (see “Discussion”). Regardless, our analysis shows that the number of mRNAs destabilized by miR-144 or miR-451, which is likely to include most directly regulated targets, is far smaller than the number of mRNAs bound by these miRNAs complexed to Ago.
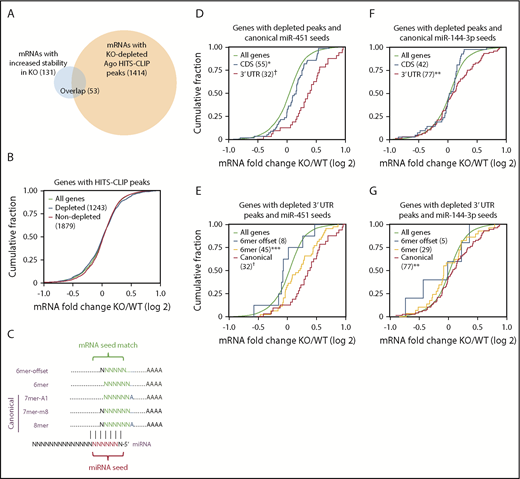
Most mRNAs bound by miR-144/451-Ago are not repressed. (A) Overlap between mRNAs with altered stability and/or Ago binding in KO erythroblasts. (B) Cumulative distribution function (CDF) plot showing fold change in mRNA abundance between KO and WT FL erythroblasts for 1243 mRNAs with KO-depleted HITS-CLIP peaks and 1879 mRNAs with nondepleted peaks. (C) Nucleotide complementarity patterns between miRNA seed sequences and their target mRNAs. (D) Effects of peak location in CDS vs 3′ UTR on mRNAs with KO-depleted peaks containing canonical miR-451 seed matches. (E) Effects of canonical vs 6-mer and 6-mer-offset miR-451 seed matches on KO-depleted peaks mapping to 3′ UTRs. (F) Effects of peak location (CDS vs 3′ UTR) on mRNAs with KO-depleted peaks containing canonical miR-144-3p seed matches. (G) Effects of canonical vs 6-mer and 6-mer-offset miR-144-3p seed matches on KO-depleted peaks mapping to 3′ UTRs. *P < .05, **P < .01, ***P < .001, †P < 10−6 by the Kolmogorov-Smirnov test. All other curves are not significantly different compared with all genes.
Most mRNAs bound by miR-144/451-Ago are not repressed. (A) Overlap between mRNAs with altered stability and/or Ago binding in KO erythroblasts. (B) Cumulative distribution function (CDF) plot showing fold change in mRNA abundance between KO and WT FL erythroblasts for 1243 mRNAs with KO-depleted HITS-CLIP peaks and 1879 mRNAs with nondepleted peaks. (C) Nucleotide complementarity patterns between miRNA seed sequences and their target mRNAs. (D) Effects of peak location in CDS vs 3′ UTR on mRNAs with KO-depleted peaks containing canonical miR-451 seed matches. (E) Effects of canonical vs 6-mer and 6-mer-offset miR-451 seed matches on KO-depleted peaks mapping to 3′ UTRs. (F) Effects of peak location (CDS vs 3′ UTR) on mRNAs with KO-depleted peaks containing canonical miR-144-3p seed matches. (G) Effects of canonical vs 6-mer and 6-mer-offset miR-144-3p seed matches on KO-depleted peaks mapping to 3′ UTRs. *P < .05, **P < .01, ***P < .001, †P < 10−6 by the Kolmogorov-Smirnov test. All other curves are not significantly different compared with all genes.
We examined whether certain features of the 2212 miR-144– or miR-451–binding sites identified by HITS-CLIP predicted stabilization of target mRNAs in KO erythroblasts. Overall, miR-144/451–bound mRNAs showed no difference in abundance compared with nonbound mRNAs in KO vs WT erythroblasts (Figure 4B). miR-451 binding to sites with canonical seed matches (Figure 4C) in the 3′ UTR showed a more significant correlation with mRNA stabilization compared with those with seed matches in protein coding sequences (CDSs) (Figure 4D). Among miR-451–binding sites in 3′ UTRs, those with canonical seed matches showed a more significant correlation with mRNA stability compared with ones with noncanonical seed matches (Figure 4E). Relatively few miR-451–bound mRNAs were associated with 6-mer-offset seed matches (Figure 4E); these were not stabilized in KO erythroblasts. Similarly, miR-144-3p binding to sites with canonical seed matches and/or those located in the 3′ UTR exhibited changes in mRNA levels (Figure 4F-G). Overall, our findings show that most mRNAs bound by Ago–miR-144 or Ago–miR-451 are not destabilized. Destabilization is favored by miR-144- or miR-451–Ago binding to the 3′ UTR via a canonical seed-sequence interaction.
miR-451 represses Cox10 to regulate erythroid mitochondrial respiration
We next investigated whether our studies could identify biologically relevant miR-144/451 targets. We filtered the list of stabilized mRNAs to identify those with miR-144/451–dependent HITS-CLIP peaks overlying canonical seed-sequence matches in 3′ UTRs. Of these, Slc35a3, Cox10, and Ogfod1 mRNAs were most highly stabilized in KO erythroblasts (supplemental Table 1; supplemental Figure 5A). Slc35a3 encodes a Golgi-resident transporter.25 Ogfod1 encodes a prolyl hydroxylase that regulates translation.26 Cox10 encodes an enzyme necessary for mitochondrial electron transport27,28 ; we chose this candidate for further study because progressive decline in mitochondrial activity along with a metabolic shift from oxidative phosphorylation to glycolysis is a signature feature of erythroid maturation.29,30
Cox10 mRNA showed Ago HITS-CLIP binding to a canonical miR-451 seed sequence in its 3′ UTR, similar to the known miR-451 target Cab39 (Figure 5A). qRT-PCR confirmed that spliced Cox10 and Cab39 mRNA transcripts were increased in KO cells without any changes in unspliced nascent transcripts (Figure 5B), consistent with mature mRNA stabilization. Western blot confirmed that Cox10 protein was increased in KO FL (Figure 5C) and in adult KO bone marrow (supplemental Figure 5B). Retroviral expression of miR-451, but not miR-144, decreased Cox10 mRNA in WT FL erythroid progenitors to subnormal levels, and reduced Cox10 mRNA in KO progenitors to WT levels (Figure 5D). In 293T cells, miR-451 suppressed the activity of a luciferase reporter fused to the Cox10 3′ UTR (Figure 5E). Thus, Cox10 mRNA is a direct target of miR-451.
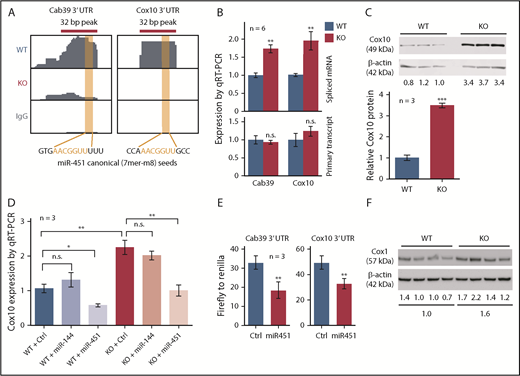
miR-451 represses Cox10 in FL erythroblasts. (A) Ago HITS-CLIP signals in the 3′ UTRs of Cab39 (a known miR-451 target) and Cox10 mRNAs in WT and miR-144/451 KO erythroblasts. The RNA sequences are shown with canonical seed matches in red. (B) Expression of Cab39 and Cox10 spliced mRNA and primary transcripts in WT and KO FL erythroblasts. (C) Western blot showing Cox10 protein expression in WT and KO FL erythroblasts (3 biological replicates). Bar graphs indicate relative expression normalized to β-actin. (D) Cox10 mRNA quantified by qRT-PCR in WT and KO FL erythroblasts following transduction with retroviral vectors expressing control, miR-144, or miR-451. (E) Firefly luciferase activity normalized to Renilla luciferase activity in 3′ UTR reporter assay. 293T cells were transfected with plasmid vectors encoding a Firefly luciferase reporter fused to the 3′ UTR of Cox10 or Cab39 mRNA along with constitutively active plasmid vectors encoding miR-451 or a control nontargeting microRNA and Renilla luciferase. Luciferase activity was measured at 48 hours. (F) Western blot showing Cox1 protein in WT and KO FL erythroblasts. Cox1 is a mitochondrial complex IV protein that is stabilized by Cox10. Numbers below indicate relative expression normalized to β-actin. Bar graphs show mean plus or minus SEM. *P < .05, **P < .01, ***P < .001.
miR-451 represses Cox10 in FL erythroblasts. (A) Ago HITS-CLIP signals in the 3′ UTRs of Cab39 (a known miR-451 target) and Cox10 mRNAs in WT and miR-144/451 KO erythroblasts. The RNA sequences are shown with canonical seed matches in red. (B) Expression of Cab39 and Cox10 spliced mRNA and primary transcripts in WT and KO FL erythroblasts. (C) Western blot showing Cox10 protein expression in WT and KO FL erythroblasts (3 biological replicates). Bar graphs indicate relative expression normalized to β-actin. (D) Cox10 mRNA quantified by qRT-PCR in WT and KO FL erythroblasts following transduction with retroviral vectors expressing control, miR-144, or miR-451. (E) Firefly luciferase activity normalized to Renilla luciferase activity in 3′ UTR reporter assay. 293T cells were transfected with plasmid vectors encoding a Firefly luciferase reporter fused to the 3′ UTR of Cox10 or Cab39 mRNA along with constitutively active plasmid vectors encoding miR-451 or a control nontargeting microRNA and Renilla luciferase. Luciferase activity was measured at 48 hours. (F) Western blot showing Cox1 protein in WT and KO FL erythroblasts. Cox1 is a mitochondrial complex IV protein that is stabilized by Cox10. Numbers below indicate relative expression normalized to β-actin. Bar graphs show mean plus or minus SEM. *P < .05, **P < .01, ***P < .001.
Cox10 encodes a farnesyltransferase that catalyzes the rate-limiting step in converting heme B to heme A, which contributes to the redox center of the mitochondrial electron transport complex cytochrome c oxidase (COX, also known as complex IV).27,28 Heme A facilitates complex IV assembly by stabilizing Cox1, a core subunit. Thus, stabilization of Cox10 mRNA by miR-451 deletion is predicted to increase Cox1 protein level, complex IV activity, and mitochondrial respiration. Cox1 protein was increased in KO erythroblasts (Figure 5F) and complex IV activity was elevated by 30% (Figure 6A). Moreover, mitochondrial membrane potential was increased by 25% in KO cells, as measured by accumulation of tetramethylrhodamine, methyl ester (TMRM), a lipophilic voltage-sensitive indicator dye (Figure 6B). We also compared mitochondrial function by measuring real-time oxygen consumption rate (OCR), a marker of oxidative phosphorylation. Both baseline and maximal OCRs were increased in KO erythroblasts (Figure 6C). However, WT and KO erythroblasts exhibited no difference in mitochondrial mass, as measured by uptake of MitoTracker (Figure 6D), mitochondrial DNA content (supplemental Figure 5C), levels of mitochondrial protein Tom20 (supplemental Figure 5D), and expression of multiple mitochondria-encoded RNAs (supplemental Figure 5E).
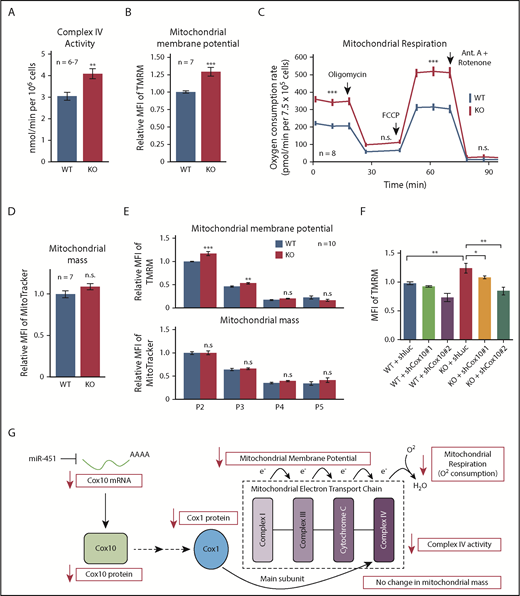
miR-451 represses mitochondrial respiration during erythropoiesis. (A) Mitochondrial complex IV activity in WT and KO FL erythroblasts. (B) Mitochondrial membrane potential in WT and KO FL erythroblasts measured by flow cytometry quantification of TMRM uptake. (C) Mitochondrial respiration in WT and KO FL erythroblasts measured by cellular OCR at baseline and after treatment with various inhibitors. The OCR prior to addition of oligomycin depicts basal respiration, after oligomycin depicts proton leak, and after carbonyl cyanide-4 (trifluoromethoxy) phenylhydrazone (FCCP) depicts maximal respiratory capacity. Antimycin (Ant.) A plus rotenone arrests all mitochondrial respiration. (D) Mitochondrial mass measured by flow cytometry quantification of MitoTracker uptake. (E) Flow cytometry analysis of mitochondrial membrane potential and mitochondrial mass in WT and KO FL erythroblasts at specific developmental stages. Bar graphs show mean fluorescent intensity (MFI) of mitochondrial dyes TMRM (membrane potential) and MitoTracker (mass). (F) Effect of Cox10 knockdown on mitochondrial membrane potential in WT and KO FL erythroblasts measured by flow cytometry quantitation of TMRM dye. Short hairpin RNA (shRNA) targeting Luciferase is used as a control. Bar graphs show mean plus or minus SEM for data from the indicated number (n) of biological replicates. *P < .05, **P < .01, ***P < .001. (G) Proposed mechanism through which miR-451 represses Cox10 mRNA to inhibit mitochondrial respiration.
miR-451 represses mitochondrial respiration during erythropoiesis. (A) Mitochondrial complex IV activity in WT and KO FL erythroblasts. (B) Mitochondrial membrane potential in WT and KO FL erythroblasts measured by flow cytometry quantification of TMRM uptake. (C) Mitochondrial respiration in WT and KO FL erythroblasts measured by cellular OCR at baseline and after treatment with various inhibitors. The OCR prior to addition of oligomycin depicts basal respiration, after oligomycin depicts proton leak, and after carbonyl cyanide-4 (trifluoromethoxy) phenylhydrazone (FCCP) depicts maximal respiratory capacity. Antimycin (Ant.) A plus rotenone arrests all mitochondrial respiration. (D) Mitochondrial mass measured by flow cytometry quantification of MitoTracker uptake. (E) Flow cytometry analysis of mitochondrial membrane potential and mitochondrial mass in WT and KO FL erythroblasts at specific developmental stages. Bar graphs show mean fluorescent intensity (MFI) of mitochondrial dyes TMRM (membrane potential) and MitoTracker (mass). (F) Effect of Cox10 knockdown on mitochondrial membrane potential in WT and KO FL erythroblasts measured by flow cytometry quantitation of TMRM dye. Short hairpin RNA (shRNA) targeting Luciferase is used as a control. Bar graphs show mean plus or minus SEM for data from the indicated number (n) of biological replicates. *P < .05, **P < .01, ***P < .001. (G) Proposed mechanism through which miR-451 represses Cox10 mRNA to inhibit mitochondrial respiration.
Mitochondrial mass declines gradually during terminal erythropoiesis,31 and miR-144/451 loss causes skewing of erythroblast-stage composition (Figure 1D). To ensure that the increased mitochondrial activity observed in unfractionated KO FLs does not simply reflect accumulation of immature erythroblasts, we compared stage-matched erythroblasts and found that stages P2 and P3 KO erythroblasts exhibited increased mitochondrial potential compared with WT, but no difference in mitochondrial mass (Figure 6E). To confirm that increased mitochondrial potential was a consequence of increased Cox10 levels, we knocked down Cox10 by RNAi (supplemental Figure 5F), and were able to rescue mitochondrial potential to WT levels (Figure 6F). Complex IV is not reported to produce reactive oxygen species (ROS),32 and, accordingly, we did not observe increased ROS accompanying the increase in mitochondrial potential in P2 and P3 KO erythroblasts (supplemental Figure 5G).
Together, our studies show that miR-451 binds mature Cox10 transcript through a canonical seed match in the 3′ UTR, causing mRNA destabilization, reduced Cox10 protein, decreased complex IV activity, and reduced oxidative phosphorylation and mitochondrial potential in erythroblasts (Figure 6G).
Discussion
To better define miR-144/451 targets and their biological effects during erythropoiesis, we performed miRNA-Seq, RNA-Seq, quantitative proteomics, and Ago HITS-CLIP in miR-144/451 WT and KO mouse E14.5 FLs. This strategy provided an ∼95% pure population of erythroid precursors in sufficient numbers to perform all studies on the same population. Analysis of primary cells averted potential artifacts arising from tissue culture or in vitro gene manipulation, which complicates many miRNA studies. Our findings provide general insights into mechanisms of RNAi and identify a new pathway by which miR-451 regulates erythroid maturation.
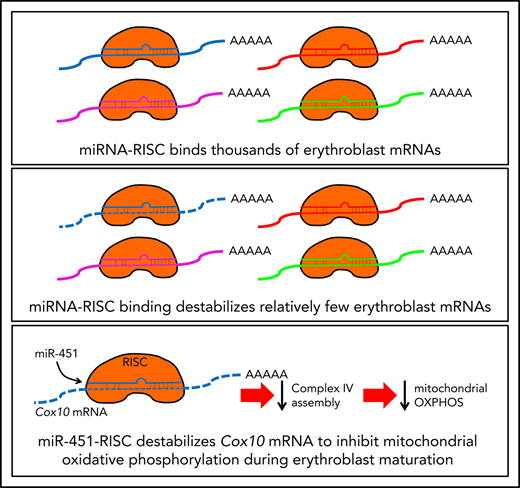
We used 2 approaches to analyze miR-144/451–bound and regulated mRNAs. First, we identified 131 mRNAs whose spliced transcripts are stabilized by loss of miR-144/451, with no increase in nascent transcript. Second, we used Ago HITS-CLIP to identify miRNA-mRNA interaction sites that were eliminated by loss of miR-144/451. This analysis identified binding of miR-144 or miR-451 to 2212 sites in 1414 mRNAs, which represents one-third of all Ago-binding sites on erythroblast mRNAs. Our stringent peak-calling strategy was optimized for specificity and detected fewer overall miRNA-binding sites than reported by similar studies in other tissues and cell lines.12,13 Even so, <10% of miR-144/451–bound mRNAs were actually repressed. Considering our findings that miR-144/451 probably directly represses no more than 131 erythroid mRNAs, and that one-third of all Ago-bound sites on mRNAs are miR-144/451–dependent, we extrapolate that miRNAs in erythroblasts and perhaps other cell types collectively regulate a few hundred mRNAs, rather than the many thousands predicted by other studies.12,13
Agarwal et al analyzed multiple CLIP studies in multiple tissues to show that miRNA-Ago binding to an mRNA does not necessarily alter its level in cells and that interactions with canonical seed sequences in 3′ UTRs are more likely to induce mRNA degradation.14 Our work confirms and extends this study by providing a quantitative assessment of functional miRNA-mRNA interactions in primary cells during a well-characterized developmental process. By examining mRNA stability and steady-state levels, we avoid confounding indirect effects from the latter, which account for most transcriptome changes that occur after genetic manipulation of miRNAs.
Several nonexclusive mechanisms can account for the discrepancy between miRNA binding measured by HITS-CLIP and target mRNA destabilization. Immunoprecipitation techniques may capture transient Ago-miRNA-mRNA interactions that are biologically inert. Accordingly, canonical interactions are strengthened by increased ribonucleotide pairing, and interactions in 3′ UTRs are less likely to be displaced by ribosomal read-through during translation.14 Additional determinants may modulate the capacity of miRNA-Ago complexes to repress bound mRNAs. For example, phosphorylation of human Ago weakens miRNA-Ago interactions with mRNAs and alters the global repertoire of repressed mRNAs.33 Our HITS-CLIP analysis likely captured both phosphorylated and nonphosphorylated Ago, which may have different activities. Cells may also contain pools of low-molecular-weight Ago-miRNA complexes that are devoid of additional RISC components required for target destabilization.34 It is possible that some of these inactive complexes bind mRNA and are detected by HITS-CLIP.
The primary goal of our study was to better understand the functions of the miR-144/451 miRNA locus during erythroid maturation through comprehensive identification of its target mRNAs. It is challenging to identify biologically relevant targets of miRNAs because most interactions detected by HITS-CLIP appear to be inert and most miRNA-induced changes in gene expression are indirect. By analyzing the effects of genetic miRNA ablation with RNA-Seq and quantitative proteomics, we identified 131 candidate erythroid target mRNAs that are stabilized by loss of miR-144/451, resulting in increased protein production for most of them. HITS-CLIP identified Ago–miR-144 or -451 binding to 53 (40%) of these stabilized mRNAs, identifying them as high-confidence miR targets.
Our analysis has several caveats. First, it is not clear whether the 78 KO-stabilized mRNAs with no detectable HITS-CLIP peaks represent direct miRNA targets. Some of these mRNAs may be stabilized indirectly. Alternatively, some bona fide Ago-mRNA interactions may not be captured by HITS-CLIP. We used stringent filters to maximize the specificity for signal detection, which likely reduced sensitivity. The Ago-mRNA interactions that are most destabilizing may escape detection because the bound mRNAs are rapidly eliminated. Other known technical limitations of CLIP-based techniques include site-specific differences in Ago-mRNA crosslinking efficiency due to interfering proteins or secondary RNA structure, and reduced HITS-CLIP signal for low abundance mRNAs. Second, we used RNA-Seq intronic reads as a surrogate for nascent transcription to determine RNA stability. Potential artifacts from alterative splicing or intron retention might be avoided by measuring mRNA turnover directly via a pulse-labeling technique. However, our current analysis identified known miR-451 targets and numerous novel targets that we validated through quantitative proteomics and HITS-CLIP. These validation studies indicate that the approach described here can be used to assess RNA stability accurately via analysis of preexisting RNA-Seq data, which may be useful for other investigators. Third, our studies compared unfractionated WT and KO FL cells, which exhibit different developmental profiles due to delayed maturation and increased apoptosis caused by loss of miR-144/451. The resultant differences in maturation stage–associated genes revealed by RNA-Seq were relatively minor, indicating that examination of whole FL did not impair the identification of most miRNA targets. However, it is possible that loss of specific populations of KO erythroblasts through apoptosis impaired the identification of some target mRNAs.
Despite these caveats, our integrated analyses identified numerous new high-probability miR-144/451 target mRNAs, one of which we studied in detail. Specifically, we showed that miR-451 recruits Ago-RISC to a canonical seed sequence in the 3′ UTR of endogenous Cox10 mRNA to induce its degradation, which inhibits the assembly of complex IV to reduce mitochondrial oxidative phosphorylation during erythroid maturation. Late-stage red blood cell precursors (reticulocytes) eliminate mitochondria through autophagy.35-37 However, progressive loss of mitochondrial oxidative phosphorylation begins earlier, as nucleated erythroblasts shift energy production from oxidative phosphorylation to glycolysis.29,30 We show that miR-451 contributes to this shift by repressing mitochondrial oxidative phosphorylation.28 The physiological consequences of Cox10 derepression leading to upregulation of mitochondrial activity observed in miR-144/451 KO mice are unknown. As reported here and elsewhere,6,7 KO FL erythroblasts exhibit delayed maturation and apoptosis, whereas adult KO mice have mild anemia at baseline that is exacerbated by oxidant stress, and inadequate erythropoietic response after acute hemolysis or progenitor depletion. Under some circumstances, increased mitochondrial activity resulting from Cox10 derepression could induce apoptosis via increased ROS production,38 although this is not seen in KO FL erythroblasts (see supplemental Figure 5G). Mitochondrial dysregulation can also alter metabolism, which impacts erythropoiesis through a variety of mechanisms including histone acetylation.30,39 Precise dissection of the miR-451–Cox10 regulatory axis during erythropoiesis will require further in vivo studies.
In summary, our work shows that in mouse erythroblasts, miRNAs bind thousands of mRNAs, but regulate only a few hundred. In conjunction with other published work,14 this indicates that the crucial roles of RNAi are exerted through a smaller fraction of the transcriptome than previously believed. In addition, we provide an integrated pathway to define direct miRNA targets in general, and identify new target genes and functions for miR-144/451. It will be informative to use the multimodal approach described here to compare the roles of miR-144/451 in adult erythroblasts under homeostatic and stress conditions, where miR-4517 and miRNAs in general frequently have prominent protective roles.7,40
The RNA-Seq, miRNA-Seq, and HITS-CLIP data reported in this article have been deposited in the Gene Expression Omnibus database (accession number GSE104455).
The online version of this article contains a data supplement.
The publication costs of this article were defrayed in part by page charge payment. Therefore, and solely to indicate this fact, this article is hereby marked “advertisement” in accordance with 18 USC section 1734.
Acknowledgments
This work was supported by American Lebanese Syrian Associated Charities and National Institutes of Health, National Institute of Diabetes and Digestive and Kidney Diseases grants T32 DK007780 (V.R.P.), K08 DK102533 (V.R.P.), and R01 DK092318 (M.J.W.). V.R.P. is a recipient of the ASH Scholar Award and the University of Pennsylvania Measey Fellowship Award.
Authorship
Contribution: V.R.P., M.J.W., and P.X. planned the experimental design; V.R.P., L.E.P., P.X., and M.J.W. wrote the manuscript with contributions from all authors; V.R.P. and J.L. optimized HITS-CLIP methodology with technical assistance and reagents from A.V. and Z.M.; V.R.P., G.Z., and Y.Y. performed HITS-CLIP and RNA sequencing; H.T. and J.P. performed quantitative proteomics; V.R.P. and L.E.P. developed bioinformatic pipelines; L.E.P. performed bioinformatic analyses with G.W. contributing; P.X, V.R.P., and M.J.W. planned studies related to Cox10 regulation; and P.X. performed studies, with contributions from C.L., under the guidance of J.D.S.
Conflict-of-interest disclosure: The authors declare no competing financial interests.
Correspondence: Mitchell J. Weiss, Department of Hematology, St. Jude Children’s Research Hospital, 262 Danny Thomas Pl, MS #355, Memphis, TN 38105; e-mail: mitch.weiss@stjude.org; or Vikram R. Paralkar, Division of Hematology-Oncology, Department of Medicine, Perelman School of Medicine, University of Pennsylvania, BRB II/III, Room 551, 421 Curie Blvd, Philadelphia, PA 19104; e-mail: vikram.paralkar@pennmedicine.upenn.edu.


![Figure 2. miR-144/451 directly represses just over 100 erythroid genes in E14.5 FL erythroblasts. (A) Fold-change (KO/WT) in protein abundance quantified by tandem mass tag labeling followed by liquid chromatography coupled with tandem mass spectrometry analysis vs mRNA abundance quantified by RNA-Seq. Each point represents a single RNA and protein (average value, 3 biological replicates for RNA-Seq and 5 for quantitative proteomics). Ago family members and known miR-451 targets (Cab39, Ywhaz, Vapa) are indicated. (B) Fold change (KO/WT) in mature mRNA levels vs mRNA stability (KO/WT exon signal divided by KO/WT intron signal). Each point indicates a single mRNA (average, 3 biological replicates). The red oval includes 131 genes (black dots) with significantly increased mRNA abundance and mRNA stability (≥0.4-fold [log 2] increase, false discovery rate [FDR] < 0.1). Positive controls Cab39, Ywhaz and Vapa are indicated by colored symbols. (C) qRT-PCR validation for mRNAs predicted by RNA stability analysis (B) to have: (1) no change in RNA level (Ago2, Hbb2), or (2) increased transcription with upregulated primary and spliced transcripts (Muc6, Vwa5a), or (3) increased mRNA stability leading to increased spliced transcript abundance without change in primary transcripts (Vapa, Ywhaz). Bar graphs show mean plus or minus SEM for data from 6 biological replicates. *P < .05; **P < .01.](https://ash.silverchair-cdn.com/ash/content_public/journal/blood/133/23/10.1182_blood.2018854604/3/m_blood854604f2.png?Expires=1767873613&Signature=mg6Q2KlRLwY1eLqgszs~5v~ge1MWVzftT4~kKxwVpWDN7isS9ZCPIXe2ZEjJ0Wi4jDKAlOsACOXcBM-chvvx5-7yYcpA~oWBw1~gWKIfHZnaqxDCIJZaIdZktRICEQ60KyvL1iT-y7xFzBEN7de03VW4cx8zrs064rQ16WP7ZhYDFgK81n93uX5RPbkoaNg2KaY6Zvu5bB8JiEIDmgLLhcwCmWnBHjM9Cd7J7VDuEq70AzPGvle5whK9jxkajwl9e8~pF5hmxaf14xlKSUchDSX4PDXPvwRq6s91ppIZUl8cyEYLOrR4UXp3x1OSX7HxC1UdGGIm7gTmC~JlSr24MQ__&Key-Pair-Id=APKAIE5G5CRDK6RD3PGA)