Key Points
Patients with AML acquire mutations in the transcription factor NFE2.
In mice, mutant NFE2 induces myeloproliferative neoplasms with subsequent transformation to AML and acquisition of AML-specific genetic alterations.

Abstract
In acute myeloid leukemia (AML), acquired genetic aberrations carry prognostic implications and guide therapeutic decisions. Clinical algorithms have been improved by the incorporation of novel aberrations. Here, we report the presence and functional characterization of mutations in the transcription factor NFE2 in patients with AML and in a patient with myelosarcoma. We previously described NFE2 mutations in patients with myeloproliferative neoplasms and demonstrated that expression of mutant NFE2 in mice causes a myeloproliferative phenotype. Now, we show that, during follow-up, 34% of these mice transform to leukemia presenting with or without concomitant myelosarcomas, or develop isolated myelosarcomas. These myelosarcomas and leukemias acquired AML-specific alterations, including the murine equivalent of trisomy 8, loss of the AML commonly deleted region on chromosome 5q, and mutations in the tumor suppressor Trp53. Our data show that mutations in NFE2 predispose to the acquisition of secondary changes promoting the development of myelosarcoma and/or AML.
Introduction
Acute myeloid leukemia (AML) is characterized by diverse molecular aberrations, which occur in various combinations and in different subclones within the same patient.1 Identification of those changes serves several purposes. First, specific chromosome aberrations or mutations in distinct genes carry prognostic relevance, and therefore guide therapeutic decisions.2 Second, mutations in signaling pathways are now amenable to targeted therapies.3 Third, molecular classification identifies subgroups of patients who profit from specific therapeutic regimens.4 Finally, it has been shown that the effect of individual aberrations is modulated by co-occurring changes.5 An accurate knowledge of all prognostically and therapeutically relevant mutations in an individual patient with AML is therefore paramount to informing therapeutic choices.5
Myelosarcoma (MyS) constitutes a unique clinical presentation of AML and can manifest concurrently, at presentation of AML, at relapse, or rarely, as isolated MyS. The latter is observed both de novo, constituting the initial AML presentation, or as an acceleration or transformation of an antecedent hematological disorder: myeloproliferative neoplasm (MPN), myelodysplastic syndrome (MDS), or chronic myeloid leukemia.6 The molecular etiology and pathophysiology of isolated MyS remains poorly understood. Although recent targeted sequencing studies have established that isolated MyS carries mutations identical to those found in AML without solid manifestation,7-9 the changes enabling a leukemic stem cell to home to a nonhematopoietic environment have not been elucidated. Lazarevic and colleagues recently reported mutations in the transcription factor NFE2 in 4 of 6 patients with isolated MyS as the initial AML presentation.9 Although these mutations occurred in the presence of other, known AML driver mutations, such as DNMT3A and NPM1, the alteration in NFE2 was the only additional change shared among the 2 index patients. In contrast, Lazarevic and colleagues did not find NFE2 mutations in 12 patients with AML with concomitant MyS. The authors, therefore, speculate that “mutated NFE2 could promote the development of myelosarcoma, through altered homing of the leukemic cells or providing a selective advantage to cells growing as a tumor mass,” but point out that this hypothesis “remains to be experimentally addressed.”9
Here, we report for the first time that a subset of patients with AML without MyS indeed carries mutations in NFE2. Moreover, in 2 different murine models, the introduction of mutant NFE2 either by bone marrow (BM) transplantation or by expression as a transgene from the endogenous locus led to the development of AML, AML with MyS, and in a substantial proportion of cases, isolated MyS as the sole presentation of AML. We have previously reported that in patients with MPN, in the context of a JAK2V617F mutation, acquisition of an NFE2 mutation confers a proliferative advantage over wt-NFE2.10 Our present data from a large AML cohort support the hypothesis that identical mutations in NFE2 independent of JAK2V617F promote the ability of a leukemic stem cell to home to nonhematopoietic tissues.
Methods and materials
Cohorts of patients with AML
BM or peripheral blood (PB) samples of 749 patients (18-65 years [n = 704] and >65 years [n = 45]) with a confirmed diagnosis of previously untreated AML or refractory anemia with excess of blasts with IPSS-R (revised international prognostic scoring system) higher than 4.5 were taken after informed consent. Patients were treated on Dutch-Belgian Hemato-Oncology Cooperative Group (HOVON) and Swiss Group for Clinical Cancer Research clinical protocols (http://www.hovon.nl). The treatment protocols and patient eligibility criteria have been previously described.11-13
Blasts and mononuclear cells at diagnosis were purified and cryopreserved. DNA was extracted and concentration measured by Qubit Fluorometric Quantitation (Thermo Fisher Scientific, Wilmington, DE).
Lentiviral transductions
CB3 cells were transduced with either empty pLeGO-iG or pLeGO-iC2 containing wt-NFE2 or NFE2 mutants, as previously described, and harvested 96 hours after the first infection.14
Construction of Δ297-300 NFE2 knock-in mice
Mice were kept under specific pathogen-free conditions at the center for clinical research mouse facility of the University Medical Center Freiburg. Breedings and experiments were performed in accordance with committee-approved animal protocols (by the Federal Ministry for Nature, Environment and Consumer Protection of the state Baden-Württemberg, Germany). The Δ297-300 NFE2 mutation was generated by polymerase chain reaction (PCR) mutagenesis. The targeting vector contained 2 negative selection markers flanking exon 2 and the mutated exon 3. A floxed PGK-neo-Poly A cassette was inserted between exon 2 and the mutated exon 3. Linearized DNA was injected into Sv129 ES cells by electroporation. Correctly recombined clones were selected for using neomycin and ganciclovir, and screened by Southern blotting. Positive clones were injected into blastocysts of C57/BL6 foster mothers. Offspring were backcrossed into the C57/BL6 mouse strain (details in supplemental Figure 1, available on the Blood Web site).
Diagnosis of mice according to the Bethesda Classification of Nonlymphoid Hematopoietic Neoplasms in Mice
The percentage of immature myeloid cells in BM and spleen was determined in at least 300 cells per mouse. PB smears were assessed for the presence of immature cells. Furthermore, hematoxylin and eosin–stained sections of liver, lung, and kidney were examined for neoplastic infiltrates. Complete blood counts at autopsy and during disease course were available. From these data, a diagnosis according to the Bethesda Proposals15 was made.
Data analysis
Paired or unpaired Student t-tests (2-sided or 1-sided) and the Mann-Whitney rank sum tests were used to determine whether a significant (P < .05) difference existed between 2 groups. When comparing more than 2 groups, a 1- or 2-way analysis of variance (ANOVA) was used. These analyses were performed using the SigmaPlot 11.0 (Systat, Erkrath, Germany) or the GraphPad Prism 6.0 software.
Additional materials and methods are given the supplemental Data.
Results
Because mutations in myeloid transcription factors are common in AML, and we have previously shown mutations in NFE2 in patients with MPN,9 we sequenced the NFE2 gene in a cohort of 749 HOVON patients with AML, presenting with de novo AML without antecedent MPN. NFE2 mutations were present in 24 AML cases, encompassing most FAB subtypes without any apparent clustering (3.2%; supplemental Table 1). Similar to patients with MPN, patients with AML also harbor indel mutations that cause frameshifts leading to truncated NFE2 proteins.10 In addition, both patients with AML and patients with MPN carry previously undescribed point mutations (Figure 1A-B). NFE2 mutations were exclusively heterozygous and occurred in the context of diverse additional mutations characteristic of AML (supplemental Table 1). In 7 of the 22 patients, the NFE2 mutant cells constituted a minor subclone (<5%; supplemental Table 1). The co-occurrence of NFE2 mutations with either WT1 or NRAS mutations was significantly more frequent than expected (P = .01 and P = .0005, respectively; supplemental Table 1). NFE2 mutations were seen both in cytogenetically normal AML and in patients with abnormal or complex karyotypes.
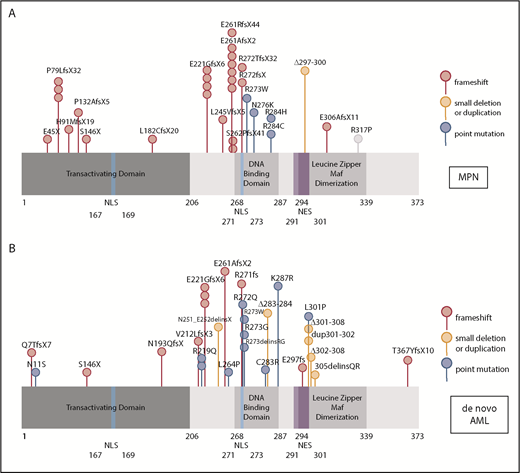
NFE2 mutations are present in MPN and patients with de novo AML. (A-B) Schematic representation of the NFE2 protein indicating mutations detected in (A) patients with MPN and (B) patients with de novo AML. (A-B) Patients with MPN reported in Jutzi et al10 and Lundberg et al,34 as well as in patients with MPN analyzed by B.C. and A. Vannuchi and P. Guglielmelli (personal communication). Patients with AML: 749 patients from HOVON trials, as well as 400 patients from AML-SG trials.11-13 Color code: red, insertion and deletion mutations causing a frameshift; orange, small in frame deletions; blue, point mutations. Details are given in supplemental Table 1. NES, nuclear export sequence; NLS, nuclear localization sequence.
NFE2 mutations are present in MPN and patients with de novo AML. (A-B) Schematic representation of the NFE2 protein indicating mutations detected in (A) patients with MPN and (B) patients with de novo AML. (A-B) Patients with MPN reported in Jutzi et al10 and Lundberg et al,34 as well as in patients with MPN analyzed by B.C. and A. Vannuchi and P. Guglielmelli (personal communication). Patients with AML: 749 patients from HOVON trials, as well as 400 patients from AML-SG trials.11-13 Color code: red, insertion and deletion mutations causing a frameshift; orange, small in frame deletions; blue, point mutations. Details are given in supplemental Table 1. NES, nuclear export sequence; NLS, nuclear localization sequence.
We examined the overall and event-free survival of 20 patients carrying NFE2 mutations compared with 532 patients with wt-NFE2 AML, using data compiled from AML cohorts (<65 years) enrolled in the following studies: HOVON 42(A), HO92, and HO102. NFE2-mutated patients showed better event-free survival and overall survival (supplemental Figure 2A-B). However, because of the relatively small number of patients, the confidence interval remains large and the clinical significance is therefore uncertain.
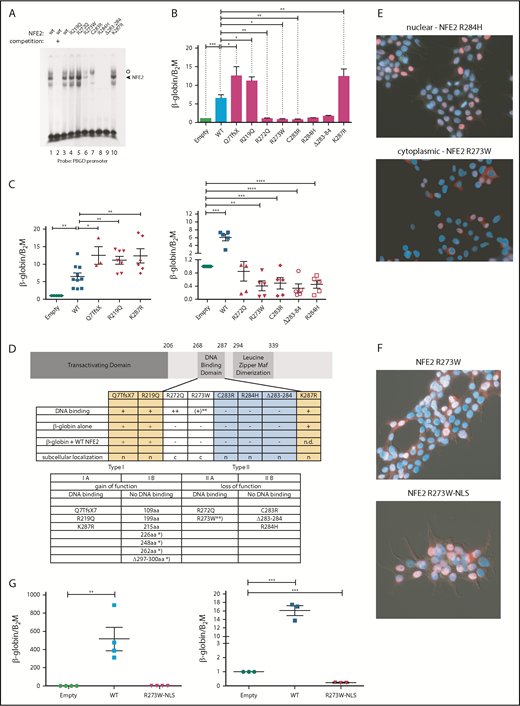
We determined the functional consequences of several previously not described point mutations. By in vitro DNA-binding assays, the mutants fall into 2 classes (Figure 2A). Although mutations in amino acid 219, located outside the DNA-binding domain, and amino acids 272 and 287, within the N- and C-terminal boundary of the DNA-binding domain, did not affect DNA binding, all mutations altering amino acids 273 to 284 abrogated DNA-binding ability, with residual binding observed in the R273W mutant (Figure 2A).

Mutations in NFE2 alter transactivating activity and subcellular localization. (A) Electrophoretic mobility shift assay (EMSA) of wt-NFE2 and NFE2 mutants. Nuclear extracts of HEK-293 cells transfected with expression vectors encoding either wt-NFE2 (lanes 1-3), or the indicated mutants (lanes 4-10), together with MafG, were incubated with a 32P-labeled oligonucleotide containing a NFE2 binding site, as previously described.10 In lane 2, a 100× excess of a nonradioactive oligonucleotide, encoding the consensus NFE2 binding site, was added. Open circle: unspecific band; triangle: NFE2 band. (B) CB3 cells, which lack endogenous NFE2, were transduced with wt-NFE2 or various NFE2 mutants, as indicated, and assayed for β-globin and β-2-microglobulin housekeeping gene expression by quantitative reverse transcription (qRT)-PCR, as previously described.9 Results represent the mean ± SEM of at least 4 independent experiments and are reported as relative expression levels setting β-globin expression in empty transfected CB3 cells at 1. Data were analyzed for statistical significance by 1-way ANOVA with Bonferroni’s post hoc multiple comparison test. *P < .05; **P < .01; ***P < .001. (C) CB3 cells were transduced with pLeGO-iC2-NFE2 as well as with either an empty pLeGO-iG vector, or with pLeGO-iG vectors encoding either wt-NFE2 or the NFE2 mutants indicated. Cells were assayed for β-globin and β-2-microglobulin housekeeping gene expression by qRT-PCR, as in panel B. Results represent the mean ± SEM of at least 4 independent experiments and are reported as relative expression levels setting β-globin expression in pLeGO-iC2-NFE2/empty pLeGO-iG-transduced CB3 cells at 1. Data were analyzed for statistical significance by 1-way ANOVA with Bonferroni’s post hoc multiple comparison test. *P < .05; **P < .01; ***P < .001; **** P < .0001. (D, top) Schematic representing the NFE2 protein indicating functional domains. (Bottom) A table summarizing the data from panels A-C and E. c, cytoplasmic; n, nuclear; n.d., not determined; *Published NFE2 mutants.10 **The R273W mutant weakly binds DNA in an EMSA (Type IIa-like), but not in a ChIP assay (type IIb-like). Protein nomenclature, see supplemental Table 2. (E-F) Subcellular localization. 293T cells were transduced with pLeGO-iG expressing the NFE2 mutants indicated: Cells were fixed, permeabilized, and stained with an antibody against NFE2, detected by a secondary antibody coupled to AF647 (red stain), counterstained with 4′,6-diamidino-2-phenylindole (DAPI, blue) and assessed by immunofluorescence microscopy. (G, left) CB3 cells were transduced with an empty vector, wt-NFE2 or the R237W-NLS mutant indicated and assayed by qRT-PCR as cells in panel B). n = 4 per construct. (Right) CB3 cells were transduced with pLeGO-iC2-NFE2, as well as with either an empty pLeGO-iG vector or with pLeGO-iG vectors encoding either wt-NFE2 or the R273W-NLS mutant. Cells were assayed by qRT-PCR as in panel B. n = 3 per construct. WT, wild-type.
Mutations in NFE2 alter transactivating activity and subcellular localization. (A) Electrophoretic mobility shift assay (EMSA) of wt-NFE2 and NFE2 mutants. Nuclear extracts of HEK-293 cells transfected with expression vectors encoding either wt-NFE2 (lanes 1-3), or the indicated mutants (lanes 4-10), together with MafG, were incubated with a 32P-labeled oligonucleotide containing a NFE2 binding site, as previously described.10 In lane 2, a 100× excess of a nonradioactive oligonucleotide, encoding the consensus NFE2 binding site, was added. Open circle: unspecific band; triangle: NFE2 band. (B) CB3 cells, which lack endogenous NFE2, were transduced with wt-NFE2 or various NFE2 mutants, as indicated, and assayed for β-globin and β-2-microglobulin housekeeping gene expression by quantitative reverse transcription (qRT)-PCR, as previously described.9 Results represent the mean ± SEM of at least 4 independent experiments and are reported as relative expression levels setting β-globin expression in empty transfected CB3 cells at 1. Data were analyzed for statistical significance by 1-way ANOVA with Bonferroni’s post hoc multiple comparison test. *P < .05; **P < .01; ***P < .001. (C) CB3 cells were transduced with pLeGO-iC2-NFE2 as well as with either an empty pLeGO-iG vector, or with pLeGO-iG vectors encoding either wt-NFE2 or the NFE2 mutants indicated. Cells were assayed for β-globin and β-2-microglobulin housekeeping gene expression by qRT-PCR, as in panel B. Results represent the mean ± SEM of at least 4 independent experiments and are reported as relative expression levels setting β-globin expression in pLeGO-iC2-NFE2/empty pLeGO-iG-transduced CB3 cells at 1. Data were analyzed for statistical significance by 1-way ANOVA with Bonferroni’s post hoc multiple comparison test. *P < .05; **P < .01; ***P < .001; **** P < .0001. (D, top) Schematic representing the NFE2 protein indicating functional domains. (Bottom) A table summarizing the data from panels A-C and E. c, cytoplasmic; n, nuclear; n.d., not determined; *Published NFE2 mutants.10 **The R273W mutant weakly binds DNA in an EMSA (Type IIa-like), but not in a ChIP assay (type IIb-like). Protein nomenclature, see supplemental Table 2. (E-F) Subcellular localization. 293T cells were transduced with pLeGO-iG expressing the NFE2 mutants indicated: Cells were fixed, permeabilized, and stained with an antibody against NFE2, detected by a secondary antibody coupled to AF647 (red stain), counterstained with 4′,6-diamidino-2-phenylindole (DAPI, blue) and assessed by immunofluorescence microscopy. (G, left) CB3 cells were transduced with an empty vector, wt-NFE2 or the R237W-NLS mutant indicated and assayed by qRT-PCR as cells in panel B). n = 4 per construct. (Right) CB3 cells were transduced with pLeGO-iC2-NFE2, as well as with either an empty pLeGO-iG vector or with pLeGO-iG vectors encoding either wt-NFE2 or the R273W-NLS mutant. Cells were assayed by qRT-PCR as in panel B. n = 3 per construct. WT, wild-type.
Subsequently, we determined whether NFE2 mutants retain the ability to activate transcription of the β-globin locus, an NFE2 target. CB3 cells, which no longer express endogenous NFE2 because of a viral integration event, were used.16 These cells remain primed for β-globin expression, which is induced 5- to 10-fold after reconstitution of wt-NFE2 (Li et al17 ; Figure 2B). All mutants were expressed at a level similar to wt-NFE2 (supplemental Figure 3A), and 3 of the AML NFE2 mutants tested activated β-globin expression in CB3 cells. The Q7TfsX mutant contains a frameshift mutation at the N terminus, destroying the open reading frame of the full-length 372-amino acid NFE2 protein (supplemental Figure 3B). However, the NFE2 protein is translated starting at 2 different, in-frame ATGs.18 The shorter open reading frame, intact in the Q7TfsX mutant, lacks only the initial 24 amino acids of the transactivating domain, leading to a 350-amino acid isoform (supplemental Figure 3B).18 The Q7TfsX mutant, the R219Q, and the K287R mutation show significantly more transactivation activity than wt-NFE2 (Figure 2B). The 4 mutants altered between amino acids 273 to 284, which lose DNA-binding ability, no longer activate β-globin transcription. However, the R272Q mutation, which binds DNA in vitro, also lacks all transactivating potential in vivo (Figure 2B).
As all NFE2 mutations occur as heterozygotes, they retain a wt-NFE2 allele. Therefore, we investigated the activity of AML NFE2 mutations in the presence of wt-NFE2. We have previously reported that the indel mutations causing C-terminal truncations in patients with MPN, although no longer able to bind DNA or transactivate transcription on their own, significantly augment wt-NFE2 activity.10 CB3 cells were infected simultaneously with 2 lentiviral constructs: 1 expressing wt-NFE2 and in addition, a virus encoding either an empty control, wt-NFE2, or 1 of the AML NFE2 mutants. Populations expressing similar levels of wt-NFE2 and an equal amount of additional wt- or mutant-NFE2 (assessed by mCherry and green fluorescent protein [GFP] expression, as well as western blotting; supplemental Figure 3C-D) were assessed for β-globin expression by qRT-PCR.
β-globin mRNA levels in cells expressing wt-NFE2 and the empty vector were set at 1 (“empty”; Figure 2C). Transduction of equal levels of wt-NFE2, doubling the amount of wt-NFE2, led to a 5- to 10-fold increase in β-globin mRNA expression (“WT” in Figure 2C). The 3 mutants, Q7TfsX, R219Q, and K287R, displaying augmented activity on their own, again demonstrate significantly enhanced activity compared with wt-NFE2 (Figure 2C, left panel). The remaining AML NFE2 mutants, which have lost transactivating potential, displayed a dominant-negative phenotype, decreasing β-globin transcription below the level seen with the empty vector control (Figure 2C, right panel). This inhibitory effect on wt-NFE2 is in contrast to the effect caused by the C-terminal deletion mutants found in patients with MPN and in around 50% of the patients with AML (Figure 1A).10 In effect, NFE2 mutations fall into 2 categories: type I mutations, enhancing NFE2 activity, and type II mutations, acting as dominant-negatives (Figure 2D). Both categories can be further subdivided according to their ability to bind DNA: type Ib mutations constitute the initially discovered truncation mutations that no longer bind DNA, but augment wt-NFE2 function,10 whereas type Ia mutations bind DNA and show enhanced transcriptional activation (Figure 2A-B). Type II mutations, likewise, can either lose the ability to bind DNA (type IIb, mutations occurring between amino acids 273 and 284; Figure 2A) or not (type IIa, R272Q and partially R273W; Figure 2A).
These data invite the question of why the R272Q and R273W mutants, which retain full or partial DNA binding and an unaltered transcriptional activation domain, act as dominant-negative proteins. We hypothesized that mutations of these 2 residues might alter subcellular localization of the transcription factor, as the nuclear localization sequence of NFE2 lies between amino acids 271 and 273.19 We therefore transduced 293T cells with the 8 AML NFE2 mutations and stained fixed cells with both an antibody against NFE2 and with 4′,6-diamidino-2-phenylindole (DAPI). Although 6 of the mutants showed a nuclear localization similar to wt-NFE2, mutants R272Q and R273W were located in the cytoplasm (Figure 2E; supplemental Figure 4). Addition of a consensus nuclear localization sequence to the C terminus of the R273W mutant restored its nuclear localization (Figure 2F). However, relocation to the nucleus did not restore transactivating potential (Figure 2G, left); rather, the dominant-negative effect on wt-NFE2 was retained by nuclear R273W (Figure 2G, right), suggesting that this mutant acts similarly to the other type II dominant-negative mutants.
A more accurate assessment of in vivo DNA binding is obtained by chromatin immunoprecipitation (ChIP) assays. We therefore used CB3 cells infected either with an empty virus or with viruses expressing wt-NFE2, the R273W, the K287R, or the NFE2 Δ297-300 mutant10 and performed a genomewide ChIP sequencing (ChIPseq). We observed restoration of NFE2 binding at 2835 and 1232 loci by introduction of wt-NFE2 or K287R, respectively. With very few exceptions, all sites bound by wt-NFE2 are also bound by the K287R mutant. Motif enrichment analysis shows that the mutant retains wt-NFE2 binding specificity (supplemental Figure 5A). The higher number of peaks in the wt-NFE2 ChIP reflects differences in IP strength; that is, a higher signal-to-noise-ratio resulting in a higher Fraction of Reads in Peaks score in wt-NFE2 compared with the K287R mutant. We do not interpret these results to show either altered DNA recognition or a lowered DNA-binding affinity of the K287R mutant. In contrast, neither the R273W nor the NFE2 Δ297-300 mutant bound DNA in vivo (supplemental Figure 5B-C), showing that both gain of function (type I) and loss of function/dominant-negative (type II) mutations exert their effects independent of DNA binding.
We wished to determine the effect of the dominant-negative point mutants on cell proliferation. Therefore, we infected BaF/3 cells either with an empty control virus or with viruses expressing wt-NFE2, or the NFE2 mutants R273W or Δ283-284. Cells were subsequently cultured in the presence or absence of interleukin 3 (IL-3). As we have previously shown for NFE2 truncation mutants,10 expression of altered NFE2 does not confer cytokine-independent growth on BaF/3 cells (Figure 3A). However, in the presence of IL-3, cells expressing the NFE2 mutants R273W or Δ283-284 showed significantly enhanced proliferation (Figure 3A) over cells expressing wt-NFE2.
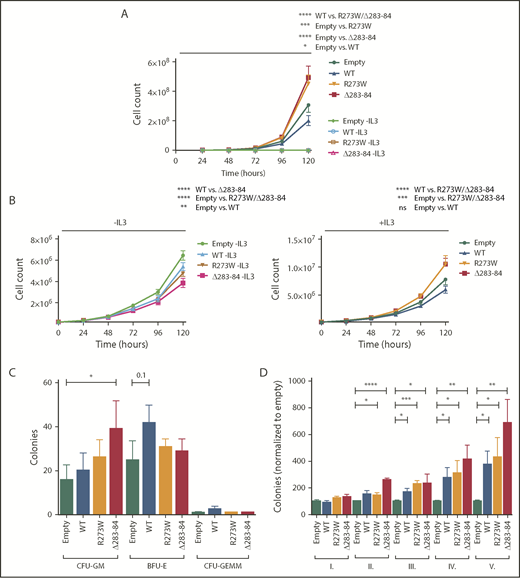
Dominant-negative NFE2 mutations confer an advantage in cytokine-dependent proliferation and show increased repopulation capacity ex vivo. (A) Ba/F3 cells were transduced with pLeGO-iG constructs, as indicated, and FACS sorted for GFP. Cells were grown in the absence or presence of IL-3. (B) Ba/F3 cells transduced and sorted for GFP-positive Jak2V617F (iG) cells were transduced with pLeGO-iC2 constructs, as indicated, and FACS sorted for mCherry. (A-B) Experiments were performed using 2 independent infections and sorts per construct, followed by n = 3 assays carried out in duplicates each. (C) 5-FU treated C57/B6 BM was transduced with pLeGO-iG constructs, as indicated, followed by FACS sorting for GFP-positive cells into methylcellulose. Colonies were stained with benzidine before counting. (D) C57/B6 BM was transduced with pLeGO-iG constructs, as indicated, followed by FACS sorting for GFP-positive cells into methylcellulose. Colonies were counted every 7 to 9 days, followed by replating of 20 000 cells. n = 3-4 in duplicates each. Data were analyzed for statistical significance by 1-way ANOVA with Bonferroni’s post hoc multiple comparison test. *P < .05; **P < .01; ***P < .001; **** P < .0001. WT, wild-type.
Dominant-negative NFE2 mutations confer an advantage in cytokine-dependent proliferation and show increased repopulation capacity ex vivo. (A) Ba/F3 cells were transduced with pLeGO-iG constructs, as indicated, and FACS sorted for GFP. Cells were grown in the absence or presence of IL-3. (B) Ba/F3 cells transduced and sorted for GFP-positive Jak2V617F (iG) cells were transduced with pLeGO-iC2 constructs, as indicated, and FACS sorted for mCherry. (A-B) Experiments were performed using 2 independent infections and sorts per construct, followed by n = 3 assays carried out in duplicates each. (C) 5-FU treated C57/B6 BM was transduced with pLeGO-iG constructs, as indicated, followed by FACS sorting for GFP-positive cells into methylcellulose. Colonies were stained with benzidine before counting. (D) C57/B6 BM was transduced with pLeGO-iG constructs, as indicated, followed by FACS sorting for GFP-positive cells into methylcellulose. Colonies were counted every 7 to 9 days, followed by replating of 20 000 cells. n = 3-4 in duplicates each. Data were analyzed for statistical significance by 1-way ANOVA with Bonferroni’s post hoc multiple comparison test. *P < .05; **P < .01; ***P < .001; **** P < .0001. WT, wild-type.
Next, we examined whether NFE2 point mutants also affect proliferation in the presence of JAK2V617F. Contrary to truncation mutants, which enhance JAK2V617F-driven proliferation only in the absence, but not in the presence, of IL-3,10 NFE2 point mutants slightly attenuate growth in the absence of cytokine, but significantly enhance proliferation of JAK2V671F-expressing BaF/3 cells in the presence of IL-3 (Figure 3B). These data show that the 2 classes of NFE2 mutations enhance proliferation under different conditions. It is worth noting that the point mutants were identified in de novo patients with AML who do not carry a JAK2V671F mutation; hence, they are likely to enhance proliferation in this cellular context.
Finally, we determined the effect of NFE2 point mutants on colony formation in primary murine bone marrow and on the ability of bone marrow cells to retain colony formation potential in serial replating assays, which reflects their self-renewal ability. Although overall colony formation was only discretely enhanced by expression of the NFE2 R273W and Δ283-284 mutants (Figure 3C), both mutants significantly increased the serial replating ability even beyond the effect conferred by overexpression of wt-NFE2 that we have previously shown20 (Figure 3D). These data show that point mutations in NFE2 increase the self-renewal capacity of murine bone marrow progenitor cells, providing an explanation for the leukemogenicity of these mutations.
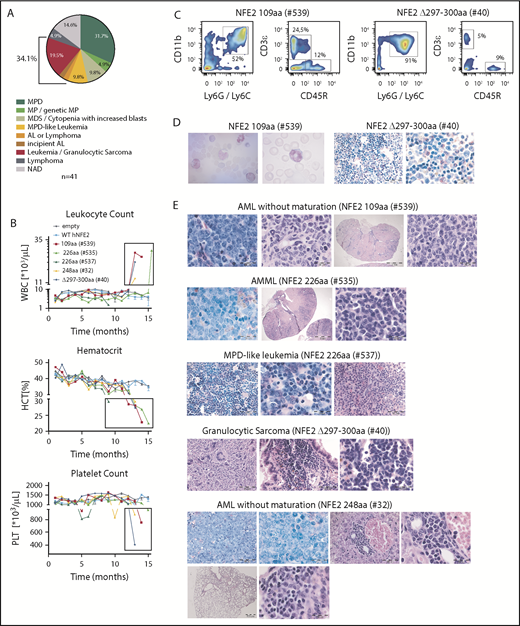
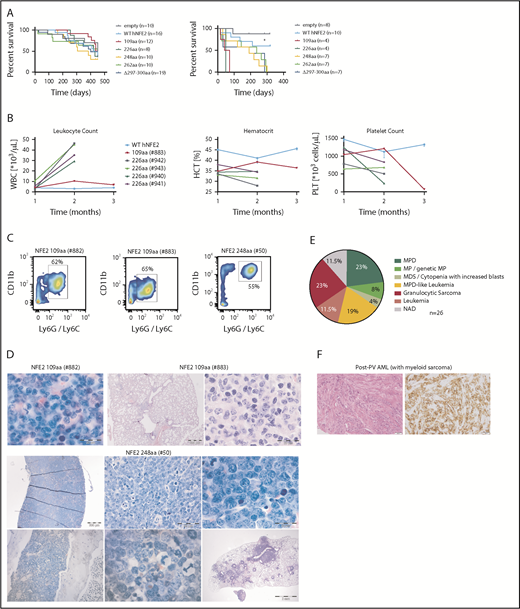
We have previously reported that the NFE2 mutations found in patients with MPN cause a myeloproliferative phenotype when introduced into murine BM.10 We therefore investigated the effect of AML NFE2 mutations in murine models. In addition, we followed mice expressing mutants found in patients with MPN for longer than the 6 months reported previously.10 BM of FVB CD45.2 donor animals was transduced with lentiviruses expressing different NFE2 mutants and transplanted into lethally irradiated FVB CD45.1 recipients. Complete blood counts were taken every 4 weeks, and moribund mice were sacrificed and autopsied. Paraffin-embedded organs were analyzed histologically. Diagnoses were assigned according to the Bethesda classification of nonlymphoid malignancies in mice.15 The 41 mice analyzed (which carry 5 distinct mutations: 109 amino acids, n = 7; 226 amino acids, n = 7; 248 amino acids, n = 6; 262 amino acids, n = 9; Δ297-300 amino acids, n = 12; for mutant nomenclature see supplemental Table 2) initially showed the MPN phenotype we have previously described.10 With a longer follow-up (up to 19 months), however, 14 mice (34%) developed 1 of various subtypes of murine leukemia (Figure 4A), manifested by leukocytosis, anemia, and thrombocytopenia (examples shown in Figure 4B). The elevated leukocytes consist predominantly of myeloid (CD11b+ and Ly6G/Ly6C+) cells (Figure 4C), and immature myeloid cells are found in peripheral blood smears (Figure 4D, left panels). Histological analyses classified these disorders into the different entities defined by Kogan and colleagues (Figure 4D, right panels and Figure 4E).15 Of note, 2 mice, 1 carrying the 226-amino acid and 1 the Δ297-300-amino acids mutation, developed myelosarcoma, termed granulocytic sarcoma in mice,15 a solid manifestation of AML.

Expression of mutant NFE2 causes AML with concomitant granulocytic sarcoma as well as isolated granulocytic sarcoma in mice. (A) Diagnoses according to the Bethesda Classification of Nonlymphoid Hematological Malignancies10 in n = 41 mice expressing various NFE2 mutations9 (B-E) Protein nomenclature of indicated NFE2 mutants, s. supplemental Table 2. (B) Hematological parameters of selected mice that developed leukemia. WBC: white blood cells; HCT, hematocrit; PLT, platelets. Blood counts indicating leukocytosis, anemia, and thrombocytopenia, the clinical hallmarks of leukemia, are highlighted in the black boxes. (C) FACS analysis of PB leukocytes of mouse #539 and #40. Cells were stained with CD11b and Ly6G/C or CD3ε and CD45R to determine myeloid and lymphoid cells, respectively. (D) From left to right: PB smear of mouse #539 (1000×) and chloracetate esterase (CAE) stained femur section of mouse #40 (400× and 1000×). (E) Histological analysis, hematoxylin and eosin–stained sections of the following organs of leukemic mice: #539 (from left to right): femur (1000×), liver (1000×), kidney (10× and 1000×). #535 (from left to right): femur (1000×), kidney (10× and 1000×). #537 (from left to right): femur (400× and 1000×), lung (400×). #40 (from left to right): sarcoma (400×), lung (400× and 1000×). #32 (from left to right): top: femur (400× and 1000×), liver (400× and 1000×); bottom: lung (25× and 1000×). Bars: 200 μm (10×), 500 μm (25×), 50 μm (400×), 20 μm (1000×).
Expression of mutant NFE2 causes AML with concomitant granulocytic sarcoma as well as isolated granulocytic sarcoma in mice. (A) Diagnoses according to the Bethesda Classification of Nonlymphoid Hematological Malignancies10 in n = 41 mice expressing various NFE2 mutations9 (B-E) Protein nomenclature of indicated NFE2 mutants, s. supplemental Table 2. (B) Hematological parameters of selected mice that developed leukemia. WBC: white blood cells; HCT, hematocrit; PLT, platelets. Blood counts indicating leukocytosis, anemia, and thrombocytopenia, the clinical hallmarks of leukemia, are highlighted in the black boxes. (C) FACS analysis of PB leukocytes of mouse #539 and #40. Cells were stained with CD11b and Ly6G/C or CD3ε and CD45R to determine myeloid and lymphoid cells, respectively. (D) From left to right: PB smear of mouse #539 (1000×) and chloracetate esterase (CAE) stained femur section of mouse #40 (400× and 1000×). (E) Histological analysis, hematoxylin and eosin–stained sections of the following organs of leukemic mice: #539 (from left to right): femur (1000×), liver (1000×), kidney (10× and 1000×). #535 (from left to right): femur (1000×), kidney (10× and 1000×). #537 (from left to right): femur (400× and 1000×), lung (400×). #40 (from left to right): sarcoma (400×), lung (400× and 1000×). #32 (from left to right): top: femur (400× and 1000×), liver (400× and 1000×); bottom: lung (25× and 1000×). Bars: 200 μm (10×), 500 μm (25×), 50 μm (400×), 20 μm (1000×).
The leukemias were transplantable to secondary recipients, in whom disease development was accelerated (Figure 5A). In several animals, leukocytosis, anemia, and thrombocytopenia developed within 2 to 3 months (Figure 5B). Fluorescence-activated cell sorter (FACS) analysis again demonstrated the presence of myeloid markers on the leukemic cells (Figure 5C), and histology showed an excess of myeloid blasts in the BM and, in mouse #883, in lung infiltrates (Figure 5D). As patients with AML carrying NFE2 mutations simultaneously carry WT1 mutations more frequently than expected (supplemental Table 1), we overexpressed WT1 in murine BM expressing the NFE2 Δ297-300 mutation or in wt control cells. Transduced BM was transplanted into lethally irradiated mice. We chose this model as WT1 is frequently overexpressed in AML. However, as our 4 patients carry inactivating WT1 mutations, this situation is not reflected in our mice. Therefore, the fact that we did not observe acceleration of leukemic transformation in this model does not preclude synergism between mutant NFE2 and loss of WT1 function (supplemental Figure 6).
Transplantation of mutant NFE2 BM accelerates leukemic transformation – isolated myelosarcoma with mutated NFE2 in a PV patient. (A) Kaplan-Meier survival analysis of mice expressing various NFE2 mutations, wt-NFE2, or an empty control vector, as indicated. (Left) Primary recipients. (Right) secondary recipients transplanted with BM from primary recipients before the outbreak of acute leukemia. **P < .01 each of the mutations vs wt. (B) Hematological parameters of selected mice that developed leukemia. HCT, hematocrit; PLT, platelets; WBC, white blood cells. Blood counts indicating leukocytosis, anemia, and thrombocytopenia, the clinical hallmarks of leukemia, are highlighted in the black boxes. (C) FACS analysis of PB leukocytes of mice #882, #883, and #50. Cells were stained with CD11b and Ly6G/C to determine myeloid cells. (D) Histological analysis, CAE or hematoxylin and eosin–stained sections of the following organs of leukemic mice. #882, femur (1000×). #883, lung (10× and 1000×). #50: top, from left to right: spleen (25×, 400×, and 1000×); bottom, from left to right: femur (200× and 1000×), lung (10×). Bars: 200 μm (10×), 500 μm (25×), 50 μm (400×), 20 μm (1000×). (E) Diagnoses according to the Bethesda Classification of Nonlymphoid Hematological Malignancies10 in n = 26 knock-in mice expressing the Δ297-300aa mutation.9 (F) Histological analysis of the myelosarcoma diagnosed 15 months after initial PV diagnosis, found to carry the JAK2V617F mutation as well as a NFE2 R273W, but no additional AML driver mutation. (Left) hematoxylin and eosin staining (right) anti-CD43 staining. Left and right: magnification 200×; size bar indicates 50 μm.
Transplantation of mutant NFE2 BM accelerates leukemic transformation – isolated myelosarcoma with mutated NFE2 in a PV patient. (A) Kaplan-Meier survival analysis of mice expressing various NFE2 mutations, wt-NFE2, or an empty control vector, as indicated. (Left) Primary recipients. (Right) secondary recipients transplanted with BM from primary recipients before the outbreak of acute leukemia. **P < .01 each of the mutations vs wt. (B) Hematological parameters of selected mice that developed leukemia. HCT, hematocrit; PLT, platelets; WBC, white blood cells. Blood counts indicating leukocytosis, anemia, and thrombocytopenia, the clinical hallmarks of leukemia, are highlighted in the black boxes. (C) FACS analysis of PB leukocytes of mice #882, #883, and #50. Cells were stained with CD11b and Ly6G/C to determine myeloid cells. (D) Histological analysis, CAE or hematoxylin and eosin–stained sections of the following organs of leukemic mice. #882, femur (1000×). #883, lung (10× and 1000×). #50: top, from left to right: spleen (25×, 400×, and 1000×); bottom, from left to right: femur (200× and 1000×), lung (10×). Bars: 200 μm (10×), 500 μm (25×), 50 μm (400×), 20 μm (1000×). (E) Diagnoses according to the Bethesda Classification of Nonlymphoid Hematological Malignancies10 in n = 26 knock-in mice expressing the Δ297-300aa mutation.9 (F) Histological analysis of the myelosarcoma diagnosed 15 months after initial PV diagnosis, found to carry the JAK2V617F mutation as well as a NFE2 R273W, but no additional AML driver mutation. (Left) hematoxylin and eosin staining (right) anti-CD43 staining. Left and right: magnification 200×; size bar indicates 50 μm.
The observation of granulocytic sarcoma in 2 mice transplanted with NFE2 mutant BM was especially intriguing for 2 reasons. First, we have generated a mono-allelic knock-in mouse strain, expressing the NFE2 Δ297-300-mutation10 from the endogenous NFE2 locus. In this strain, 6 (23%) of 26 mice developed a granulocytic sarcoma with or without an accompanying AML (Figure 5E; supplemental Figure 7). Of note, the presence of physiological levels of mutant NFE2 in knock-in mice significantly increased Nfe2 protein levels (supplemental Figure 8). Second, we identified a 60-year-old male patient who presented with polycythemia vera (PV) in 2015 and was shown to carry the JAK2V617F mutation, but was not screened for NFE2 at diagnosis. Fifteen months after the initial PV diagnosis, he developed a myelosarcoma on his left acetabulum, confirmed by histological and immunohistochemical staining against CD43, as well as a panel of additional antigens (Figure 5F; supplemental Table 3).21 At this time, his peripheral blood counts were normal and a bone marrow biopsy showed 1% blasts. DNA from both the tumor biopsy and the PB was screened for mutations associated with myeloid malignancies (supplemental Table 3). Tumor DNA contained the JAK2V617F mutation at a variant allele fraction (VAF) of 39% and, in addition, a mutation in NFE2 (R273W) at a VAF of 21%, but was negative for any other mutations in the 23-gene panel. Similarly, whole-blood leukocytes at the same time carried only the JAK2V617F and the NFE2 mutation (VAF of 38% and 20%, respectively).
In our mice, transformation to AML or granulocytic sarcoma occurred with a latency between 5 and 18 months, strongly suggesting that additional aberrations are required for disease exacerbation. We therefore used high-resolution array comparative genomic hybridization to assess chromosomal integrity in 10 mice that developed leukemia, as well as 15 mice that showed a stable MPN phenotype. Although none of the 15 MPN mice showed copy number alterations (examples in supplemental Figure 9), 7 leukemic mice (70%) showed gains and losses of chromosomal material (Figure 6A-E). Four (57%) of the 7 mice showed an amplification of murine chromosome 15 (Figure 6A-C,E), which is syntenic to human chromosome 8 and carries the MYC gene. Trisomy 8 is frequently observed in both MPN and patients with AML,22,23 including post-MPN AML, and we have previously described the occurrence of murine trisomy 15 in transgenic mice overexpressing wt-NFE2.20 Of note, in mouse #524, trisomy 15 was present in spleen, BM, and the concurrent sarcoma (Figure 6A), whereas mouse #540 incurred chromosomal aberrations in the granulocytic sarcoma, which were not present in the spleen, including trisomy 15 (Figure 6B). The size of the amplified region on chromosome 15 varied between the 4 mice: in mouse #540, it encompassed only 102 probes, spanning a region of 1.9 Mb that encodes 5 genes, among them Myc (Figure 6B).
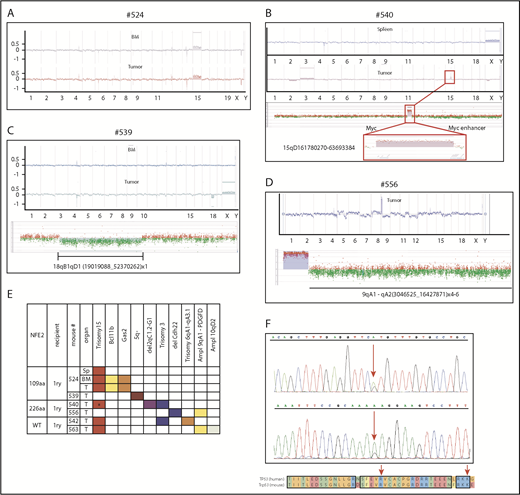
Mice expressing mutant NFE2 acquire chromosomal aberrations and Trp53 mutations similar to those observed in human AML. (A-E) Array-comparative genomic hybridization of leukemic mice to wild-type controls. Genomic DNA of BM, spleen, or granulocytic sarcoma tissue from individual leukemic mice was hybridized to a pool of n = 10 wild-type controls. Detection of an equal amount of fluorescence in both DNAs results in a plot along the axis in the middle of the graph. Loss of DNA is depicted as signals below the axis; a gain of genetic material as signals above the axis. (A) Mouse #524, (top) BM and (bottom) granulocytic sarcoma. (B) Mouse #540, (top) spleen and (bottom) granulocytic sarcoma. (Bottom insert) Detailed view of the aberrations in the granulocytic sarcoma of mouse #540. (Top) amplification of band 15qD1; (bottom) higher magnification of the probes amplified in band 15qD1. (C) Mouse #539, (top) BM and (middle) granulocytic sarcoma, (insert) detailed view of the amplified region on chromosome 18. (D) Mouse #556, (top) granulocytic sarcoma, (bottom) detailed view of the amplified region on chromosome 9. (E) Commute plot of the chromosomal aberrations identified. BM, bone marrow; MyS, myelosarcoma; PDGFD, platelet-derived growth factor D; Sp, spleen; T, tumor; WT, wild-type NFE2 overexpression. *Region spanning 1.9 Mb containing Myc. (F) Acquired mutations in Trp53.
Mice expressing mutant NFE2 acquire chromosomal aberrations and Trp53 mutations similar to those observed in human AML. (A-E) Array-comparative genomic hybridization of leukemic mice to wild-type controls. Genomic DNA of BM, spleen, or granulocytic sarcoma tissue from individual leukemic mice was hybridized to a pool of n = 10 wild-type controls. Detection of an equal amount of fluorescence in both DNAs results in a plot along the axis in the middle of the graph. Loss of DNA is depicted as signals below the axis; a gain of genetic material as signals above the axis. (A) Mouse #524, (top) BM and (bottom) granulocytic sarcoma. (B) Mouse #540, (top) spleen and (bottom) granulocytic sarcoma. (Bottom insert) Detailed view of the aberrations in the granulocytic sarcoma of mouse #540. (Top) amplification of band 15qD1; (bottom) higher magnification of the probes amplified in band 15qD1. (C) Mouse #539, (top) BM and (middle) granulocytic sarcoma, (insert) detailed view of the amplified region on chromosome 18. (D) Mouse #556, (top) granulocytic sarcoma, (bottom) detailed view of the amplified region on chromosome 9. (E) Commute plot of the chromosomal aberrations identified. BM, bone marrow; MyS, myelosarcoma; PDGFD, platelet-derived growth factor D; Sp, spleen; T, tumor; WT, wild-type NFE2 overexpression. *Region spanning 1.9 Mb containing Myc. (F) Acquired mutations in Trp53.
We observed several additional chromosomal changes that correspond to alterations characteristic of human AML. Two mice showed a partial amplification of chromosome 9 in segments that include the gene for platelet-derived growth factor D (Figure 6E). Platelet-derived growth factor receptor rearrangements are recurrently observed in MPN and patients with AML, often, but not invariably, associated with eosinophilia.24 Elevated eosinophil counts were observed in these 2 mice. Mouse #539 developed an AML without maturation accompanied by a granulocytic sarcoma (Figure 6C). As in mouse #540, the granulocytic sarcoma DNA in mouse #539 displayed chromosomal aberrations not seen in the spleen or BM (Figure 6C); namely, a deletion in murine chromosome 18 (qA1-qD1). This corresponds to the syntenic region on human chromosome 5q identified as the minimally deleted region in AML,25 distinct from the 5q minimally deleted region in patients with MDS. Similar to the human AML 5q minimally deleted region, the region contains the genes for Apc and Egr1. Stoddart and colleagues have shown that haploinsufficiency of Egr1 and Apc cooperate with loss of Trp53 to induce AML in a murine model.26 We therefore screened a larger cohort of 21 leukemic mice for the presence of Trp53 mutations. This included the 14 primary BM transplanted leukemic mice expressing mutant NFE2 (Figure 4A), 3 overexpressing wt-NFE2 by BM transplantation, and 4 secondary recipients who developed leukemia (Figure 5). We detected Trp53 mutations in 3 (14%) of 21 animals (Figure 6F; supplemental Table 4). The murine Trp53 p.Arg270His mutation corresponds to a mutation reported in human AML (Figure 6F; supplemental Table 4).27 These data show that the presence of mutant NFE2 causes leukemic transformation in a high proportion of animals with a long latency during which AML-specific mutations are incurred.
Discussion
Several common AML mutations, for example, the FLT3 internal tandem repeat and RUNX1-RUNX1T1, do not cause leukemia in murine models.22 These alterations require cooperation with additional aberrations for disease induction.23 Here, we report that, in contrast, increased activity of the transcription factor NFE2 by either overexpression or mutation is sufficient to induce overt leukemia in a large proportion of animals. Nonetheless, mutant NFE2 likewise requires cooperative events, as leukemic mice harbor additional aberrations. In contrast to FLT3 internal tandem repeat or RUNX1-RUNX1T1, however, aberrant NFE2 activity appears capable of altering hematopoietic stem cell properties to facilitate the acquisition of additional mutations.
As NFE2 mutant mice displayed a variety of alterations, with an overrepresentation of Myc amplification and Trp53 mutations, we propose that cells combining elevated NFE2 activity with a second mutation obtain a selective advantage. Together with the myeloid bias conferred by elevated NFE2 activity,10 these data explain the propensity of NFE2 mutations to specifically promote AML development. Our data extend the pathophysiological role of aberrant NFE2 expression from its previously recognized role in MPN to a pathophysiological function in de novo leukemogenesis.
The frequency of myeloid sarcomas in NFE2 mutant mice provide experimental evidence for the hypothesis proposed by Lazaerivic et al, who observed NFE2 mutations in a large proportion of isolated myeloid sarcomas.9 The authors suggested that aberrant NFE2 activity may alter HSC homing, allowing stem cells to survive and proliferate in extramedullary sites, a model now supported by both our murine and our patient data. Of note, after the initial JAK2V617F mutation, the NFE2 mutation was the only myeloid-malignancy associated mutation detected in tumor DNA from our patient.
NFE2 mutations fall into 2 categories, type I and type II, which augment or diminish wt-NFE2 activity, respectively (Figure 2). Expression of the myeloid transcription factor CEBPA is likewise both elevated and silenced in patients with AML. Although CEBPA mutations increase transcription factor levels, methylation of the CEBPA locus drastically decreases expression.28 Either perturbation promotes leukemogenesis.29,30 Similarly, bi-allelic mutations of RUNX1, which completely abrogate transcription factor expression, are frequent in AML-M0 patients.31,32 Similarly, both aberrantly elevated and unphysiologically low levels of NFE2 activity are therefore likely to contribute to leukemogenesis. As NFE2 forms homodimers,33 we hypothesize that type I and type II mutants interact or lose interaction with different co-factors, thereby assembling alternative, proliferation-inducing protein complexes around wt-NFE2. Our data suggest that normalization of NFE2 expression in HSCs may curtail evolution of the leukemic clone.
The publication costs of this article were defrayed in part by page charge payment. Therefore, and solely to indicate this fact, this article is hereby marked “advertisement” in accordance with 18 USC section 1734.
Acknowledgments
The authors sincerely thank Franziska Zipfel, Martina de Groot, and Emmanuelle Verger for expert technical assistance and Tim Grob (Erasmus University Medical Center) for statistical analyses.
This work was supported by grants from Deutsche Forschungsgemeinschaft (Pa 611/5-2 and Pa 611/6-1 [H.L.P.], as well as Pa 611/9-1 [H.L.P.] and Ju 31041/1-1 [J.S.J.] within the research consortium FOR 2674). S.B.K. would like to thank the José Carreras Leukemia Foundation for the receipt of a scholarship (PS 16/06). J.S.J. would like to express his gratitude to the Marina & Willi Bär-Stiftung for awarding the project presented here with the prize for the best unpublished work in the field of AML 2018.
Authorship
Contribution: J.S.J. designed research, performed research, analyzed data, and wrote the paper; T.B. designed research, performed research, and analyzed data; M.P. designed research, performed research, and analyzed data; S.K. performed and analyzed research; D.S. designed research, performed research, and analyzed data; M.A.S. designed research, performed research, and analyzed data; A.S.A.H. performed research and analyzed data; A.Z. performed research; S.B.K. designed research, performed research, and analyzed data; C.K. designed research, performed research, and analyzed data; J.O. designed research, performed research, and analyzed data; K.A. analyzed data; W.W. designed research, performed research, and analyzed data; E.R. designed research and analyzed data; B.C. designed research and analyzed data; L.B. designed research and analyzed data; B.S. designed research and analyzed data; P.J.M.V. designed research and analyzed data; and H.L.P. designed research, supervised research, analyzed data, and wrote the paper.
Conflict-of-interest disclosure: The authors declare no competing financial interests.
Correspondence: Heike Luise Pahl, Department of Medicine I, University Medical Center Freiburg, Hugstetter Str 55, 79106 Freiburg, Germany; e-mail: heike.pahl@uniklinik-freiburg.de.