Abstract
Despite improvements in the prognosis of childhood acute lymphoblastic leukemia (ALL), subgroups of patients would benefit from alternative treatment approaches. Our aim was to identify genes with DNA methylation profiles that could identify such groups. We determined the methylation levels of 1320 CpG sites in regulatory regions of 416 genes in cells from 401 children diagnosed with ALL. Hierarchical clustering of 300 CpG sites distinguished between T-lineage ALL and B-cell precursor (BCP) ALL and between the main cytogenetic subtypes of BCP ALL. It also stratified patients with high hyperdiploidy and t(12;21) ALL into 2 subgroups with different probability of relapse. By using supervised learning, we constructed multivariate classifiers by external cross-validation procedures. We identified 40 genes that consistently contributed to accurate discrimination between the main subtypes of BCP ALL and gene sets that discriminated between subtypes of ALL and between ALL and controls in pairwise classification analyses. We also identified 20 individual genes with DNA methylation levels that predicted relapse of leukemia. Thus, methylation analysis should be explored as a method to improve stratification of ALL patients. The genes highlighted in our study are not enriched to specific pathways, but the gene expression levels are inversely correlated to the methylation levels.
Introduction
Acute lymphoblastic leukemia (ALL) is the most common form of childhood cancer. Currently, ALL is classified into genetic subtypes according to cytogenetically defined chromosomal aberrations, of which the most frequent in B-cell precursor leukemia (BCP ALL) are the translocations ETV6/RUNX1, that is, t(12;21)(p13;q22), E2A/PBX1, that is, t(1;19)(q23;p13), and BCR/ABL, that is, t(9;22)(q34;q11); high hyperdiploidy (HeH); and rearrangement of the MLL gene on chromosome region 11q23.1 These large-scale genetic aberrations are important hallmarks and valuable for guiding the treatment of BCP ALL patients. T-lineage ALL (T-ALL) is characterized by cryptic rearrangements in multiple genomic regions, including the T-cell receptor gene regions on chromosomes 14q11 and 7q32 in approximately one-half of the cases.2,3
In addition to large-scale chromosomal aberrations, other molecular mechanisms are likely to contribute to the conversion of lymphocyte progenitor cells into leukemic cells.4 DNA methylation, which occurs most frequently at cytosine residues in CpG sites, plays an important role both in the control of chromatin structure and of gene expression. Methylation of CpG sites in promoter regions of genes regulates their expression by alteration of chromatin structure or by direct interactions between CpG sites and transcription factors. Perturbation of DNA methylation could be one of the molecular mechanisms underlying leukemia.
In early studies investigators5,6 have obtained promising results in the use of hypermethylation of CpG sites in individual candidate genes as biomarkers for the identification of subgroups of childhood ALL and prognosis of disease progression. More recently, large-scale methylation analyses have identified methylation profiles that distinguish ALL cells from normal cells7,8 and from the other leukemia cell types: AML,9 CLL, and MCL.10 Moreover, the methylation status of a single gene, DDX51, was found to differentiate patients with B-cell and T-cell ALL.8 Aberrant methylation of CpG sites in the promoter regions of genes in leukemia cell lines or primary ALL cells has been found to correlate with the expression of individual genes.7-9
So far, genome-wide profiling of DNA methylation has relied on indirect methods, such as use of methylation-sensitive enzymes, which yield data only on a reduced representation of CpG sites in the genome.11 An alternative approach is to use direct hybridization with tiling probes that target the CpG sites in the entire genome for unbiased detection of methylated CpG sites. The high costs of genome-wide oligonucleotide microarrays prohibit their use in large sample sets.12 Consequently, studies on DNA methylation in ALL have been limited by incomplete representation of the analyzed CpG sites and by a small number of samples included in the analysis.7-10 Genome-wide gene expression studies have been more successful in the identification of gene sets that could be used as ALL subtype classifiers and as prognostic markers.13-19
In a recent genome-wide survey of 8000 genes in 197 bone marrow or blood samples from children diagnosed with ALL in the Nordic countries,20 we identified 400 genes that displayed imbalanced allele-specific expression (ASE). ASE indicates that the expression of these genes is regulated by cis-acting factors, of which DNA methylation that silences gene expression could be one. For a subset of these genes we demonstrated a quantitative correlation between ASE and CpG site methylation of gene promoter regions.20 In the present study the methylation status of 1320 CpG sites in the genes that displayed ASE in our previous study were determined by the use of a quantitative methylation assay in 401 ALL samples, including the 197 samples analyzed in our previous study. Our aim was to identify genes in which CpG site methylation would allow the classification of ALL subtypes and predict the response to treatment and clinical outcome of the patients.
Methods
Patient samples
Bone marrow or peripheral blood samples from 401 children (235 boys and 166 girls) diagnosed with ALL were included in the study. A total of 388 of the children were enrolled on the Nordic Society of Pediatric Hematology and Oncology ALL 1992 or ALL 2000 treatment protocol during 1996 to 2006.21 Thirteen patients younger than 1 year of age were treated according to the Interfant99 protocol.22 The Ethics Committee of Uppsala University approved the study, and the patients and/or their guardians provided written informed consent. The study was conducted in accordance with the Declaration of Helsinki. The clinical characteristics of the patients, including immunophenotypes and chromosomal aberrations, are listed in Table 1. Clinical follow-up data were retrieved from the Nordic registry at the Childhood Cancer Research Unit in Stockholm, with the last follow-up in March 2009. The median follow-up time for surviving patients was 6.4 years (range, 1.6-12.5 years). Fifteen control DNA samples that were isolated from bone marrow identically as the DNA samples from ALL patients were included as control samples.
The cell samples were collected in heparinized tubes before treatment and shipped to the laboratory in Uppsala within 24 to 36 hours. Leukemic cells were isolated by 1.077 g/mL Ficoll-Isopaque (Pharmacia) density-gradient centrifugation. The proportion of leukemic cells was estimated on May-Grünwald-Giemsa–stained cytocentrifugate preparations by the use of light microscopy. The cell samples selected for analysis contained at least 90% lymphoblasts after separation. Pellets of 2 to 10 million cells were immediately frozen and stored at −70°C in established tissue banks at Uppsala University Hospital following institutional guidelines.
DNA extraction and sodium bisulfite treatment
DNA was extracted from samples containing 2 to 10 million cells by the use of the AllPrep DNA/RNA Mini Kit (QIAGEN) or the QIAamp DNA Blood Mini Kit (QIAGEN). The DNA was eluted twice in 100 μL of elution buffer (QIAGEN) and quantified by the use of the NanoDrop ND-1000 UV-Vis spectrophotometer (NanoDrop Technologies). Between 600 and 750 ng of DNA was treated with sodium bisulfite by use of the protocol and reagents from the EZ-96 DNA Methylation Kit (Zymo Research). The modified DNA was eluted in 12 μL of elution buffer and stored at −70°C until use. A whole-genome–amplified DNA sample, where all CpG sites are unmethylated, and a DNA sample treated with SssI methyltransferase to methylate all CpG sites were used as negative and positive controls in the methylation assay.
Analysis of DNA methylation
A custom-designed GoldenGate methylation analysis panel (Illumina Inc)23 was used for the analysis of 1536 CpG sites located 2 kb upstream to 1 kb downstream of the transcription start site in 416 genes. The GoldenGate methylation assay is based on genotyping of C/U polymorphisms, which appear as a result of the conversion of unmethylated C-nucleotides into U-nucleotides by bisulfite treatment. The genotyping assay uses allele-specific primers, which are extended with dNTPs and ligated to locus-specific oligonucleotides. The ligated products are then amplified by the use of PCR with fluorescently labeled universal primers in a 1536-plex reaction and captured by hybridization to BeadArrays.24 The fluorescence signals were measured from the BeadArrays by the use of an Illumina BeadStation GX scanner. The fluorescence data were then analyzed by the use of the BeadStudio software (Illumina Inc), which assigns a quantitative measure of the methylation levels (beta value) for each CpG site, that corresponds to the ratio between the fluorescence signal from the methylated allele (C) and the sum of the fluorescent signals of the methylated (C) and unmethylated (U) alleles. The beta values range from 0 to 1.0, which corresponds to no methylation of either allele to complete methylation of both alleles.
For quality control of the methylation data, an equation implemented in the BeadStudio software was used to calculate a detection P value, which describes the chance that a signal from a target CpG site is distinguishable from that from the negative controls. A detection P value greater than 0.05 in more than 50 samples was used as a cutoff, whereby 216 CpG sites were excluded from further analysis. The remaining 1320 CpG sites with high-quality data were used for the analysis. The negative and positive control samples had median beta values of 0.07 and 0.79, respectively, across all CpG sites that passed the quality control filter.
The performance of the GoldenGate methylation assay was validated by replicating the bisulfite treatment and subsequent CpG site methylation analysis in 21 samples. The concordance between replicate assays across the 300 variable CpG sites selected for analysis was high, with a median Pearson correlation coefficient R = 0.90 for pairwise sample comparisons. The corresponding correlation coefficient was R = 0.93 for pairwise CpG site comparisons across the 21 replicate samples (supplemental Figure 1 and supplemental Table 1, available on the Blood website; see the Supplemental Materials link at the top of the online article). In addition, the methylation levels of CpG sites determined by the GoldenGate assay were validated in 5 genes in 8 samples by standard Sanger sequencing. With the use of the median beta values for the positive and negative control samples as cutoff values for complete methylation (C) and no methylation (T = U), concordant results for the methylation status determined by both methods were obtained for 87% of the observations (supplemental Figure 2). More details and data from the validation experiments are available as supplemental Methods and supplemental Figure 2.
Determination of total gene expression levels
The ASE data from our previous study, in which we genotyped 11 000 SNPs in exon-coding regions of 8000 genes in 197 ALL samples by using Illumina BeadArray technology,20 were converted to total gene expression levels by summing the mean fluorescence signals for the 2 SNP alleles measured in triplicate assays. In this calculation we included both the samples that were heterozygous at the indicator SNPs used to score ASE and the samples that were homozygous at the indicator SNPs. To correct for possible differences in signal intensities between samples caused by technical factors, such as amount and quality of RNA analyzed, the sum of the fluorescent signals from the 2 SNP alleles for each gene was quantile normalized across the samples before analysis.25
Data analysis and statistical methods
The data analyses were performed by the use of programs written in R,26 applying the “cluster” and “survival” packages and standard functions. Unsupervised hierarchical clustering was performed by the use of conventional agglomerative clustering (using “hclust”) with one minus the correlation coefficient as the similarity measure for pairs of individuals and average linkage as the measure of cluster similarity. The “diana” algorithm was applied for “divisive” hierarchical clustering to divide the ALL samples into 2 groups according to similarities in their methylation patterns. This algorithm performs the clustering by a divisive (top-down) procedure, in which the whole dataset is iteratively divided into smaller parts. Outcome analyses were performed with consideration of competing risks by the use of the Gray test to assess differences between groups27 and the Fine and Gray proportional hazards model for univariate and multivariate analyses of potential prognostic factors.28 Pearson correlation coefficients were calculated for DNA methylation and total gene expression levels. Ingenuity Pathway Analysis (Ingenuity Systems Inc) was applied to gene sets identified by the methods described previously.
For the multivariate classification analyses, nearest shrunken centroids (NSCs) classifiers29 were designed as part of an external 10-fold cross-validation procedure.30 In each fold the shrinkage parameter of the NSC classifier was chosen to minimize the internal 10-fold cross-validation error. To determine the significance of the classification results obtained, this double-loop cross-validation procedure also was used 1000 times, with permuted class labels for the design examples. The implementation was performed by means of the R-package “pamr” (http://cran.r-project.org) combined with a modified version of the module for external cross-validation.31 CpG sites ranked among the top 80% in each fold were visualized by biclustering with the CpG sites along one dimension and the patient samples along the other. For the visualization, divisive hierarchical clustering that uses the Euclidean distance metric and the “diana” algorithm32 as implemented in the R-package was used. More details on the multivariate classification procedure are available as supplemental Methods and supplemental Table 4.
Results
Selection of CpG sites
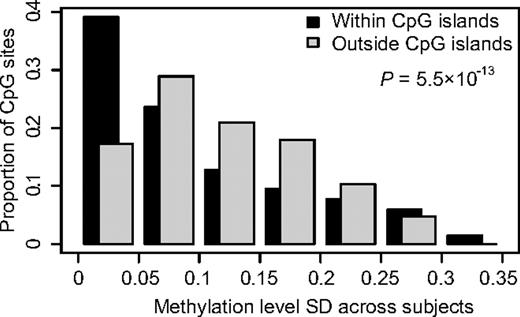
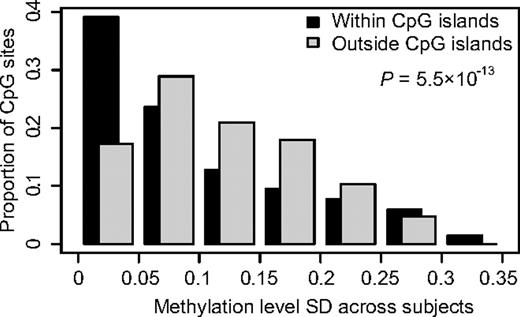
We determined the methylation status of the promoter regions of 416 genes in bone marrow or peripheral blood samples from 401 children with ALL. Of the genes included in the analysis, 391 genes were selected because in a previous study20 they displayed ASE in a subset of the ALL samples analyzed here. We also included 10 candidate genes on the basis of previous studies on methylation in ALL8,10,33-35 and 15 genes reported to be functional or marker genes in ALL.36-41 By using the quantitative GoldenGate assay, we measured the methylation levels of 1320 CpG sites in these genes. Supplemental Table 2 provides the complete set of data from this analysis and indicates which of the genes were selected on the basis of ASE and which from the literature, respectively. We detected consistently lower methylation levels for CpG sites located within CpG islands, which are regions of at least 200 bp in size with increased GC content than in CpG sites outside CpG islands (Table 2). CpG sites outside CpG islands also exhibited significantly more variation in methylation levels than CpG sites within CpG islands (Figure 1). We reasoned that CpG sites with variation in their methylation levels between ALL samples are potentially most informative as markers for classification of ALL. Therefore, we selected CpG sites that displayed high SDs (> 0.16) combined with a wide range distribution (0.73-0.95) for the beta values across all ALL samples for analysis. Variable CpG sites located close to each other with similar methylation patters were excluded to avoid redundancy and to reduce the number of tests to be performed. On the basis of these considerations, we included 300 variable CpG sites located in 189 genes for further analysis (supplemental Table 2).
Comparison of the variability in methylation levels between CpG sites located within or outside CpG islands. The SDs for methylation levels measured for 1320 CpG sites across 401 ALL samples (529 320 observations) are shown on the horizontal axis. The vertical bars show the proportion of the observations in each bin of SD in methylation level. The graph shows that CpG sites outside CpG islands have greater variability in methylation levels between samples than CpG sites within CpG islands (P < .001).
Comparison of the variability in methylation levels between CpG sites located within or outside CpG islands. The SDs for methylation levels measured for 1320 CpG sites across 401 ALL samples (529 320 observations) are shown on the horizontal axis. The vertical bars show the proportion of the observations in each bin of SD in methylation level. The graph shows that CpG sites outside CpG islands have greater variability in methylation levels between samples than CpG sites within CpG islands (P < .001).
DNA methylation profiles in ALL subtypes
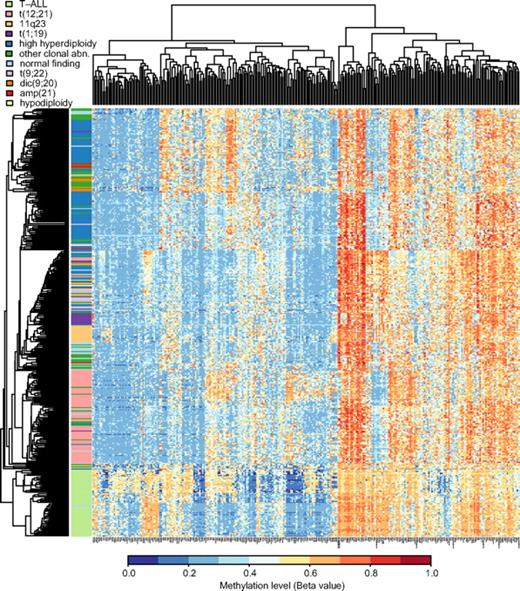
Table 2 shows that the median methylation levels of the 300 selected variable CpG sites were greater in the ALL samples than in 15 nonleukemic control samples (P < .001) and that the ALL samples with the BCP immunophenotype had lower median methylation levels than the T-ALL samples (P < .001). We then used the 300 selected CpG sites for unsupervised hierarchical clustering of the 401 ALL samples included in our study. The dendrogram in Figure 2 demonstrates that this analysis clearly separates the samples from patients with T-ALL and BCP ALL. The methylation patterns of the CpG sites also allowed distinction between the main cytogenetic subtypes of BCP ALL, that is, HeH, t(12;21), 11q23, and t(1;19). A total of 7 of 8 samples with dic(9,20) clustered with other clonal abnormalities, 4 of the 6 samples with icamp(21) clustered in the HeH group, and 11 samples with t(9;22) clustered in the center of the dendrogram in a mixed group of samples. Samples with other clonal abnormalities and normal cytogenetic findings were scattered and interspersed with other subtypes.
Hierarchical clustering to separate ALL subtypes by methylation profiles. Unsupervised hierarchical clustering was performed by the use of beta values for the 300 selected CpG sites as the distance metric and average linkage as the clustering method, including all study samples. In the dendrogram each individual sample is represented by a horizontal line, and the color of the line corresponds to the cytogenetic subtype of the sample. The color code for the ALL subtypes is given above the dendrogram. The CpG sites are clustered according to methylation level and shown in the vertical columns. High methylation levels are shown in red and low methylation levels in blue, according to the scale bar below the figure.
Hierarchical clustering to separate ALL subtypes by methylation profiles. Unsupervised hierarchical clustering was performed by the use of beta values for the 300 selected CpG sites as the distance metric and average linkage as the clustering method, including all study samples. In the dendrogram each individual sample is represented by a horizontal line, and the color of the line corresponds to the cytogenetic subtype of the sample. The color code for the ALL subtypes is given above the dendrogram. The CpG sites are clustered according to methylation level and shown in the vertical columns. High methylation levels are shown in red and low methylation levels in blue, according to the scale bar below the figure.
DNA methylation and clinical outcome in HeH and t(12;21) ALL
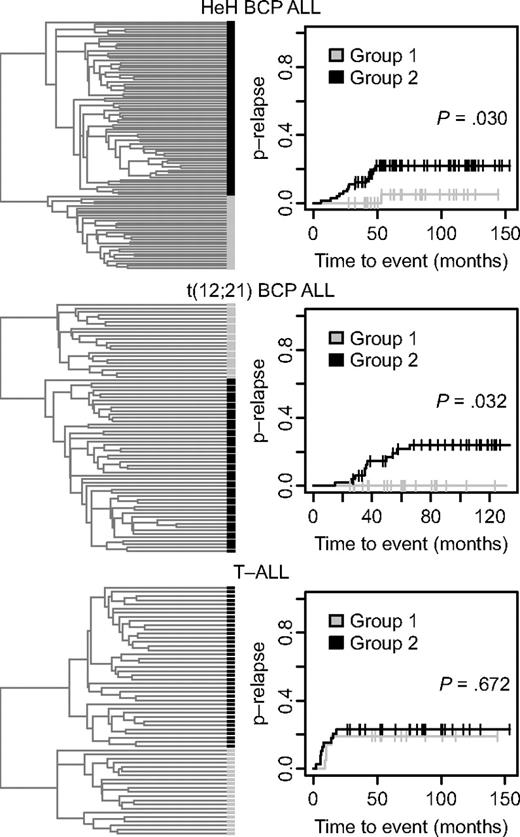
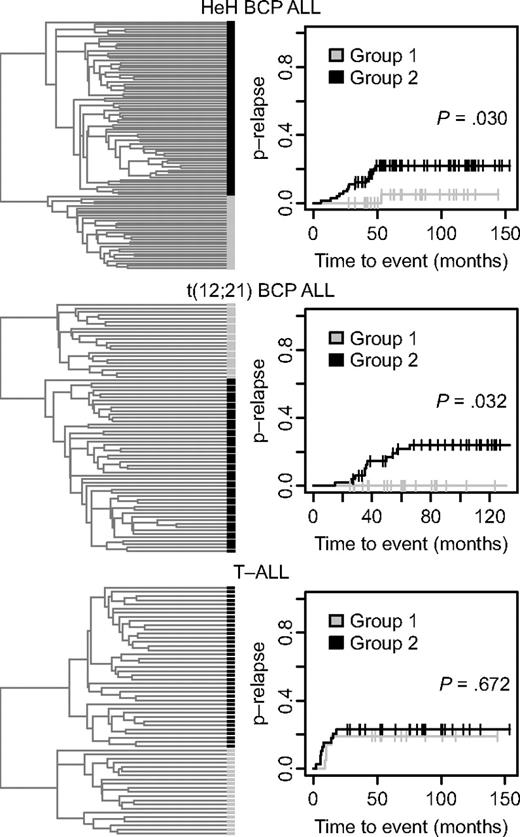
In an effort to identify ALL patients with differences in clinical outcome depending on their DNA methylation patterns, we used the 300 variable CpG sites for further hierarchical clustering of the samples in the 3 largest subtypes T-ALL, t(12;21), and HeH into 2 separate and distinct groups (Figure 3). Evaluation of the clinical information of the patients in these groups revealed a difference in the probability of relapse between the 2 HeH groups. There was only 1 relapse among the 31 patients in group 1 compared with 15 relapses among the 73 patients in group 2 (P = .030; Figure 3 top right). There was also a difference in the probability of relapse between the 2 t(12;21) subgroups, with no relapse among the 22 patients in group 1 compared with 11 relapses among the 51 patients in group 2 (P = .032; Figure 3 middle right). There was no difference in the probability of relapse between the 2 T-ALL subgroups defined by their DNA methylation status in the divisive cluster analysis.
Refined hierarchical clustering of ALL samples in the HeH and t(12,21) BCP ALL and T-ALL subgroups by methylation profile and analysis of probability of disease relapse. (Left) Dendrograms from divisive (top-down) hierarchical clustering by use of the Euclidean distance between beta values for the 300 selected CpG sites as distance metric. In the dendrogram each individual sample is represented by a black or gray horizontal bar. (Right) Probability of relapse (p-relapse) for the patients in group 1 and group 2 (Gray test). The p-relapse is given on the y-axis and the observation time in months on the x-axis. The P values for the difference in p-relapse between group 1 and group 2 are shown in the panels (Gray test). The total number of different events in the 2 groups of patients with HeH and t(12;21) ALL are shown in supplemental Table 3. The number of events for the patients with T-ALL is given in Table 1.
Refined hierarchical clustering of ALL samples in the HeH and t(12,21) BCP ALL and T-ALL subgroups by methylation profile and analysis of probability of disease relapse. (Left) Dendrograms from divisive (top-down) hierarchical clustering by use of the Euclidean distance between beta values for the 300 selected CpG sites as distance metric. In the dendrogram each individual sample is represented by a black or gray horizontal bar. (Right) Probability of relapse (p-relapse) for the patients in group 1 and group 2 (Gray test). The p-relapse is given on the y-axis and the observation time in months on the x-axis. The P values for the difference in p-relapse between group 1 and group 2 are shown in the panels (Gray test). The total number of different events in the 2 groups of patients with HeH and t(12;21) ALL are shown in supplemental Table 3. The number of events for the patients with T-ALL is given in Table 1.
The white blood cell (WBC) count at diagnosis and the prevalence of the classical trisomies of chromosomes X, 4, 6, 10, 14, 17, 18, and 21 were similar in the 2 HeH subgroups. The median modal number of chromosomes was also similar, with 55 and 56 in groups 1 and 2 in Figure 3, respectively. In regression analysis, including age, sex, and WBC at diagnosis as covariates, DNA methylation defined a cohort (HeH group 2 in the top right of Figure 3) with increased risk of relapse with a relative risk of 6.4 (95% confidence interval, 0.89-0.47; P = .066). None of the other factors had an independent prognostic impact (P > .3). Early treatment response was not included in this model because data on minimal residual disease were available for less than 50% of the patients, and all but 1 patient in each cluster group had less than 5% of blast cells (M1) in their bone marrow after induction therapy. As shown in supplemental Table 3, there were few other events than relapse among the patients. The t(12;21) subgroup with favorable prognosis had lower WBC count at diagnosis than the group with less favorable prognosis (P = .003, data not shown), but there was no difference in the frequency of del(12)(p13p13) or der(21)t(12,21). In the multivariate regression analysis, only WBC had independent prognostic impact (P < .001), with a trend value for age (P = .064).
Table 3 lists the genes that displayed a median CpG site methylation difference of 0.3 or greater between the samples in the 2 HeH groups (37 CpG sites in 30 genes) and the 2 t(12;21) groups (34 CpG sites in 27 genes). Sixteen of these genes (COBL, COL6A2, CPVL, DFNB31, EYA4, FAM24B, FAT1, FUCA2, INADL, MYO3A, PCDHGA12, PON3, ROR1, SYNM, TNIK, and ZNF502) were common for both cytogenetic subtypes. Interestingly, all but 1 of the 37 most variable CpG sites in the HeH subtype and all of the 34 most variable CpG sites in the t(12;21) subtype had a greater median methylation level in the group of patients (groups 1 in top and middle right panels of Figure 3) with better prognosis.
Multivariate classification of ALL subtypes with DNA methylation patterns
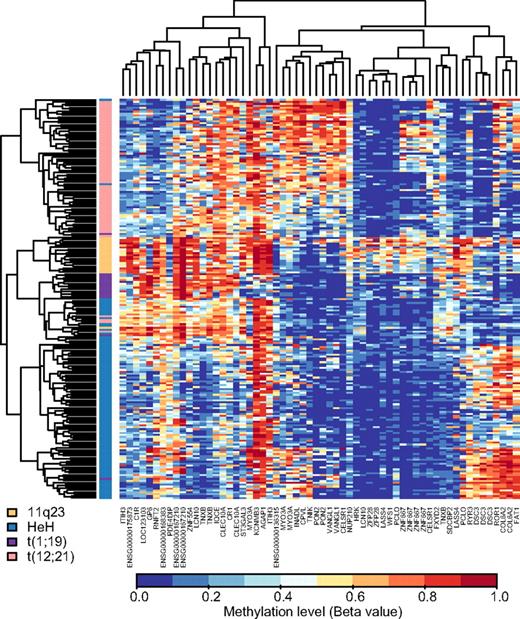
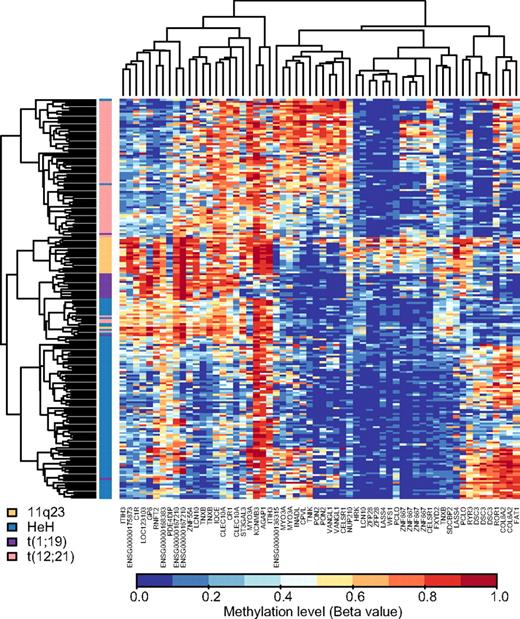
To identify genes with DNA methylation patterns that would allow discrimination between cytogenetic subtypes of ALL, we used the methylation data from the 300 selected CpG sites to design NSC classifiers in an external 10-fold cross-validation procedure. In each fold, nine tenths of the samples were used for classifier design, and one tenth of the samples were used to estimate the performance. In 2 separate experiments, we first applied this procedure for discrimination between the 213 samples belonging to the HeH, t(12;21), 11q23, or t(1;19) subtypes of BCP ALL and between the 401 samples in the BCP ALL and T-ALL groups, respectively (see Table 1). Table 4 illustrates the excellent performances of the classifiers obtained in both experiments. The permutation results confirm that it is unlikely (P < .001) to obtain the individual class accuracies by chance. The number of CpG sites selected for classification of the BCP ALL subtypes varied from 82 to 110 (median, 103) between folds. After filtering out the CpG sites that were not among the 80% top ranked sites in each of the 10 folds, the classifier selected 60 CpG sites located in 40 genes for classification of the BCP ALL subtypes. We used the methylation levels of these 60 CpG sites for hierarchical biclustering of the patient samples (Figure 4), which revealed distinct methylation differences between the 4 subtypes of BCP ALL. For discrimination between samples from patients with BCP ALL and T-ALL the classifier selected 9 CpG sites located in the CAPSL, CD300LF, GBE1, KIAA1462, MYBPC2, PECAM1, SDCBP2, SEC31B, and SLC22A18 genes that passed the 80% rank filter. SDCBP2 was the only one of these genes that was also among the 40 genes for classification of BCP ALL subtypes. Hierarchical biclustering by the use of these CpG sites revealed consistently high methylation levels in T-ALL samples and low methylation levels in the BCP ALL samples for the selected genes (supplemental Figure 3).
Biclustering of ALL patient samples in the 4 main BCP ALL subtypes according to methylation levels of CpG sites defined by repeated cross-validation supervised learning for multivariate classification. Shown is a “heat-map” of the main BCP ALL subtypes by use of the 60 most informative CpG sites in 40 genes defined by the NSC classifier. The CpG sites are shown in the vertical columns and the ALL samples in the horizontal rows. The color code for the BCP ALL subtypes is shown in the bottom left corner of the figure. High methylation levels are shown in red and low methylation levels in blue, according to the scale bar below the figure.
Biclustering of ALL patient samples in the 4 main BCP ALL subtypes according to methylation levels of CpG sites defined by repeated cross-validation supervised learning for multivariate classification. Shown is a “heat-map” of the main BCP ALL subtypes by use of the 60 most informative CpG sites in 40 genes defined by the NSC classifier. The CpG sites are shown in the vertical columns and the ALL samples in the horizontal rows. The color code for the BCP ALL subtypes is shown in the bottom left corner of the figure. High methylation levels are shown in red and low methylation levels in blue, according to the scale bar below the figure.
In addition to the 2 aforementioned analyses, we performed 12 pairwise experiments by using NSC classifiers, as described in the supplemental Materials and supplemental Table 4. The classifier selected additional genes with methylation patterns that discriminate between pairs of HeH, t(12;21), 11q23, or t(1;19) subtypes and between control cells and the ALL subtypes (supplemental Figure 3). Most of the genes (36 of 40) that emerged from the simultaneous classification of the 4 major subtypes of BCP ALL were also highlighted in the pairwise classification experiments for BCP ALL subtypes, together with 25 additional genes. Twelve genes that were not selected by the classifier for distinction between ALL subtypes emerged in the analysis involving the control cells. A summary of the CpG sites and genes highlighted by each of the 14 NSC classification experiments can be found in supplemental Table 5. The genes with differential methylation profiles between T-ALL and BCP ALL and subtypes of BCP ALL identified by the multivariate classification method represent promising candidate markers for subtyping ALL patients by the use of DNA methylation analysis.
Correlation between CpG site methylation in individual genes and clinical outcome
We also explored dependencies between the methylation level of CpG sites in individual genes and clinical outcome in the samples from T-ALL and BCP ALL patients. Univariate regression analysis highlighted 22 CpG sites in 20 genes, for which the methylation levels correlated with risk of relapse in the patients with a nominally significant P value less than .01 (Table 5). To visualize the dependencies between CpG site methylation and probability of relapse, we divided the samples into 3 groups on the basis of beta values, which roughly correspond to putatively no methylation, methylation of 1 allele, or methylation of both alleles at a CpG site. Figure 5 shows relapse curves for CpG sites in the RUNDC3B, ENSG00000167210, and SPON2 genes with strong correlations between CpG methylation and clinical outcome in patients with BCP ALL, and in the LRP1B gene in patients with T-ALL. The relapse curves for all 22 CpG sites with a regression P less than .01 according to the Fine and Gray test are presented in supplemental Figure 5. The presented P values are unadjusted for multiple testing. Hence, these results should be viewed as preliminary. Of the 20 genes identified here, 8 genes (CHST13, COBL, CPVL, EVC, LRP1B, PAX8, PCDHGA12, and SPON2) were also among the top genes highlighted by “divisive” hierarchical clustering (Table 3). High methylation levels correlated with favorable prognosis of the disease for these individual genes, with the exception of CHST13.
Correlation between methylation levels of CpG sites in the RUNDC3B, ENSG00000167210, SPON2, and LRP1B genes and clinical outcome of ALL patients. Probability of relapse (p-relapse) in patients stratified into 3 groups according to beta values less than 0.25, 0.25 to 0.75, and greater than 0.75 for methylation of (A) the CpG site in the ENSG00000167210 gene (chr18, position 42 434,938) in patients with BCP ALL; (B) the CpG site in the RUNDC3B gene (chr7, position 87 096,309) in patients with BCP ALL; (C) the CpG site in the SPON2 gene (chr4, position 1,155,890) in patients with BCP ALL; and (D) CpG site in the LRP1B gene (chr2, position 142,605,854) in patients with T-ALL. The p-relapse is given on the y-axis and the observation time in months on the x-axis. The P values calculated by the Gray test are given in the panels.
Correlation between methylation levels of CpG sites in the RUNDC3B, ENSG00000167210, SPON2, and LRP1B genes and clinical outcome of ALL patients. Probability of relapse (p-relapse) in patients stratified into 3 groups according to beta values less than 0.25, 0.25 to 0.75, and greater than 0.75 for methylation of (A) the CpG site in the ENSG00000167210 gene (chr18, position 42 434,938) in patients with BCP ALL; (B) the CpG site in the RUNDC3B gene (chr7, position 87 096,309) in patients with BCP ALL; (C) the CpG site in the SPON2 gene (chr4, position 1,155,890) in patients with BCP ALL; and (D) CpG site in the LRP1B gene (chr2, position 142,605,854) in patients with T-ALL. The p-relapse is given on the y-axis and the observation time in months on the x-axis. The P values calculated by the Gray test are given in the panels.
Gene functions
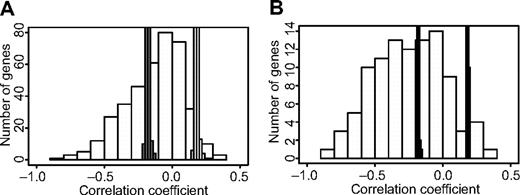
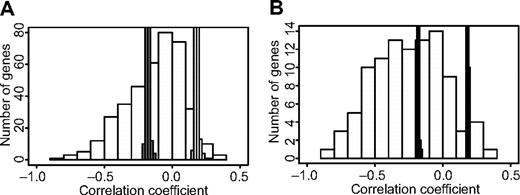
Ingenuity Pathway Analysis did not show statistically significant enrichment to specific pathways for the gene sets selected by the NSC classifier or genes in which the methylation patterns correlated with relapse of ALL. However, many of the genes encode proteins that are involved in key cellular functions like adhesion, apoptosis, proliferation, and growth (supplemental Table 6). For 47 of the 99 genes that emerged in the different parts of our study for which both methylation and gene expression data were available, we observed a clear inverse correlation (permuted P < .001) between CpG site methylation levels and gene expression levels (supplemental Table 7). For these genes, 7% to 77% (median, 23%) of the variation in gene expression levels between samples is explained by CpG site methylation. Given that these genes were originally included in our study because they displayed ASE and that we selected variable CpG sites for analysis, it is not unexpected that genes with an inverse correlation between CpG site methylation and gene expression levels are overrepresented among the genes highlighted in our study (Figure 6).
Overrepresentation of genes with an inverse correlation between CpG site methylation and gene expression levels among genes highlighted in the study. The Pearson correlation coefficients for the methylation levels and expression levels for (A) all 391 genes analyzed in this study and (B) 99 genes highlighted by methylation analysis in the study are shown on the horizontal axis, and the numbers of genes in each bin of correlation coefficients are shown on the vertical axis. The thin bars marked in gray indicate the upper and lower probability limits (P < .01) for random distribution of correlation coefficients according to 10 000 permutations per gene. The histogram shows that there is an overrepresentation of genes with an inverse correlation between methylation and gene expression levels, which is unlikely to occur by chance, both among all genes analyzed in the study and the genes highlighted by methylation analysis. A larger proportion of genes highlighted by methylation analysis have an inverse correlation with the total expression levels (56%) than that of all analyzed genes (33%). The data underlying the histogram is available in supplemental Table 7.
Overrepresentation of genes with an inverse correlation between CpG site methylation and gene expression levels among genes highlighted in the study. The Pearson correlation coefficients for the methylation levels and expression levels for (A) all 391 genes analyzed in this study and (B) 99 genes highlighted by methylation analysis in the study are shown on the horizontal axis, and the numbers of genes in each bin of correlation coefficients are shown on the vertical axis. The thin bars marked in gray indicate the upper and lower probability limits (P < .01) for random distribution of correlation coefficients according to 10 000 permutations per gene. The histogram shows that there is an overrepresentation of genes with an inverse correlation between methylation and gene expression levels, which is unlikely to occur by chance, both among all genes analyzed in the study and the genes highlighted by methylation analysis. A larger proportion of genes highlighted by methylation analysis have an inverse correlation with the total expression levels (56%) than that of all analyzed genes (33%). The data underlying the histogram is available in supplemental Table 7.
Discussion
In the present study we analyzed the DNA methylation patterns of 416 genes in a large collection of childhood ALL samples. The majority of the genes (n = 391) included in our analysis were selected on the basis of the results of a survey of ASE of 8000 genes20 in approximately one half of the ALL samples analyzed here. Our hypothesis when selecting these genes was that CpG site methylation in gene promoter regions is 1 of the cis-acting factors that leads to ASE by silencing the expression of 1 of the alleles. In contrast with earlier studies7,8,10 that have focused on analysis of methylation in CpG islands, our custom-designed array also included CpG sites located outside CpG islands within 2 kb upstream to 1 kb downstream of the transcription start site. Our selection of CpG sites was advantageous because CpG sites in these regions had greater overall methylation levels and greater variation in their methylation levels than CpG sites located within CpG islands. These findings are in agreement with a recent study, which found that most cancer- and tissue-specific methylation is located outside CpG islands up to 2 kb upstream of the transcription start sites of genes.42 The study found that the differentially methylated regions were frequently associated with alternative transcription start sites, suggesting a role for the CpG sites in these regions in the regulation of gene expression. In accordance with this suggestion, our study highlighted genes with a remarkable inverse correlation between CpG site methylation and expression.
An advantage of our study is that it included a large number of samples from clinically well-characterized ALL patients. Among the 401 ALL patients, most cytogenetic subgroups of ALL were represented by multiple samples. We describe here, for the first time, significant differences in methylation patterns between BCP and T-ALL and between subgroups of BCP ALL identified by the use of hierarchical clustering. For the first time, we also describe promising results by using carefully validated supervised learning for classification of ALL subtypes on the basis of methylation patterns. Although we did not analyze the same ALL subtypes as a previous study that used a similar supervised learning procedure for mRNA expression15 as we used here, the performance levels of the classifiers are comparable between the 2 studies. Our results show that a 40-gene methylation profile accurately discriminates between 4 subtypes of BCP ALL and that additional CpG site methylation profiles of 2 to 43 genes discriminate between T-ALL and BCP ALL and between subgroups of BCP ALL in pairwise analyses. We observed that within subtypes, multiple genes have highly similar methylation patterns in an ALL subtype, although they are located on different chromosomes. This observation, combined with our finding of a strong inverse correlation between methylation and expression levels, is consistent with the formation of interchromosomal networks that are subject to joint epigenetic mechanisms regulating gene expression.43
Our findings should be confirmed in an independent patient cohort to explore methylation analysis as an instrument to refine subgrouping of ALL patients in the clinical setting. Although the expression levels of genes identified by genome-wide expression profiling have allowed construction of accurate classifiers for ALL subtypes,19 a great advantage of methylation analysis is that DNA, as a more stable molecule than RNA, is used as the analyte.44 Similar genotyping methods as those already in routine use for detection of point mutations in clinical laboratories can be used for the analysis of CpG site methylation. Further analysis of the differences in methylation patterns between subgroups of ALL in relation to high-resolution data on copy number alterations might also help to clarify whether changes in DNA methylation lead to large-scale translocations and rearrangements or are secondary to these chromosomal aberrations.45,46
Even more interesting is the potential use of DNA methylation analysis for stratification of patients with different clinical prognosis. We found that divisive hierarchical clustering of patients with the HeH karyotype defined a subgroup with increased risk for disease relapse. If confirmed, such data might be useful for stratification of patients to treatment protocols of different intensity. Hierarchical clustering of patients with t(12;21) also identified a group with increased risk of relapse but in a multivariate regression analysis subgrouping on the basis of DNA methylation did not have independent prognostic power. However, in an exploratory survey in which we used the methylation level of individual genes we identified additional genes for which the methylation levels correlated with risk for relapse in each of the main subgroups of ALL, including the t(12;21) and the T-ALL groups. The gene sets highlighted in both these approaches were partly overlapping, and for the majority of the genes high methylation levels correlated with favorable prognosis of the disease. In the future, methylation data for CpG sites in a selected number of genes might hopefully be used to design diagnostic tests to stratify ALL patients within subgroups.
Most of the genes with ASE that were highlighted as “classifier” or “predictor” genes in our study are novel with no previously reported connection with ALL, but we also identified some genes with previously reported roles in ALL. Our study confirmed previous results for the PCDHGA12, LRP1B, and PON3 genes that have been shown to have greater methylation levels in BCP ALL and T-ALL patients than in control patients.8,10 In our study these genes emerged in the gene set with favorable prognosis in BCP ALL and contributed to the distinction between ALL subtypes and between ALL cells and control cells. Among the genes that we identified as classifier genes by using methylation analysis, ARHGAP8, DSC3, FAT1, FXYD2, IGSF3, PCLO, and PON2 have been reported to have expression patterns that allow classification of ALL subtypes.18
Accordingly, we observed an inverse correlation between CpG site methylation and expression levels of these genes, with the exception of ARHGAP8. We found that high methylation levels of the tyrosine kinase ROR1, which is differentially expressed in BCP ALL subtypes,47 contributed to a lower probability of relapse in BCP ALL. The transcriptional regulator NOTCH3, for which high methylation levels contributed to a lower probability of relapse in t(12;21) ALL, is overexpressed in T-ALL cells and has been suggested to interact with IKZF1 (IKAROS) in the leukemogenesis of T-ALL.48 In our study the expression levels of ROR1 and NOTCH3 were also inversely correlated with methylation levels. In accordance with the important cellular functions of the proteins encoded by several of the genes highlighted in our study, some of them have been linked with other forms of cancer and hematologic diseases than ALL (see supplemental Table 6).
In conclusion, by analysis of the methylation patterns of CpG sites in 416 genes in a large number of samples from clinically well-characterized ALL patients, we found marked differences in methylation patterns between subgroups of patients. Even more intriguing was the finding of a correlation between the methylation level and clinical outcome within major subgroups of ALL patients, suggesting that methylation analysis should be explored as a method to improve stratification of patients. In the future, it will be important to analyze the biologic roles in ALL of the differentially methylated genes highlighted in our study.
The online version of this article contains a data supplement.
The publication costs of this article were defrayed in part by page charge payment. Therefore, and solely to indicate this fact, this article is hereby marked “advertisement” in accordance with 18 USC section 1734.
Acknowledgments
The ASE and methylation analyses were performed by the use of equipment at the SNP technology platform in Uppsala (http://www.genotyping.se) with the assistance of Torbjörn Öst and Marie Lindersson. We thank all colleagues in the Nordic Society of Pediatric Hematology and Oncology who provided the patient samples.
This work was supported by the Swedish Research Council for Science and Technology (to A.-C.S.), the Swedish Cancer Foundation (to A.-C.S.), the Swedish Childhood Cancer Foundation (to G.L., A.-C.S., A.K., and E.F.), the European Community FP7 (ENGAGE-project, contract 2007-201413; to A.-C.S.), the Knut and Alice Wallenberg Foundation (to the SNP technology platform), the Marcus Borgström and Anna Maria Lundin Foundations (to L.M.), the Nordic Center of Excellence in Disease Genetics (to A.K.), and the Danish Childhood Cancer Foundation (to K.S.). Kjeld Schmiegelow holds the Danish Childhood Cancer Foundation Research Professorship.
Authorship
Contribution: A.-C.S. initiated the study, supervised the research, and was the principal investigator for the major grants that funded the study; L.M. designed research; L.M. and A.L. performed the research; pediatric oncologists T.F., G.J., J.K., K.S., and S.S. provided phenotypic information and cells from the patients from their respective countries; A.L. performed the statistical analysis; J.N. performed validation experiments; L.M., A.L., and J.N. analyzed data; A.K. provided expertise on genetic analyses; M.H. provided clinical follow-up data from the Nordic ALL registry; E.F. oversaw the centralized review of karyotypes; M.G.G. provided theoretical insights and assisted in the multivariate data analysis; G.L. provided insights into the clinical aspects of ALL and assisted with the data analysis; and L.M., M.G.G., G.L., and A.-C.S. wrote the paper.
Conflict-of-interest disclosure: The authors declare no competing financial interests.
Correspondence: Ann-Christine Syvänen, Department of Medical Sciences, Uppsala University, 75185 Uppsala, Sweden; e-mail: ann-christine.syvanen@medsci.uu.se.
References
Author notes
L.M. and A.L. contributed equally to this study.
For the Nordic Society of Pediatric Hematology and Oncology.
Supplemental data
Supplemental figures can be found here.

