

Key Points
Initial FVIII exposure rate is the strongest predictor of immunogenicity after AAV-FVIII gene therapy in hemophilia A mice.
Slower initial FVIII exposure rates evolving to steady-state FVIII levels in the normal or higher range support immune tolerance.

Abstract
Advances in the development of novel treatment options for hemophilia A are prevalent. However, the anti–factor VIII (FVIII) neutralizing antibody (inhibitor) response to existing FVIII products remains a major treatment challenge. Although some novel products are designed to function in the presence of inhibitors, they do not specific address the immunogenicity risk or mechanistic causes of inhibitor development, which remain unclear. Furthermore, most preclinical studies supporting clinical gene therapy programs have reported immunogenicity signals in animal models, especially at higher vector doses and sometimes using multiple vector designs. In these settings, immunogenicity risk factor determination, comparative immunogenicity of competing vector designs, and the potential for obtaining meaningful prognostic data remain relatively unexplored. Additionally, there remains the opportunity to investigate clinical gene therapy as an alternative to standard immune tolerance induction therapy. The current study was designed to address these issues through longitudinal dose-response evaluation of 4 adeno-associated viral (AAV) vector candidates encoding 2 different FVIII transgenes in a murine model of hemophilia A. Plasma FVIII activity and anti-FVIII antibody data were used to generate a pharmacokinetic model that (1) identifies initial AAV-FVIII product expression kinetics as the dominant risk factor for inhibitor development, (2) predicts a therapeutic window where immune tolerance is achieved, and (3) demonstrates evidence of gene therapy–based immune tolerance induction. Although there are known limitations to the predictive value of preclinical immunogenicity testing, these studies can uncover or support the development of design principles that can guide the development of safe and effective genetic medicines.
Introduction
Hemophilia A, an X-linked, monogenic bleeding disorder resulting from defective or deficient coagulation factor VIII (FVIII), has one of the longest histories of gene transfer and transgene candidate development.1-7 Liver-directed adeno-associated viral (AAV) vector delivery is the most clinically advanced gene therapy approach for hemophilia A. These clinical programs are supported by numerous preclinical studies demonstrating effective and dose responsive in vivo gene transfer that generates predicably therapeutic elevations in plasma FVIII activity in multiple animal models including mice, rats, dogs, and nonhuman primates (NHPs; supplemental Table 1). A common aspect of these studies that remains ambiguous is the relevance of observed anti-FVIII immune responses. Comparative transgene product immunogenicity has not been studied in the same rigorous fashion as gene transfer efficiency and dose responsive FVIII production with multiparameter hypothesis-driven investigation. One explanation is the necessity of testing the exact clinical candidate vector, which typically includes a B-domain–deleted (BDD) human FVIII or a bioengineered variant thereof that represents a xenoprotein possessing neoantigens in nonmatched species. However, in the context of many cases of untreated severe hemophilia A and murine models of hemophilia A, all FVIII variants can be perceived as neoantigens. Furthermore, these murine models have been used extensively to study both basic mechanisms of the immune response to FVIII and perform preclinical comparative immunogenicity analyses.8,9
Advanced clinical AAV-FVIII gene therapy trials have enrolled adult subjects with extensive prior FVIII product exposure and no history of inhibitors. Inhibitor development has not been observed as an adverse event despite utilization of AAV-FVIII doses as high as 6E13 vector genomes (vg)/kg. However, administration of similar doses to normal NHP (expressing endogenous NHP FVIII) has resulted in rapid and potent inhibitory immune responses, whereas some lower-dose studies appear to avoid such immune responses (supplemental Table 1).10-14 Data from other preclinical AAV gene therapy studies also suggest a dose and/or FVIII expression–related immunogenicity threshold (supplemental Table 1).11,15 -19 It has also been proposed that FVIII dosing intensity and dosing intervals may play a role in the risk of inhibitor development vs. establishing and maintaining FVIII immune tolerance in non–gene therapy settings.20-22 Therefore, an accumulating body of data in both preclinical and clinical settings suggests that FVIII exposure intensity may be a critical factor governing immunogenicity. In the setting of gene therapy, several independent variables including both vector dose and vector design elements are predicted to influence FVIII exposure intensity. For example, BDD appears to support higher steady-state mRNA levels, whereas codon optimization, which has become ubiquitous in gene therapy transgene design, is thought to influence both mRNA levels and translation rates. Furthermore, variants such as BDD porcine FVIII, ET3, X10, N6, V3, and R1645H possess amino acid sequence changes that affect biosynthetic efficiency and/or specific activity.10,13,18,23 -28 In addition to transgene design, synthetic promoter/enhancer elements could affect comparative immunogenicity via effects on FVIII expression level or FVIII expressing cell type, which is affected by both vector tropism (eg, AAV serotype) and promoter specificity for a given transduced cell type.15,19,29 -34 Finally, natural and recombinant AAV particles are immunogenic in humans and higher AAV capsid loads can induce cellular stress and creation of a proinflammatory microenvironment in the target organ that alters the immunogenicity risk of the transgene product.11,30-32,35
The goal of the current study is to identify the critical determinant(s) of FVIII immunogenicity in the setting of liver-directed AAV gene therapy using a multivariable pharmacokinetic approach. Pharmacokinetic/pharmacodynamic (PK/PD) analysis of AAV gene therapy is very complex. There are multiple exposure and elimination rate constants, beginning with vector administration and clearance, and then many intermediate intracellular processing steps before transgene product biosynthesis, secretion, distribution, metabolism, and elimination, all occurring in the context of a second form of elimination involving transduced cell turnover.33,36 Although no complete PK model exists for AAV gene therapy, it can be reduced to apparent PK of the transgene product detectable in plasma and modeled as a continuous intravenous infusion where transgene product production is expressed as a rate (eg, FVIII IU/day) that operates at a pseudo-steady state. Therefore, this approach should be translatable to any gene therapy that functions through endogenous production and secretion of a therapeutic transgene product. Although there are clearly established limitations to preclinical immunogenicity studies involving candidate therapies that can be typically classified as xenoproteins in the preclinical models used, at least in the setting of hemophilia A and FVIII, the murine hemophilia A model has demonstrated many parallels with the human immune response to FVIII and is used in almost all preclinical product development programs and basic immunology studies of FVIII. Furthermore, in the context of comparative immunogenicity between different recombinant protein candidates or gene therapy candidates with varying vector designs or dose levels, preclinical models have proven informative (supplemental Table 1).9 ,,,,,,,,-19,23,25 ,-28,37 ,,,,,,,,,,,,, -53 Furthermore, aside from immunogenicity resulting from neoepitopes present in xenoproteins, there may be inherent biochemical properties conserved across FVIII variants that impact overall immunogenicity.
Methods
Materials
All studies were performed under the guidelines set by the Emory University Institutional Animal Care and Use Committee. All experiments were initiated in FVIII-naïve, male exon 16–disrupted hemophilia A mice back-crossed onto a C57BL/6 background (age, 8-12 weeks).54 AAV vector plasmids containing either the HCB or E06.TTR promoter with the HSQ or ET3 FVIII gene15,18,23,37 were provided to Vigene Biosciences for AAV8 vector production and titration. ET3i protein was produced and purified in-house.9
AAV-FVIII dose-response
All required animals were prerandomized into the vector/dose groups and entered the study via rolling enrollment in cohorts of 14 to 20. After AAV-FVIII administration, blood was collected for plasma FVIII assays every 5 days for the first 35 days, weekly for weeks 6 to 8, every 2 weeks through week 16, and every 4 weeks thereafter.
ET3i protein challenge
Animals administered AAV-ET3 vectors that did not develop inhibitors after a minimum of 37 weeks and maximum of 42 weeks were challenged with ET3 protein (ET3i). Animals were grouped before challenge according to steady-state FVIII activity levels, with 1 no-challenge control per group. FVIII-naïve animals (n = 4) were challenged alongside the AAV-ET3–treated animals. Animals were administered 1 µg ET3i (diluted in sterile phosphate-buffered saline) via retro-orbital sinus injection once per week for 5 weeks, and blood was collected 3 days after each injection. Two additional samples were taken at weeks 6 and 7. Animals received a 1-µg ET3i booster injection 5 weeks after conclusion of the challenge course and were sacrificed 4 days later.
Plasma FVIII assays
FVIII activity was measured via Chromogenix Coatest SP4 Factor VIII chromogenic assay following the manufacturer’s instructions (Diapharma). ET3i antigen was measured by enzyme-linked immunosorbent assay (ELISA) targeting the human sequence regions. As previously described, anti-FVIII immunoglobulin G (IgG) titers were determined by ELISA,8 and FVIII inhibitor titers were determined by Bethesda assay,55 with the modification that Bethesda titers were binned into a range based on dilutions that yielded a residual FVIII activity between 40% and 60%.
Vector copy number
DNA was extracted from flash-frozen liver tissue at sacrifice, and vector copy number was quantified by quantitative polymerase chain reaction (qPCR) using primers specific to liver codon-optimized ET3 and SYBR green master mix on the PrimePro48 PCR System (TECHNE).
Statistics
Data were analyzed using GraphPad Prism and Microsoft Excel software. Significance level for all statistical comparisons was set at P ≤ .05.
Results
Correlation of vector potency and dose with initial FVIII exposure kinetics and steady-state levels
The current study was designed to elucidate the dominant factors governing the immune response to FVIII in the setting of liver-directed AAV-FVIII gene therapy in immunocompetent, but FVIII-naïve, hemophilia A mice. The independent variables included the promoter sequence, FVIII transgene sequence, and AAV vector dose. Four AAV vector designs were evaluated, pairing 2 synthetic liver-directed promoters with 2 FVIII transgenes in a modular fashion within an AAV2 ITR/AAV8 capsid vector (Figure 1A). The HCB promoter, designed and characterized by our group,23 is shorter and less potent than the E06.TTR promoter, which has shown immunogenicity signals in a study comparing multiple promoter/enhancer sequences.15 The transgene sequences are as follows: (1) human BDD FVIII with the SQ linker (referred to as HSQ), similar to AAV gene therapy candidates currently in clinical trials, and (2) ET3, a bioengineered BDD FVIII previously described by our group and colleagues and used in multiple open investigational new drug gene therapy programs.18,37,56 ET3 has been shown to display higher biosynthetic efficiency than HSQ because of decreased engagement of the unfolded protein response, leading to enhanced secretion.24 The resulting vectors have different predicted potencies: AAV-E06.TTR-ET3 > AAV-HCB-ET3 > AAV-E06.TTR-HSQ > AAV-HCB-HSQ. Uncertainty associated with AAV-FVIII immunogenicity results from a shortage of preclinical study designs with frequent, early sampling and long-term follow-up after vector delivery. These data are essential for robust PK/PD analyses, evaluating immunogenicity risk, and observing the durability of FVIII expression. Therefore, vectors were delivered at 1 of 6 doses, starting at 6E13 vg/kg with threefold dilutions to 2.46E11 vg/kg, and animals were followed for up to 43 to 53 weeks, with a higher frequency of plasma sampling within the first 16 weeks (Figure 1B-C). Although the effect between doses was significant, there was no significant difference in terminal liver AAV vector genome copy number (VCN) observed between the 4 vectors within a single dose group (Figure 1D). However, for vector/dose combinations inducing rapid increases to supraphysiologic FVIII activity levels, FVIII activity subsequently declined to baseline in a time frame directly correlated with time to peak activity (Figure 1E-H), suggesting either a cytotoxic or humoral immune response to transduced cells or the transgene product, respectively. Observed vector dose dependence on VCN suggests the latter. In accordance with the potency of each vector, there appeared to be a dose level below which FVIII activity levels achieved a pseudo-steady state that was maintained in most animals for the duration of the study.

AAV-FVIII gene therapy dose-response study relates vector design (potency) and dose to initial FVIII exposure kinetics, steady-state levels, and time to loss of FVIII activity. (A) This design schematic depicts the 4 vectors administered to male exon 16–disrupted hemophilia A mice. (B) AAV-FVIII infusion was followed by longitudinal plasma collections and an ET3i protein challenge course for a subset of the AAV-ET3–treated animals. (C) Vectors were administered at threefold dose intervals within the range indicated in the table and ranked based on relative predicted potency. The median FVIII activity over time is shown graphically for the 6E13 vg/kg dose of each vector (ET3 transgene, red lines; HSQ transgene, blue lines; E06 promoter, solid lines; HCB promoter, dashed lines). (D) Terminal VCN was quantified by qPCR on liver DNA (E06.TTR-ET3, red circles; HCB-ET3, red squares; E06.TTR-HSQ, blue upwards triangle; HCB-HSQ, blue downwards triangle). Data points represent the median VCN, and error bars indicate the interquartile range (IQR). Values below the red dashed line indicate undetectable VCN. The dose factor (P = .0004) and vector design factor (P = .0198) are significant, with only the E06.TTR-ET3 vs HCB-HSQ vector design comparison showing significance (P = .0158; main effects 2-way ANOVA with Tukey’s multiple comparisons). There is no difference between the vectors when comparing median VCN values within each individual vg/kg dose group. (E-H) These graphs profile the median FVIII activity (IU/mL) over time for each dose administered of AAV-E06.TTR-ET3 (E) and AAV-HCB-ET3 (F), AAV-E06.TTR-HSQ (G), or AAV-HCB-HSQ (H), with resulting FVIII levels color coded according to vector dose. FVIII activity (IU/mL) was measured by chromogenic plate assay for all samples assayed in this study. (C,E-H) IQR error bars were removed for visual clarity but are shown for all vectors in supplemental Figures 1 and 2.
AAV-FVIII gene therapy dose-response study relates vector design (potency) and dose to initial FVIII exposure kinetics, steady-state levels, and time to loss of FVIII activity. (A) This design schematic depicts the 4 vectors administered to male exon 16–disrupted hemophilia A mice. (B) AAV-FVIII infusion was followed by longitudinal plasma collections and an ET3i protein challenge course for a subset of the AAV-ET3–treated animals. (C) Vectors were administered at threefold dose intervals within the range indicated in the table and ranked based on relative predicted potency. The median FVIII activity over time is shown graphically for the 6E13 vg/kg dose of each vector (ET3 transgene, red lines; HSQ transgene, blue lines; E06 promoter, solid lines; HCB promoter, dashed lines). (D) Terminal VCN was quantified by qPCR on liver DNA (E06.TTR-ET3, red circles; HCB-ET3, red squares; E06.TTR-HSQ, blue upwards triangle; HCB-HSQ, blue downwards triangle). Data points represent the median VCN, and error bars indicate the interquartile range (IQR). Values below the red dashed line indicate undetectable VCN. The dose factor (P = .0004) and vector design factor (P = .0198) are significant, with only the E06.TTR-ET3 vs HCB-HSQ vector design comparison showing significance (P = .0158; main effects 2-way ANOVA with Tukey’s multiple comparisons). There is no difference between the vectors when comparing median VCN values within each individual vg/kg dose group. (E-H) These graphs profile the median FVIII activity (IU/mL) over time for each dose administered of AAV-E06.TTR-ET3 (E) and AAV-HCB-ET3 (F), AAV-E06.TTR-HSQ (G), or AAV-HCB-HSQ (H), with resulting FVIII levels color coded according to vector dose. FVIII activity (IU/mL) was measured by chromogenic plate assay for all samples assayed in this study. (C,E-H) IQR error bars were removed for visual clarity but are shown for all vectors in supplemental Figures 1 and 2.
Normal human circulating FVIII levels are clinically defined as 1 IU/mL, or approximately 200 ng/mL. An ideal gene therapy would maintain FVIII levels around 1 IU/mL without major peaks and troughs. Animals administered 6E13 vg/kg AAV-E06.TTR-ET3 reached peak, supraphysiologic FVIII activity by day 5 (5.4-7.2 IU/mL) that then dropped to undetectable levels by day 15 (Figure 2A). At 2E13 vg/kg, FVIII levels peaked at day 10 (2.3-6.4 IU/mL) and became undetectable between days 30 and 35 (Figure 2B). One animal in each of these groups spontaneously recovered FVIII activity, but this occurred much later for the 6E13 vg/kg–dosed animal (>250 days) than for the 2E13 vg/kg–dosed animal (>70 days). Vector potency and dose effects were more complex at the mid-range 6.67E12 and 2.22E12 vg/kg doses. Animals administered 6.67E12 vg/kg peaked at 3.8 to 6.1 IU/mL FVIII between days 10 and 20, and activity began to drop by the next time point. However, all 4 animals proceeded to unique outcomes (Figure 2C). Animal 1457B most likely lost AAV-ET3 genetically modified cells, as it had the highest initial FVIII activity in its group but was the only animal to lose both activity (week 32) and liver VCN. At 2.22E12 vg/kg, FVIII levels peaked by day 30 (1.3-2.7 IU/mL) and held steady with fluctuations within ∼1 IU/mL for 3 animals, whereas animal 1437N lost FVIII activity after 16 weeks (Figure 2D). Most animals administered lower doses maintained FVIII activity within the hemophilia range (<1%-50% of normal, <0.01-0.5 IU/mL; Figure 2E-F). The animals administered AAV-HCB-ET3 followed a similar dose-response pattern, except that the FVIII activity profiles shifted in accordance with the lower vector potency ranking (Figure 2G-J). The complete data presented a clear trend toward correlation of vector potency and dose with increased risk of FVIII activity loss. Similar dose-response trends after administration of the less potent HSQ-expressing vectors are shown in supplemental Figure 3.
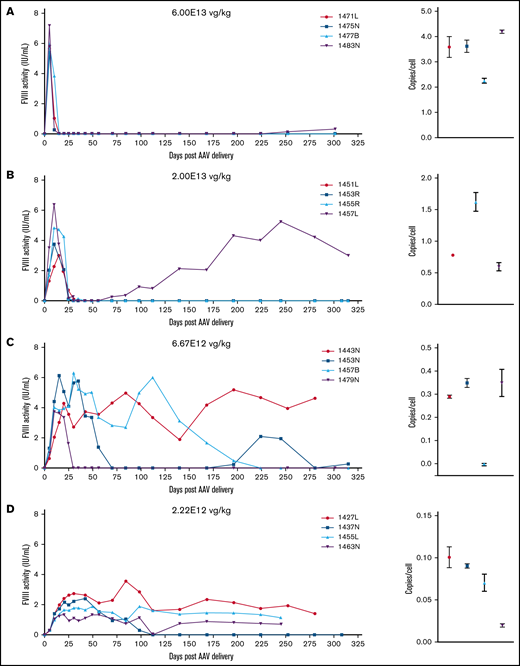


FVIII activity profiles and terminal VCN for individual animals administered an AAV-ET3 vector. Panels display FVIII activity over time and terminal VCN after administration of AAV-E06.TTR-ET3 (A-F) or AAV-HCB-ET3 (G-J). Each panel represents 1 vector/dose group, and each curve represents a single animal. Terminal VCN was quantified by qPCR on liver DNA. FVIII activity profiles for individual animals administered the AAV-HSQ vectors are shown in supplemental Figure 3.
FVIII activity profiles and terminal VCN for individual animals administered an AAV-ET3 vector. Panels display FVIII activity over time and terminal VCN after administration of AAV-E06.TTR-ET3 (A-F) or AAV-HCB-ET3 (G-J). Each panel represents 1 vector/dose group, and each curve represents a single animal. Terminal VCN was quantified by qPCR on liver DNA. FVIII activity profiles for individual animals administered the AAV-HSQ vectors are shown in supplemental Figure 3.
Inhibitor response after AAV-FVIII
To confirm that the rapid decline in FVIII activity observed in animals initially expressing high FVIII levels resulted from a neutralizing humoral immune response, both total anti-FVIII IgG and functional clot inhibition were measured. All animals that developed a FVIII inhibitor response after AAV-FVIII delivery are highlighted in Figure 3. Animals produced anti-FVIII IgG after treatment with the AAV-E06.TTR-ET3, AAV-HCB-ET3, and AAV-E06.TTR-HSQ vectors but not the least potent AAV-HCB-HSQ vector. The 6E13-vg/kg dose of AAV-E06.TTR-ET3 (Figure 3A) and AAV-HCB-ET3 (Figure 3E) resulted in a 100% inhibitor incidence rate, wherein detectable IgG titers appeared at 15 days after AAV-E06.TTR-ET3 and 20 to 30 days after AAV-HCB-ET3 delivery. In agreement with the vector potency and dose-response trends, AAV-E06.TTR-ET3 dosed at 2E13 vg/kg (Figure 3B) produced an IgG response similar to that of AAV-HCB-ET3 dosed threefold higher at 6E13 vg/kg (Figure 3E), whereas 2E13 vg/kg AAV-HCB-ET3 (Figure 3F) produced an IgG response more similar to AAV-E06.TTR-ET3 dosed threefold lower at 6.67E12 vg/kg (Figure 3C; 6E13vg/kg AAV-E06.TTR-ET3 > 6E13vg/kg AAV-HCB-ET3 ≈ 2E13vg/kg AAV-E06.TTR-ET3 > 2E13vg/kg AAV-HCB-ET3 ≈ 6.67E12vg/kg AAV-E06.TTR-ET3, comparing IgG titer incidence). The only animal to develop inhibitors after a 2.22E12-vg/kg dose was administered the most potent AAV-E06.TTR-ET3 vector (Figure 3D). No other animals administered ≤ 2.22E12 vg/kg of any of the 4 vectors developed inhibitors. Animal 1457B did not show detectable IgG or Bethesda titers throughout the study, further supporting the conclusion that this animal lost genetically modified cells. AAV-E06.TTR-HSQ dosed at 6E13 vg/kg (Figure 3G) also displayed a 100% inhibitor incidence rate. However, the FVIII expression kinetics were slower, with a larger total exposure before the emergence of an anti-FVIII IgG titer compared with 6E13 vg/kg of AAV-E06.TTR-ET3 (Figure 3A) or AAV-HCB-ET3 (Figure 3E). No animals administered ≤2E13 vg/kg AAV-E06.TTR-HSQ developed inhibitors within the study time frame. For all AAV-FVIII–treated animals that developed inhibitors, the FVIII activity began to decrease before the IgG titers were quantifiable, with little to no overlap in codetectable FVIII activity and IgG titer at the time points assayed. Additionally, IgG titers uniformly appeared before measurable Bethesda titers and, in cases where the inhibitor response resolved spontaneously, the Bethesda titer abated before the IgG titer.


Anti-FVIII antibody response after AAV-FVIII delivery can be complex and multiphasic. The anti-FVIII IgG titers were measured by ELISA. IgG titers are indicated by the red curve and quantified on the right y axis. The corresponding FVIII activity levels are indicated by the black curve and quantified on the left y axis. Bethesda (inhibitor) titers (BU/mL) were measured for every sample with a detectable IgG titer and/or loss of detectable FVIII activity. BU/mL values are indicated by a heat map at the top of each graph. Samples below the limit of quantification for any antibody assay were given a working value of 0 in data analysis and graphical representation; however, the actual value could be somewhere between 0 and the limit of quantification. An X terminating the IgG titer curve denotes death of the animal at the designated time point. (A) 6E13vg/kg AAV-E06.TTR-ET3. Animal IDs: (i) 1471L, (ii) 1475N, (iii) 1477B, (iv) 1483N. (B) 2E13vg/kg AAV-E06.TTR-ET3. Animal IDs: (i) 1451L, (ii) 1453R, (iii) 1455R, (iv) 1457L. (C) 6.67E12vg/kg AAV-E06.TTR-ET3. Animal IDs: (i) 1453N, (ii) 1479N. (D) 2.22E12vg/kg AAV-E06.TTR-ET3, animal 1437N. (E) 6E13vg/kg AAV-HCB-ET3. Animal IDs: (i) 1437R, (ii) 1451R, (iii) 1453LL, (iv) 1479L. (F) 2E13vg/kg AAV-HCB-ET3. Animal IDs: (i) 1437L, (ii) 1455N. (G) 6E13vg/kg AAV-E06.TTR-HSQ. Animal IDs: (i) 1475B, (ii) 1481B, (iii) 1507R.
Anti-FVIII antibody response after AAV-FVIII delivery can be complex and multiphasic. The anti-FVIII IgG titers were measured by ELISA. IgG titers are indicated by the red curve and quantified on the right y axis. The corresponding FVIII activity levels are indicated by the black curve and quantified on the left y axis. Bethesda (inhibitor) titers (BU/mL) were measured for every sample with a detectable IgG titer and/or loss of detectable FVIII activity. BU/mL values are indicated by a heat map at the top of each graph. Samples below the limit of quantification for any antibody assay were given a working value of 0 in data analysis and graphical representation; however, the actual value could be somewhere between 0 and the limit of quantification. An X terminating the IgG titer curve denotes death of the animal at the designated time point. (A) 6E13vg/kg AAV-E06.TTR-ET3. Animal IDs: (i) 1471L, (ii) 1475N, (iii) 1477B, (iv) 1483N. (B) 2E13vg/kg AAV-E06.TTR-ET3. Animal IDs: (i) 1451L, (ii) 1453R, (iii) 1455R, (iv) 1457L. (C) 6.67E12vg/kg AAV-E06.TTR-ET3. Animal IDs: (i) 1453N, (ii) 1479N. (D) 2.22E12vg/kg AAV-E06.TTR-ET3, animal 1437N. (E) 6E13vg/kg AAV-HCB-ET3. Animal IDs: (i) 1437R, (ii) 1451R, (iii) 1453LL, (iv) 1479L. (F) 2E13vg/kg AAV-HCB-ET3. Animal IDs: (i) 1437L, (ii) 1455N. (G) 6E13vg/kg AAV-E06.TTR-HSQ. Animal IDs: (i) 1475B, (ii) 1481B, (iii) 1507R.
Among the animals that developed inhibitors, 4 of 20 displayed FVIII activity reemergence (Figure 3Aiv, Biv, Ci, Eiii). Generally, these animals had the highest peak FVIII activity in their vector/dose group but generated lower measurable IgG and Bethesda titers. The 2 animals with peak IgG titers <5000 and Bethesda titers <50 BU/mL recovered FVIII activity earlier (Figure 3Biv, Eiii; recovery within 6 weeks after AAV-FVIII delivery) than the animals with IgG titers >5000 and more sustained Bethesda titers >50 BU/mL (Figure 3Aiv, Ci; recovery after ≥16 weeks). In all inhibitor responses, the IgG titer fluctuated substantially and as much as 2 logs between plasma collections. These data suggest that the nature of the sustained anti-FVIII immune response is complex and possibly dependent on multiple immunologic mechanisms.
PK analysis defines an immunogenicity threshold
![Pharmacokinetic model of plasma FVIII exposure after AAV-FVIII delivery defines an immunogenicity threshold. (A) These graphs display the FVIII production (or exposure) rate, kFVIII, and the corresponding cumulative FVIII exposure, AUCFVIII, for each AAV-FVIII–treated animal through day 15 (n = 66). Red curves represent animals that developed an inhibitor response, and black curves represent the animals that did not develop inhibitors. The proposed immunogenicity threshold is outlined in blue and was determined by linear regression with shared parameters. (B) ID50 values were calculated by simple logistic regression analysis (ID50 = the value predicted to induce inhibitor development in 50% of AAV-FVIII–treated subjects): (i) day 5 kFVIII, (ii) day 10 kFVIII, (iii) day 5 AUCFVIII, (iv) day 10 AUCFVIII (likelihood ratio test [LRT] of the β1 variable was set at P < .05 for significance and brackets indicate the 95% CI). (C) Contingency analysis was performed based on the inhibitor incidence (count) of animals that met the kFVIII threshold by day 10 (2-sided Fisher’s exact test with significance set at P < .05; brackets indicate 95% CI; ARI, attributable risk increase; RR, risk ratio). (D) Survival curve indicates occurrence of inhibitors for animals with day 5 kFVIII values ≥ ID50 compared with those below the ID50. The median time to inhibitors with kFVIII ≥ 4.49 = 30 days. (χ2 = 66.95, df = 1, P < .0001). (E) Correlation of day 5 kFVIII values with the time to anti-FVIII IgG incidence. (Spearman r = −0.7333; 95% CI, −0.8907, −0.4189; P = .0002). (F) Median day 5 kFVIII values by vector dose for each AAV-FVIII vector. Error bars indicate IQR. Values below the red dashed line indicate a day 5 kFVIII = 0, meaning that there was no detectable FVIII activity by chromogenic assay 5 days after vector delivery. Both the vector design and dose factors have a significant impact on the day 5 kFVIII (main effects 2-way ANOVA, P < .0001).](https://ash.silverchair-cdn.com/ash/content_public/journal/bloodadvances/6/8/10.1182_bloodadvances.2021006359/4/m_advancesadv2021006359f4.png?Expires=1767724843&Signature=q4HDeeN8CKrIsPY9dVxGlA2cJOvriN0x8rIQZ9tCygnEihUTsvyfUtOwUircb0kbOBpPWUYxA5y3ntrBypguRPaBxEXSxSVy396jHvUc-N-javI6V7Mk18FTrEViceuz-LrlQJ7yjkIi0rzZjj13P6iwXUjTc~jCngLm3I14BGECOyEXd9MW6A6V0JLPEhYNQRqVDicAEB6I5jdjUxsK9VHkYT1aER3SnZRZGKmhRJjYrr2i4T3jJwpyYj-leMXzqDezFUYX2RGk-8zYevapsE3ARvRfCBuL94j5HWyys45C9fEOWS3-uP7Se5r1AQf4jsymuPcEmCy5FRwAoPQ2PQ__&Key-Pair-Id=APKAIE5G5CRDK6RD3PGA)
Pharmacokinetic model of plasma FVIII exposure after AAV-FVIII delivery defines an immunogenicity threshold. (A) These graphs display the FVIII production (or exposure) rate, kFVIII, and the corresponding cumulative FVIII exposure, AUCFVIII, for each AAV-FVIII–treated animal through day 15 (n = 66). Red curves represent animals that developed an inhibitor response, and black curves represent the animals that did not develop inhibitors. The proposed immunogenicity threshold is outlined in blue and was determined by linear regression with shared parameters. (B) ID50 values were calculated by simple logistic regression analysis (ID50 = the value predicted to induce inhibitor development in 50% of AAV-FVIII–treated subjects): (i) day 5 kFVIII, (ii) day 10 kFVIII, (iii) day 5 AUCFVIII, (iv) day 10 AUCFVIII (likelihood ratio test [LRT] of the β1 variable was set at P < .05 for significance and brackets indicate the 95% CI). (C) Contingency analysis was performed based on the inhibitor incidence (count) of animals that met the kFVIII threshold by day 10 (2-sided Fisher’s exact test with significance set at P < .05; brackets indicate 95% CI; ARI, attributable risk increase; RR, risk ratio). (D) Survival curve indicates occurrence of inhibitors for animals with day 5 kFVIII values ≥ ID50 compared with those below the ID50. The median time to inhibitors with kFVIII ≥ 4.49 = 30 days. (χ2 = 66.95, df = 1, P < .0001). (E) Correlation of day 5 kFVIII values with the time to anti-FVIII IgG incidence. (Spearman r = −0.7333; 95% CI, −0.8907, −0.4189; P = .0002). (F) Median day 5 kFVIII values by vector dose for each AAV-FVIII vector. Error bars indicate IQR. Values below the red dashed line indicate a day 5 kFVIII = 0, meaning that there was no detectable FVIII activity by chromogenic assay 5 days after vector delivery. Both the vector design and dose factors have a significant impact on the day 5 kFVIII (main effects 2-way ANOVA, P < .0001).
Pharmacokinetic model of plasma FVIII exposure after AAV-FVIII delivery defines an immunogenicity threshold. (A) These graphs display the FVIII production (or exposure) rate, kFVIII, and the corresponding cumulative FVIII exposure, AUCFVIII, for each AAV-FVIII–treated animal through day 15 (n = 66). Red curves represent animals that developed an inhibitor response, and black curves represent the animals that did not develop inhibitors. The proposed immunogenicity threshold is outlined in blue and was determined by linear regression with shared parameters. (B) ID50 values were calculated by simple logistic regression analysis (ID50 = the value predicted to induce inhibitor development in 50% of AAV-FVIII–treated subjects): (i) day 5 kFVIII, (ii) day 10 kFVIII, (iii) day 5 AUCFVIII, (iv) day 10 AUCFVIII (likelihood ratio test [LRT] of the β1 variable was set at P < .05 for significance and brackets indicate the 95% CI). (C) Contingency analysis was performed based on the inhibitor incidence (count) of animals that met the kFVIII threshold by day 10 (2-sided Fisher’s exact test with significance set at P < .05; brackets indicate 95% CI; ARI, attributable risk increase; RR, risk ratio). (D) Survival curve indicates occurrence of inhibitors for animals with day 5 kFVIII values ≥ ID50 compared with those below the ID50. The median time to inhibitors with kFVIII ≥ 4.49 = 30 days. (χ2 = 66.95, df = 1, P < .0001). (E) Correlation of day 5 kFVIII values with the time to anti-FVIII IgG incidence. (Spearman r = −0.7333; 95% CI, −0.8907, −0.4189; P = .0002). (F) Median day 5 kFVIII values by vector dose for each AAV-FVIII vector. Error bars indicate IQR. Values below the red dashed line indicate a day 5 kFVIII = 0, meaning that there was no detectable FVIII activity by chromogenic assay 5 days after vector delivery. Both the vector design and dose factors have a significant impact on the day 5 kFVIII (main effects 2-way ANOVA, P < .0001).
FVIII activity becomes immeasurable once inhibitors develop. However, the data clearly suggest the primary importance of initial FVIII exposure kinetics for determining inhibitor incidence. Because the goal was to create a model that can guide AAV gene therapy design and dosing parameters with the greatest possibility of avoiding inhibitor induction, data through day 10 were included in the risk assessments (through day 5 for the 5 animals whose FVIII activity decreased at day 10, preceding an inhibitor titer). The PK model detailed in Figure 4 compiles data from all animals administered any dose of the 4 AAV-FVIII vectors evaluated in this study. The resulting immunogenicity threshold was demarcated by a daily increase in kFVIII of ∼1 IU/day and an AUCFVIII of 50 IU over the first 10 days (Figure 4A). Logistic regression analysis of kFVIII and AUCFVIII at days 5 and 10 demonstrates the significance of these threshold values (Figure 4B). However, day 5 kFVIII emerged as the strongest indicator of inhibitor incidence (β1 = 3.2; 95% confidence interval [CI], 1.860, 8.818; likelihood ratio test, P < .0001). The 50% inhibitor development values (ID50) also validate the FVIII immunogenicity threshold (day 5 kFVIII ID50 = 4.49 IU/day; day 10 kFVIII ID50 = 11.12 IU/day; day 5 AUCFVIII = 11.22 IU; day 10 AUCFVIII = 50.22 IU). Risk assessment by Fisher’s exact test reports an attributable risk increase of 0.9065 (95% CI, 0.6579, 0.9660; P < .0001) and a risk ratio of 21.85 (95% CI, 6.500, 79.35; P < .0001) for inhibitor incidence when the kFVIII threshold is met by day 10 (Figure 4C). The number of animals in each vector/dose group that developed inhibitors after AAV-FVIII administration is shown in supplemental Table 3. Contingency analysis of inhibitor proportions shows a significant immunogenicity benefit for animals with day 5 kFVIII < ID50 (Figure 4D; P < .0001; median time to inhibitors with kFVIII ≥ 4.49 = 30 days). There is also a significant inverse correlation between the day 5 kFVIII and time to anti-FVIII IgG incidence (Figure 4E; rs = −0.7333; 95% CI, −0.8907, −0.4189; P < .0002). As expected, both vector design (ie, potency) and dose have a significant effect on day 5 kFVIII values (Figure 4F; 2-way analysis of variance [ANOVA]; dose factor = 65.56; vector factor = 18.76; P < .0001 for both factors).
ET3i challenge after AAV-ET3
To test whether AAV-ET3–treated animals that did not develop inhibitors within 37 to 42 weeks may have developed immune tolerance or nonresponsiveness to ET3, animals were challenged with 5 weekly injections of 1 µg ET3i (purified recombinant ET3 protein; Figure 5A). In AAV-ET3–treated animals with low steady-state FVIII levels (<0.7 IU/mL), responses were more similar to those of FVIII-naïve challenge animals, with inhibitors developing between the third and fifth challenge. Animals making ≥2 IU/mL were resistant to challenge. Inhibitor incidence results were mixed in animals making between ∼0.7 and 2 IU/mL before challenge. Although initial FVIII exposure kinetics appear to be the primary predictor of FVIII inhibitor incidence after AAV-FVIII, achieving steady-state levels of ∼1.5 to 4.5 IU/mL increased the probability of developing an immunologic state of nonresponsiveness to the exogenous FVIII (Figure 5B; supplemental Table 4). These parameters outline an AAV-FVIII therapeutic window in which immunogenicity risk is lower and the probability of maintaining FVIII efficacy and immune tolerance is higher (Figure 5C).

ET3i protein challenge in AAV-ET3–treated animals suggests a therapeutic window for AAV-FVIII treatment. (A) Animals treated with either AAV-E06.TTR-ET3 or AAV-HCB-ET3 that did not develop inhibitors by 37 to 42 weeks were challenged with 5 weekly infusions of 1 μg purified ET3i protein. Animals were ranked based on prechallenge FVIII activity, and 1 animal per rank group served as a no challenge control. Naïve hemophilia A animals were immunized alongside the gene therapy–treated animals. Plasma was collected 3 days after every injection and at weeks 6 and 7 after challenge initiation. An additional 1ug ET3i was administered 3 days before sacrifice. (B) Steady-state FVIII activity before ET3i challenge vs. the IgG titer at time of sacrifice in ET3i-challenged animals. The following animals were resistant to challenge: 1433L, 1437LL, 1443N, 1443L, 1455LL, and 1463N. (C) Target AAV-FVIII dose window based on initial FVIII exposure kinetics and steady-state levels relative to thresholds for therapeutic efficacy and immunogenicity to mitigate the risks associated with FVIII levels significantly outside of the normal range. The “minimum effective dose” indicates the minimum dose at which durable and therapeutic steady-state FVIII levels are expected. The “immunogenicity threshold” is determined from the pharmacokinetic model described herein.
ET3i protein challenge in AAV-ET3–treated animals suggests a therapeutic window for AAV-FVIII treatment. (A) Animals treated with either AAV-E06.TTR-ET3 or AAV-HCB-ET3 that did not develop inhibitors by 37 to 42 weeks were challenged with 5 weekly infusions of 1 μg purified ET3i protein. Animals were ranked based on prechallenge FVIII activity, and 1 animal per rank group served as a no challenge control. Naïve hemophilia A animals were immunized alongside the gene therapy–treated animals. Plasma was collected 3 days after every injection and at weeks 6 and 7 after challenge initiation. An additional 1ug ET3i was administered 3 days before sacrifice. (B) Steady-state FVIII activity before ET3i challenge vs. the IgG titer at time of sacrifice in ET3i-challenged animals. The following animals were resistant to challenge: 1433L, 1437LL, 1443N, 1443L, 1455LL, and 1463N. (C) Target AAV-FVIII dose window based on initial FVIII exposure kinetics and steady-state levels relative to thresholds for therapeutic efficacy and immunogenicity to mitigate the risks associated with FVIII levels significantly outside of the normal range. The “minimum effective dose” indicates the minimum dose at which durable and therapeutic steady-state FVIII levels are expected. The “immunogenicity threshold” is determined from the pharmacokinetic model described herein.
ET3 antigen and in vivo–specific activity after AAV-ET3
The inability to accurately quantify FVIII antigen in the presence of anti-FVIII–neutralizing antibodies is an obstacle to in vivo investigation of immunologic mechanisms involved in the FVIII inhibitor response after gene therapy. The ability to detect ET3 antigen and evaluate in vivo ET3 specific activity after gene therapy was evaluated by compiling all FVIII activity and ET3 antigen data quantified in animals administered any evaluated dose of the 2 AAV-ET3 vectors. The earliest time point when FVIII activity decreased in AAV-FVIII–treated animals that developed inhibitors was day 10. Therefore, ET3 antigen could be reliably quantified on day 5, and those antigen levels (ng/mL) were significantly higher in animals that proceeded to develop inhibitors (Figure 6A; P = .0008). However, when day 5 antigen levels were plotted against day 5 FVIII activity values, the difference in the in vivo ET3 specific activity (IU/mg) between the 2 groups was insignificant, further indicating that the detectable ET3 antigen was fully active and not yet subject to significant inhibition (Figure 6B). The in vivo ET3 specific activity calculated from all AAV-ET3–treated animals that did not develop inhibitors (before ET3i challenge) was 9400 IU/mg (Figure 6C; r2 = 0.804). Although in vivo ET3-specific activity fluctuates over time in AAV-ET3–treated animals, values >13 000 IU/mg were calculated (supplemental Figure 4D), which is consistent with previously determined in vitro and in vivo ET3i-specific activities.9,18 ET3 antigen was detectable in AAV-ET3–treated animals that developed the multiphasic inhibitor response (n = 4) and even at certain time points in some animals with sustained anti-FVIII IgG titers (Figure 6D; supplemental Figure 4E). Throughout ET3i challenge, ET3 antigen was still measurable in animals that demonstrated immunologic resistance despite observed decreases in FVIII activity and occasional IgG titers of <5. In fact, there was no significant difference in ET3-specific activity between challenge-resistant animals and the no-challenge controls (Figure 6E-F; supplemental Figure 5D,F). At the study end point, there was also no significant difference in ET3-specific activity between the AAV-ET3 multiphasic response animals and the AAV-ET3–treated + no ET3i challenge controls (no inhibitors; Figure 6F). Taken together, these data indicate that ET3 antigen production continued in the context of an anti-ET3–neutralizing antibody response.
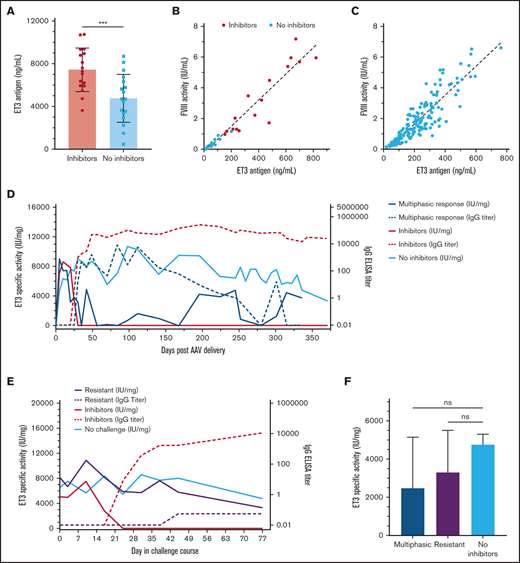
In vivo ET3-specific activity after AAV-ET3 treatment in different anti-ET3 immune response scenarios. (A) The mean ET3 antigen levels 5 days after AAV-ET3 delivery are significantly higher in animals that subsequently formed inhibitors compared with animals that did not. Error bars indicate standard deviation (2-tailed t test, P = .0008). (B) This graph plots ET3 antigen vs. FVIII activity 5 days after AAV-ET3 delivery, with a combined linear regression slope of 8559 IU/mg. Animals that subsequently formed inhibitors are indicated by red dots, and there was no significant difference in day 5 linear regression slopes between animals that did and did not form inhibitors. (C) This graph plots ET3 antigen vs. FVIII activity through week 28 for all animals that did not form inhibitors after AAV-ET3 delivery. The linear regression slope is 9376 IU/mg. (D-E) These graphs profile the median in vivo ET3 specific activity and IgG titer over time before ET3i challenge (D) or during the ET3i challenge course (E). These data are stratified by the type of anti-ET3 immune response observed. The IQR error bars were removed for visual clarity but are shown in supplemental Figures 4 and 5. (F) There is no significant difference in in vivo ET3-specific activity at time of death for animals that demonstrated a multiphasic inhibitor response after AAV-ET3 delivery (blue) and AAV-ET3–treated animals that were resistant to ET3i challenge (purple) compared with the AAV-ET3–treated + no ET3i challenge control animals (green) (Kruskal-Wallis H test, P = .5874).
In vivo ET3-specific activity after AAV-ET3 treatment in different anti-ET3 immune response scenarios. (A) The mean ET3 antigen levels 5 days after AAV-ET3 delivery are significantly higher in animals that subsequently formed inhibitors compared with animals that did not. Error bars indicate standard deviation (2-tailed t test, P = .0008). (B) This graph plots ET3 antigen vs. FVIII activity 5 days after AAV-ET3 delivery, with a combined linear regression slope of 8559 IU/mg. Animals that subsequently formed inhibitors are indicated by red dots, and there was no significant difference in day 5 linear regression slopes between animals that did and did not form inhibitors. (C) This graph plots ET3 antigen vs. FVIII activity through week 28 for all animals that did not form inhibitors after AAV-ET3 delivery. The linear regression slope is 9376 IU/mg. (D-E) These graphs profile the median in vivo ET3 specific activity and IgG titer over time before ET3i challenge (D) or during the ET3i challenge course (E). These data are stratified by the type of anti-ET3 immune response observed. The IQR error bars were removed for visual clarity but are shown in supplemental Figures 4 and 5. (F) There is no significant difference in in vivo ET3-specific activity at time of death for animals that demonstrated a multiphasic inhibitor response after AAV-ET3 delivery (blue) and AAV-ET3–treated animals that were resistant to ET3i challenge (purple) compared with the AAV-ET3–treated + no ET3i challenge control animals (green) (Kruskal-Wallis H test, P = .5874).
Discussion
Immunogenicity represents a significant barrier to the development of safe and effective gene- and protein-based drugs. Immunogenicity can result from lack of preexisting tolerance because of inadequate endogenous protein production, sequence and/or structural differences between the endogenous and the exogenous or heterologous products, or impurities in the drug products such as molecular aggregates. Although comparative immunogenicity assessment in animal models and by in silico analysis of predicted peptide:HLA haplotype binding is implemented in some protein drug development, its assessment and predictive value in gene therapy development is not well established.
Vector design elements are customized for individual gene therapy candidates, and characterization of the effects of vector design elements on efficacy is standard practice. However, the specific properties of a given candidate that are responsible for immunogenicity observed in preclinical studies are unclear and often not specifically interrogated, leaving little understanding of the impact that these factors have on the immune response. Although some studies have directly assessed the relationship between gene therapy dose, transgene expression kinetics, and transgene product immunogenicity,16,34,61 most studies have focused on parameters other than dose, including the disease status and/or causal mutation, HLA genetics, and microbiome, or drug-specific factors, such as function, target, T-cell epitope characterization, and degree of “self-ness.”62
The current study represents an attempt to rigorously address both the determinants of gene therapy comparative transgene product immunogenicity and tolerance through the development of an appropriate pharmacologic framework for preclinical evaluation of gene therapy candidates. Murine models of hemophilia A are a component of all preclinical product development programs and have been shown to replicate many aspects of the immune response to FVIII.15,17 -19,23,26,38,40,41,46,63 Using a murine hemophilia A model to evaluate vectors of increasing potency at a range of clinically relevant doses, a pharmacokinetic model of the FVIII activity data and immunogenicity outcomes was developed that provided a robust assessment of the relative immunogenicity risk. The only variables that correlated with immunogenicity risk also possessed a dominant effect on FVIII exposure kinetics.
Although rapid increase to high FVIII exposure levels strongly correlated with immunogenicity, slower kinetics appears favorable for reducing immunogenicity risk and supporting a pseudo-steady state at clinically relevant FVIII levels over the study lifetimes of the experimental animals. Furthermore, immune tolerance to exogenous FVIII challenge was observed in animals that achieved and maintained plasma FVIII levels ≥1 IU/mL (normal to supraphysiological human levels) after AAV-FVIII administration (Figure 5B). Of the animals that displayed FVIII expression rates below the immunogenic threshold (45 of 66 total), 97.8% (44 of 45 total) appeared to be immune nonresponsive to the FVIII being expressed by transduced cells. Because the immunogenic threshold is well above expression rates required to generate normal human and murine physiologic fVIII levels (∼1 IU/mL), it is not surprising that studies not designed to achieve this supraphysiological expression level also do not observe immune responses. Thus, the current results are consistent with our own previous work and the results of others (supplemental Table 1), but now provide a quantitative explanation. Additionally, data presented in the current study show evidence for immune tolerance induction in animals that initially develop anti-FVIII antibodies (Figures 2A-C,G and 3Aiv, Biv, Ci, Eiii). Collectively, the current data suggest a therapeutic window that supports efficacy, safety, and immune tolerance (Figure 5C) along with the concept that higher steady-state levels of FVIII expression may induce immune tolerance more effectively.
There are several limitations to this study, but these are recognized as common to all preclinical immunogenicity testing. Differences in species, intraspecies genetic background, and environment (eg, facilities where microbiota differ) likely impact the exact immunogenicity threshold and play a role in distinct outcomes with respect to tolerance or response after exogenous FVIII exposure. Given differences in AAV transgene product expression kinetics observed in different species,12,13,16,29,35,44,64,65 and the effect of genetic background on murine preclinical immunogenicity,42,66 it seems likely that dose-response relationships and immunogenicity threshold value deviations must exist. However, we predict that transgene product expression kinetics, and possibly all exogenous FVIII delivery, remain a universal and primary driver of immunogenicity in the previously untreated setting. Although we attempted to conduct a comprehensive retrospective analysis of all published preclinical gene therapy data, several confounding issues arose including common use of immune-deficient or -suppressed animals, limited early time point data, variations in reagents and assays used to assess FVIII activity and inhibitors, and small sample sizes, particularly in large animal studies. The most robust data sets outside of the current study are clinical trial data. In one such study, AAV5-FVIII appears to display much slower kinetics with a time to peak FVIII activity of 20 to 40 weeks, which is far slower that observed in the current murine studies (2-8 weeks) and would not be predicted to result in immunogenicity based on the model and threshold presented.67,68 However, another clinical study presented by George et al69 appears to present somewhat faster FVIII expression kinetics, although the presentation of the data make detailed examination and reanalysis more difficult to achieve. Based on the data presented, it also appears that the interpolated day 5 and day 10 kFVIII values would be well below the thresholds identified in the current study, and immunogenicity would not be predicted. Therefore, clinical AAV-FVIII trial data show initial FVIII expression rates within or below the immunogenicity threshold identified for FVIII-naïve hemophilia A mice. One caveat to this interpretation is that these clinical AAV-FVIII gene therapy studies differ in their inclusion of only subjects previously treated (eg, >150 exposures) with FVIII products and no history of inhibitors. Therefore, it is possible that these subjects have obtained some degree of immune tolerance to FVIII that is greater than what existed at the time of initial FVIII exposure. This situation may be more analogous to the mice that were challenged with exogenous FVIII after already experiencing long-term exposure to gene therapy–produced FVIII.
Endogenous FVIII has a nominal concentration of approximately 200 ng/mL (∼1 nM), defined as 1 IU/mL, while recombinant BDD FVIII variants have a higher specific activity closer to 10 000 IU/mg, with 1 IU/mL approximated by 100 ng/mL. Therefore, on a mass basis, the immunogenicity kFVIII threshold observed is relatively low at approximately 449 ng/day at day 5 compared with endogenous production rates of other disease associated plasma proteins (eg, coagulation factor IX that circulates at nominal concentration of 2-5 μg/mL). It will be important to determine whether the immunogenicity threshold identified in the current study for FVIII holds for other relevant gene therapy transgene products, or if each transgene product obeys a different threshold governed by its inherent biologic and biochemical properties. If an overall initial expression rate driven risk profile can be obtained, this model could be used to support the safe indication of current AAV-FVIII vector designs and doses to previously untreated patients. Furthermore, preclinical studies and pharmacologic models like the one presented herein may be informative across the field of genetic medicine.
Acknowledgments
This work was supported by funding from the National Institutes of Health/National Heart, Lung and Blood Institute Centers for the Investigation of the Factor VIII Immune Response in Patients with Hemophilia A (grant U54 HL141981 to C.B.D., H.T.S., and S.R.S.) and Hemophilia of Georgia (to C.B.D. and H.T.S.).
The content is solely the responsibility of the authors and does not necessarily represent the official views of the National Institutes of Health.
Authorship
Contribution: C.B.D. and H.T.S. conceived of the study, assisted in experimental planning, analyzed the data, and assisted in the writing of the manuscript; T.S.L. planned and executed experiments, analyzed data, composed the figures, and drafted the manuscript; G.D. performed the vector copy number assessments; and S.R.S. assisted in the design of the experiments, analysis of the data, and writing of the manuscript.
Conflict-of-interest disclosure: C.B.D. and H.T.S. are cofounders of Expression Therapeutics, Inc. and own equity in the company. C.B.D. is an employee of Expression Therapeutics, Inc. Expression Therapeutics licensed the intellectual property associated with the codon optimized ET3 transgene and HCB promoter. The terms of this arrangement have been reviewed and approved by Emory University in accordance with its conflict-of-interest policies.
Correspondence: Christopher B. Doering, 2015 Uppergate Dr, Emory Children’s Ctr, Rm 450, Atlanta, GA 30322; e-mail: cdoerin@emory.edu.

