

Key Points
Genome-wide CRISPR/Cas9 screening in the ALL cell line identified mitochondrial activity as the driver of panobinostat resistance.
SIRT1 expression sensitized ALL to panobinostat through activating mitochondrial activity and the mitochondria-related apoptosis pathway.

Abstract
Epigenetic alterations, including histone acetylation, contribute to the malignant transformation of hematopoietic cells and disease progression, as well as the emergence of chemotherapy resistance. Targeting histone acetylation provides new strategies for the treatment of cancers. As a pan-histone deacetylase inhibitor, panobinostat has been approved by the US Food and Drug Administration for the treatment of multiple myeloma and has shown promising antileukemia effects in acute lymphoblastic leukemia (ALL). However, the underlying drug resistance mechanism in ALL remains largely unknown. Using genome-wide Clustered Regularly Interspaced Short Palindromic Repeats (CRISPR)/CRISPR-associated (Cas)9 (CRISPR/Cas9) screening, we identified mitochondrial activity as the driver of panobinostat resistance in ALL. Mechanistically, ectopic SIRT1 expression activated mitochondrial activity and sensitized ALL to panobinostat through activating mitochondria-related apoptosis pathway. Meanwhile, the transcription level of SIRT1 was significantly associated with panobinostat sensitivity across diverse tumor types and thus could be a potential biomarker of panobinostat response in cancers. Our data suggest that patients with higher SIRT1 expression in cancer cells might benefit from panobinostat treatment, supporting the implementation of combinatorial therapy with SIRT1 or mitochondrial activators to overcome panobinostat resistance.
Introduction
Acute lymphoblastic leukemia (ALL) is the most prevalent malignant disease in children.1 Long-term prognosis in children with ALL has dramatically improved in recent decades, with the 5-year event-free survival rate approaching 90%.2 The success of ALL treatment is mainly attributed to refinement of therapy based on a better understanding of clinical and biological characteristics of the disease. However, small subsets of patients who experienced drug resistance would relapse with a dismal prognosis, and thus novel treatment strategies are needed.3
Advances in high-throughput multi-omics have further provided insights into the underlying molecular mechanisms of ALL and drug resistance. Growing evidence has shown that many genetic and epigenetic factors are associated with drug response and ALL relapse.4,5 In recent years, novel epigenetic modulation agents (eg, azacytidine, decitabine, and vorinostat) are promising in clinical efficacy.6-10 For example, DNA methyltransferase inhibitors (eg, 5-azacitidine), which can remove promoter hypermethylation in tumor cells and restore the gene expression signature, have achieved significant progress in the treatment of myeloid leukemia and myelodysplastic syndrome.6,7 Furthermore, histone deacetylase (HDAC) inhibitors such as vorinostat and panobinostat have been approved in clinical use for the treatment of cutaneous T-cell lymphoma and multiple myeloma.9-11
HDACs regulate chromatin structure and function by removing acetyl residues from the core histones.5 Deregulation of HDAC activity has been closely implicated in the silencing of differentiation and tumor suppressor genes, resulting in the promotion of oncogenesis, particularly leukemia.12,13 Interestingly, targeting HADCs has demonstrated potent antitumor activity in preclinical models and promising clinical efficacy in patients with cancer (eg, multiple myeloma and T-cell lymphoma).14,15 Panobinostat is a pan-HDAC inhibitor and has exerted promising cytotoxic activities against different cancer cells, including ALL.16-19 Garrido Castro et al18 demonstrated that panobinostat exerted antileukemia activity in a B-cell acute lymphoblastic leukemia (B-ALL) xenograft mouse model. Meanwhile, many clinical trials are ongoing to evaluate its therapeutic value against ALL.20,21 Although panobinostat is a promising antileukemia agent, the efforts to maximize its clinical benefit for acute leukemia will not succeed unless more details are known about its subtype specificity, functional mechanisms, and resistance mechanisms. In the present study, we performed a genome-wide Clustered Regularly Interspaced Short Palindromic Repeats (CRISPR)/CRISPR-associated (Cas)9 (CRISPR/Cas9) loss-of-function screening in B-ALL cells in the presence or absence of panobinostat to discover the molecule mechanism of its action and resistance.
Methods and materials
Cell culture, plasmids, and virus package
Lenti-X 293T cells (Clontech) were cultured in Dulbecco's modified eagle medium (Gibco) with 1 mM sodium pyruvate, 4500 mg/L glucose, and 10% fetal bovine serum (FBS). Cas9-expressing Nalm6 (Nalm6-Cas9) cells were a gift from William E. Evans. Nalm6, Nalm6-Cas9, UOCB1, SEM, and 697 cells were cultured in RPMI 1640 (Thermo Fisher Scientific) with 10% FBS. REH cells were cultured with modified RPMI 1640 medium containing 2 mM l-glutamine, 10 mM N-2-hydroxyethylpiperazine-N′-2-ethanesulfonic acid, 1 mM sodium pyruvate, 4500 mg/L glucose, 1500 mg/L sodium bicarbonate, and 10% FBS. Cells used in this study were cultured with medium containing 1/100 penicillin-streptomycin (Gibco). lentiCas9-Blast (#52962), lenti-sgRNA puro (#104990), lentiCRISPRv2GFP (#82416), and human CRISPR knockout pooled library (GeCKO v2, #1000000048 and #1000000049) were purchased from addgene. The cl20c-green fluorescent protein (GFP) plasmid was a gift from Jun Yang. Virus was produced by transient transfection of HEK293T cells using the calcium phosphate method.22 Viral supernatant was collected 42, 48, and 54 hours after transfection.
Genome-wide CRISPR screening
Nalm6-Cas9 cells were transduced with the human GeCKO v2 small guide RNA (sgRNA) library virus at an multiplicity-of-infection of 0.3 and a library fold-coverage of 500×.23 On day 2 after transfection, 2 μg/mL puromycin was added to select infected cells for another 3 days. After puromycin selection, 3.27 × 10⁷ cells were treated with dimethyl sulfoxide (DMSO) or 10 nM panobinostat. For each passage, 3.27 × 10⁷ cells were placed back into culture until 14 days under drug treatment. Genomic DNA of cells containing ∼500× coverage was harvested on days 7 and 14 after DMSO or panobinostat treatment using the Qiagen DNA kit according to the manufacturer’s protocol. gRNAs were polymerase chain reaction (PCR) amplified with barcoded primers for sequencing on an Illumina HiSeq2000. Sequencing reads were aligned to the initial library, and counts were obtained for each gRNA. Model-based Analysis of Genome-wide CRISPR-Cas9 Knockout (MAGeCK) and EdgeR were used to calculate P values, false discovery rates, and log2 fold changes for comparison between the DMSO and panobinostat treated samples at days 7 and 14.24
Construct genes knockdown and overexpressing cell lines
To disturb the expression of genes (CREBBP, BAK1, SIRT1, KAT7, PMAIP1, and ACLY) potentially related to panobinostat resistance, oligos of the top 3 enriched sgRNAs in the GeCKO v2 library were synthesized, annealed, and inserted into lenti-sgRNA puro and LentiCRISPRv2GFP plasmids. Lentiviral particles containing sgRNAs were produced by transient transfection of Lenti-X 293T cells using calcium phosphate. Nalm6-Cas9 cells were incubated with lenti-sgRNA puro lentiviral supernatants for 48 hours and then subjected to selection with puromycin (2 mg/mL) for 3 days. REH, 697, and UOCB1 cells were incubated with LentiCRISPRv2GFP lentiviral supernatants for 48 hours, and then GFP-positive cells were sorted by flow cytometry.
To construct SIRT1-overexpressing cell lines, SIRT1 cDNA fragments were cloned using CloneAmp HiFi PCR Premix (Clontech) and then cloned into cl20c-GFP to construct the overexpression vector. SIRT1 sgRNA target region was introduced with synonymous mutations to circumvent Cas9 editing. cl20c-SIRT1-GFP vector was digested with BmgB1 and Not1 enzymes, and a puromycin fragment was inserted to further construct cl20c-SIRT1-puro vector. Lentiviral supernatants containing empty vector, cl20c-SIRT1-GFP, or cl20c-SIRT1-puro were produced by transient transfection of Lenti-X 293T cells using calcium phosphate. Nalm6, REH, 697, and UOCB1 cells were incubated with lentiviral supernatants for 48 hours and subjected to puromycin selection or flow cytometry sorting as appropriate.
Quantitative reverse transcriptase-PCR
Total RNA was extracted from cells using RNeasy Plus Mini Kit (Qiagen), and cDNA was generated with the one-step RT master mix Kit (Takara). Quantitative PCR was performed using SYBR Green PCR Master Mix (Takara), and transcript levels were normalized to actin as an internal control. Experiments were performed in triplicate for 3 times independently.
Drug sensitivity assay
Panobinostat sensitivity was tested in ALL cells, using the 3-(4,5-dimethylthiazol-2-yl)-2,5-dimethyltetrazolium bromide; 3-[4,5-dimethylthiazol-2-yl]-2,5-diphenyltetrazolium bromide (MTT) assay. Briefly, cells were seeded in 96-well plates at a density of 3.2 × 10⁴ cells per well and then treated with gradient concentrations of panobinostat in triplicate. After 72 hours of incubation, cell viability was quantified using the MTT assay, and the panobinostat killing curve was estimated using GraphPad Prism Software.
RNA sequencing
Nalm6 cells were treated with control or 10 nM panobinostat for 24 hours in triplicate. Total RNA was extracted using an RNA Isolation Kit (Qiagen). A total amount of 1 µg RNA per sample was used as input material for the RNA sample preparations. Sequencing libraries were generated using the NEBNext UltraTM RNA Library Prep Kit for Illumina (NEB) following the manufacturer’s recommendations, and index codes were added to attribute sequences to each sample. Samples were submitted to the Illumina Novaseq platform, and 150-bp paired-end reads were generated. The raw sequence data of RNA sequencing (RNA-seq) have been deposited in the Genome Sequence Archive in National Genomics Data, China National Center for Bioinformation/Beijing Institute of Genomics, Chinese Academy of Sciences, under accession number HRA001017, which are publicly accessible at https://ngdc.cncb.ac.cn/gsa-human. Differential expression analysis of groups was performed using the DESeq2.25
Western blotting
All cells were lysed in Modified lysis buffer (25 mM N-2-hydroxyethylpiperazine-N′-2-ethanesulfonic acid, pH 7.5, 150 mM NaCl, 1% Igepal CA-630, 10 mM MgCl2, 1 mM EDTA, and 2% glycerol) with protease and phosphatase inhibitors (Roche). Protein was quantified by Bradford assay (Bio-Rad). Protein lysates were separated on 7.5% to 12% Bis-Tris gels (Thermo) and transferred to polyvinylidene difluoride membranes (Bio-Rad). Membranes were blocked with 5% milk in Tris-buffered saline with 0.1% Tween® 20 Detergent buffer (Cell Signaling) and incubated with the following antibodies: ACTIN-B (1:10000, cat. ab179467), PMAIP1 antibody (1:1000, cat. ab13654), and SIRT1 antibody (1:1000, cat. ab110304) from abcam, PARP (1:1000, cat. 9532) from Cell Signaling Technology, and Caspase 3 antibody (1:1000. Cat. 19677-1-AP) from ProteinTech.
Flow cytometry analysis
Mitochondrial membrane potential (MMP) was monitored by flow cytometry using tetramethyl rhodamine methyl ester (TMRM).26 Cells were loaded with 10 nM TMRM and incubated at 37°C for 30 minutes. Cells were then washed 3 times with the phosphate-buffered saline and subjected to flow cytometry following the manufacturer’s instructions. Relative levels of MMP were determined from 20 000 cells in biological triplicate.
Reactive oxygen species (ROS) was monitored by flow cytometry using 2'-7'dichlorofluorescin diacetate (DCFH-DA).27 Cells were labeled with 2 nM DCFH-DA, incubated at 37°C for 30 minutes, and inverted every 5 minutes. Cells were then washed 3 times with the media and subjected to flow cytometry following the manufacturer’s instructions.
Apoptosis cells were monitored by flow cytometry using Annexin V-kFluor647. Cells were collected and washed with pre-cold phosphate-buffered saline once. Cells were then resuspended in 500 μL binding buffer, labeled with 5 µL Annexin V-kFluor647, and incubated at room temperature for 5 to 15 minutes. Labeled cells were subjected to flow cytometry analysis.
Statistical analysis
Kyoto encyclopedia of genes and genomes (KEGG) and gene ontology (GO) analyses of genes enriched in CRISPR/Cas9 screening were conducted by Enrichr.28 Search Tool for the Retrieval of Interacting Genes/Proteins (STRING) protein-protein interaction network analysis was performed online (https://string-db.org/).29 KEGG and GO analysis of differentially expressed genes was implemented by the clusterProfiler R package or online tool Enrichr.28,30 Gene set enrichment analysis (GSEA; Broad Institute) was done using gene sets from MSigDB (v.5.0).31
Results
CRISPR screening identified genes that contributed to panobinostat resistance
To systematically identify genes that regulate panobinostat sensitivity in human B-ALL cells, we performed genome-wide CRISPR/Cas9 knockout screening in Nalm6 cell line using the GeCKO v.2 library.23 We transduced Nalm6-Cas9 cells with the GeCKO v.2 library at an MOI of 0.3 and maintained it in the presence of 2 μg/mL puromycin for 3 days to allow selection and gene editing. Nalm6-Cas9 cells tranduced with sgRNA library virus were then treated with 10 nM panobinostat or DMSO for 14 days, at which dose 60% to 80% of Nalm6 was killed, and the proliferation of Nalm6 was significantly inhibited in vitro over 5 days (Figure 1A; supplemental Figure 1A) and sequenced the distribution of sgRNAs at days 7 and 14 after drug treatment (Figure 1A). The MAGeCK algorithm was used to analyze the relative enrichment of each sgRNA and identify the significant genes whose knockout conferring resistance to panobinostat.24 After 14 days of selection, HDAC1, as 1 of the histone deacetylase coding genes, was listed in the positively selected genes (supplemental Figure 1B; supplemental Tables 1 and 2), which confirmed the validity of our CRISPR screening. Furthermore, BAK1 and PMAIP1 were among the top 10 positively selected genes (Figure 1B; supplemental Figure 2A-B), consistent with their well-known roles in activating mitochondria-dependent apoptosis pathways and their loss of function conferring apoptosis resistance.32 Interestingly, several genes (SIRT1, ACLY, CREBBP, and KAT7) involved in acetylation modification were among the top hits (Figure 1B; supplemental Figure 2C-F), which was in agreement with the mechanism of action of panobinostat. We next sought to validate several significantly enriched genes by P value rank, and we were particularly interested in 2 clusters of genes involved in apoptosis and acetylation modification, respectively. Thus, 6 of the top 10 enriched genes were included for further validation: CREBBP, BAK1, SIRT1, KAT7, PMAIP1, and ACLY (Figure 1B). CREBBP encodes histone acetyltransferase that acetylates both histone and nonhistone proteins.33 SIRT1 belongs to the class III HDAC family, which can deacetylate both histone and nonhistone proteins.34,35 KAT7 is a lysine acetyltransferase, and ACLY is a transferase that catalyzes the conversion of citrate and coenzyme A to acetyl-CoA, which provides source for protein acetylation, especially histone modification.36,37 Top sgRNAs targeting these genes in the screening were selected, and Nalm6-Cas9 transduced with these sgRNAs showed significantly downregulated expression of representative genes (supplemental Figure 3). Using MTT assays, we confirmed that disturbing expression of PMAIPI, BAK1, and SIRT1 conferred significant resistance to panobinostat, whereas disturbing the others had no effect (Figure 1C-H). Together, our genome-wide CRISPR/Cas9 loss of-function screening revealed a number of potential regulators of resistance to panobinostat in ALL.
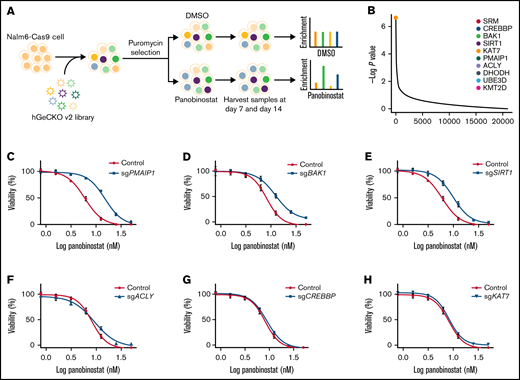
Genome-wide CRISPR/Cas9 screening identified genes that contributed to panobinostat resistance. (A) Schematic outline of the genome wide CRISPR/Cas9 loss-of-function screening. (B) Enriched genes by P value rank after CRISPR/Cas9 screening at day 14 after panobinostat treatment. (C-H) Validation of selected genes in the CRISPR/Cas9 screening using an MTT assay in Nalm6-Cas9 cells. Nalm6-Cas9 cells were infected with empty vector (CON) or sgRNA vectors to disturb targeted gene expression. Each experiment was in triplicate and repeated 3 times. Data represent mean ± standard deviation (SD; n = 3).
Genome-wide CRISPR/Cas9 screening identified genes that contributed to panobinostat resistance. (A) Schematic outline of the genome wide CRISPR/Cas9 loss-of-function screening. (B) Enriched genes by P value rank after CRISPR/Cas9 screening at day 14 after panobinostat treatment. (C-H) Validation of selected genes in the CRISPR/Cas9 screening using an MTT assay in Nalm6-Cas9 cells. Nalm6-Cas9 cells were infected with empty vector (CON) or sgRNA vectors to disturb targeted gene expression. Each experiment was in triplicate and repeated 3 times. Data represent mean ± standard deviation (SD; n = 3).
Mitochondrial activity was related to panobinostat resistance
To identify key pathways and biological processes contributing to panobinostat sensitivity, we first performed KEGG pathway analysis of significantly enriched genes at day 14 (P < .05; Figure 2A), and these genes were significantly enriched in thermogenesis, oxidative phosphorylation (OXPHOS), and cell cycle pathways, et al. To identify key pathways that contribute to panobinostat resistance, we next proceeded KEGG pathway analysis focusing on positively selected genes that were enriched at day 14 (P < .05). Interestingly, p53 signaling pathway was significantly enriched (Figure 2B), which means p53 signaling pathway defect conferred panobinostat resistance, consistent with previously functional studies that p53 contributed to increased sensitivity to panobinostat.38 We also noted strong enrichment for mitochondrial-related processes, such as thermogenesis and oxidative phosphorylation (Figure 2B). Meanwhile, GO analysis of these positively selected genes also pointed to over-representing genes related to mitochondria-related processes and histone acylation (Figure 2C). Moreover, when combined the screening results of days 7 and 14, we identified 217 common positively selected genes (Figure 2D; supplemental Tables 1-4). STRING protein-protein interaction network analysis of these common enriched genes generated a highly connected map implicating mitochondrial functions, mitochondrial translation, aminoacyl-tRNA biosynthesis, and epigenetic regulations (Figure 2E). Collectively, these data revealed strong relevance of mitochondrial processes in the resistance of ALL cells to panobinostat. Therefore, mitochondrial function defect might be a potential mechanism that contributed to panobinostat resistance in ALL.
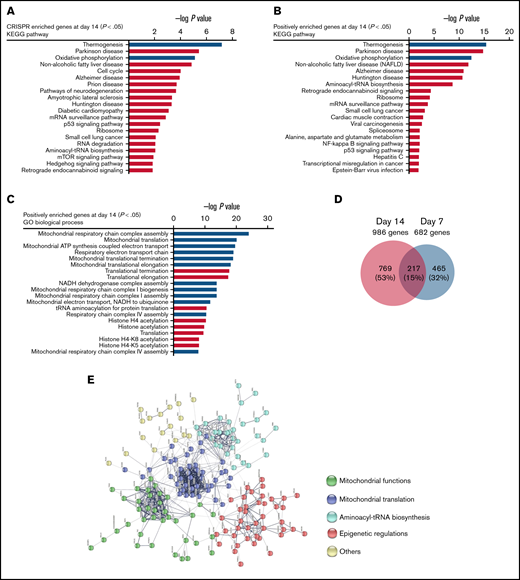
Pathway analysis of genome-wide CRISPR/Cas9 screening enriched genes. (A) KEGG pathway analysis of significantly enriched genes in the CRISPR/Cas9 screening at day 14 (P < .05) after panobinostat treatment. (B) KEGG pathway analysis of positively enriched genes in the CRISPR/Cas9 screening at day 14 (P < .05) after panobinostat treatment. (C) GO biological process analysis positively enriched genes in the CRISPR/Cas9 screening at day 14 (P < .05) after panobinostat treatment. (D) Venn diagram of the positively selected genes in the CRISPR/Cas9 screening at days 7 (P < .05) and 14 (P < .05) after panobinostat treatment. (E) STRING protein-protein interaction network analysis of the 217 common positively selected genes as defined in panel D. The minimum required interaction score was set to 0.5, and the disconnected dots were removed. K-means clustering was applied with the number of clusters set to 5.
Pathway analysis of genome-wide CRISPR/Cas9 screening enriched genes. (A) KEGG pathway analysis of significantly enriched genes in the CRISPR/Cas9 screening at day 14 (P < .05) after panobinostat treatment. (B) KEGG pathway analysis of positively enriched genes in the CRISPR/Cas9 screening at day 14 (P < .05) after panobinostat treatment. (C) GO biological process analysis positively enriched genes in the CRISPR/Cas9 screening at day 14 (P < .05) after panobinostat treatment. (D) Venn diagram of the positively selected genes in the CRISPR/Cas9 screening at days 7 (P < .05) and 14 (P < .05) after panobinostat treatment. (E) STRING protein-protein interaction network analysis of the 217 common positively selected genes as defined in panel D. The minimum required interaction score was set to 0.5, and the disconnected dots were removed. K-means clustering was applied with the number of clusters set to 5.
Panobinostat treatment abrogated mitochondrial activity in ALL
To investigate the mechanism of panobinostat action and resistance, we first sought to dissect the transcriptome changes on panobinostat exposure and retrieved published RNA-seq data (GSE78234), in which 3 B-ALL cell types (SEM, REH, KOPN8) were treated with control or panobinostat for 24 hours and subsequently submitted to RNA-seq.18 Gene differential expression (DE) analysis of these transcriptomes successfully identified 1183 common DE genes across 3 cell lines (adjusted P < .05; supplemental Table 5; supplemental Figure 4A). GO biological process analysis of these 1183 common DE genes revealed a strong enrichment for mitochondrial processes and histone acetylation modification (supplemental Figure 4B), in line with the CRISPR/Cas9 screening results. These findings further indicated there was a strong link between mitochondrial activity and panobinostat resistance. We next performed RNA sequencing in Nalm6 after exposure to control or 10 nM panobinostat for 24 hours. Transcriptome landscape changed significantly after panobinostat exposure (Figure 3A; supplemental Table 6). GSEA using the RNA-seq data from Nalm6 showed that genes associated with mitochondrial activity including OXPHOS, pyruvate metabolism, and tricarboxylic acid (TCA) cycle were significantly decreased under panobinostat treatment (Figure 3B-D). Indeed, several key genes that positively regulate mitochondria biogenesis were also downregulated after panobinostat treatment (Figure 3E). Mitochondrial OXPHOS is responsible for ROS production. Staining with DCFH-DA showed significantly lower ROS levels in Nalm6 cells treated with 10 nM panobinostat compared with control (Figure 3F), which experimentally confirmed that mitochondrial OXPHOS was reduced to low levels under panobinostat treatment. These findings indicated that mitochondrial activity and OXPHOS in ALL cells were induced into an inactive state under panobinostat exposure, which might be an adaptive evolution process, and in turn, ALL cells could escape from Panobinostat-induced cell death.
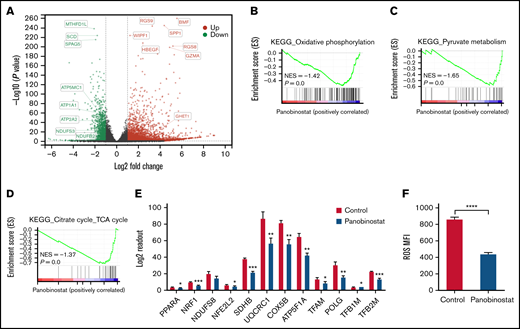
Mitochondrial activity was ablated by panobinostat. (A) Volcano plot showing differentially expressed genes in the Nalm6 cell line treated with 10 nM panobinostat vs control for 24 hours (P < .05, Log fold change >1). (B-C) Enrichment score plots from GSEA using RNA-seq data from Nalm6 treated with 10 nM panobinostat vs control. (E) Relative level of mitochondrial related genes expression in Nalm6 treated with 10 nM panobinostat vs control for 24 hours. (F) Quantitative of ROS after staining with DCFH-DA in Nalm6 treated with 10 nM panobinostat vs CON for 24 hours. MFI, mean fluorescence intensity; NES, normalized enrichment score. Data represent mean ± SD (n = 3). Data with statistical significance are as indicated: *P < .05, **P < .01, ***P < .005, ****P < .001.
Mitochondrial activity was ablated by panobinostat. (A) Volcano plot showing differentially expressed genes in the Nalm6 cell line treated with 10 nM panobinostat vs control for 24 hours (P < .05, Log fold change >1). (B-C) Enrichment score plots from GSEA using RNA-seq data from Nalm6 treated with 10 nM panobinostat vs control. (E) Relative level of mitochondrial related genes expression in Nalm6 treated with 10 nM panobinostat vs control for 24 hours. (F) Quantitative of ROS after staining with DCFH-DA in Nalm6 treated with 10 nM panobinostat vs CON for 24 hours. MFI, mean fluorescence intensity; NES, normalized enrichment score. Data represent mean ± SD (n = 3). Data with statistical significance are as indicated: *P < .05, **P < .01, ***P < .005, ****P < .001.
Enhanced mitochondrial activity sensitized Nalm6 to panobinostat
Our findings suggested that ALL cells under inactive OXPHOS state or repressed mitochondrial activity could escape from panobinostat induced cell death. We thus speculated that activating OXPHOS or mitochondrial activity could sensitize ALL cells to panobinostat. Rosiglitazone, a peroxisome proliferator-activated receptor gamma (PPARγ) activator, was reported to stimulate mitochondrial biogenesis and enhance OXPHOS in brain and adipose tissue.39,40 Exposure of Nalm6 to 31.25 μM rosiglitazone for 24 and 48 hours indeed elevated ROS levels and MMP (Figure 4A-B), which validated its activation role on mitochondria activity in ALL cells. We next sought to examine the synergistic effects of rosiglitazone in combination with panobinostat. As expected, rosiglitazone combined with panobinostat led to more apoptosis than control or either drug alone, as demonstrated using Annexin-V staining (Figure 4C). Moreover, cells treated with rosiglitazone in combination with panobinostat exhibited the lowest viability in MTT assay (Figure 4D). We also performed combination drug sensitivity assay on REH and SEM cell lines. It is also worth noting that REH might represent a line that is relatively resistant to panobinostat (supplemental Figure 5A), and SEM (KMT2A-rearranged) may represent a chemo-resistant ALL cell line. We found that rosiglitazone combined with panobinostat resulted in more cell death than that what was achieved by either drug alone (13.72% and 1.78%, respectively) or the addition of the 2 (28.93%) in REH cells. Similar results were seen in SEM cells (supplemental Figure 5B-C), pointing to the potential synergistic effect of these 2 compounds across different ALL cell lines. We found that genes encoding key transcription factors (eg, POLG, GABPA, and TFB1M) that positively regulate mitochondrial biogenesis were significantly enriched in CRISPR/Cas9 screening (P < .05; supplemental Table 1; supplemental Figure 6A-C).41-43 Interestingly, we further noticed that panobinostat sensitivity (Sanger GDSC1 IC50) was significantly negatively correlated with the expression of these 3 genes (POLG, GABPA, and TFB1M) in diverse cancer cell lines (P < .05, N = 576) using public data retrieved from Depmap Portal (supplemental Figure 6D-F). Altogether, these results suggested that enhancing mitochondrial activity appears to represent a strategy to overcome panobinostat resistance.
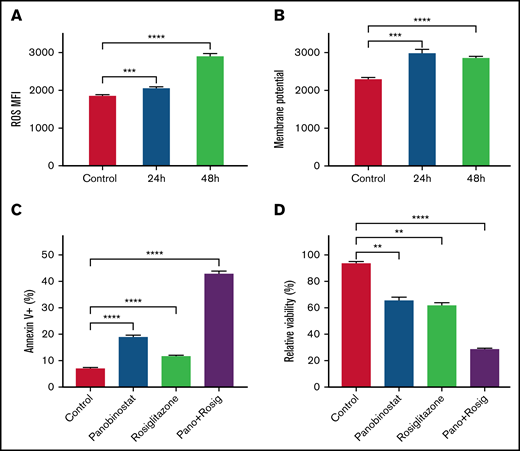
Enhanced mitochondrial activity sensitized Nalm6 to panobinostat. (A) ROS quantification in Nalm6 treated with control or 31.25 mM rosiglitazone for 24 and 48 hours were evaluated by DCFH-DA staining. (B) Membrane potential in Nalm6 treated with control or 31.25 mM rosiglitazone for 24 and 48 hours were evaluated by TMRM staining. (C) Nalm6 were treated with control, 10 nM panobinostat alone, 62.5 μM rosiglitazone alone, and10 nM panobinostat combined with 62.5 μM rosiglitazone for 24 hours. Apoptosis cells were detected by Annexin V-APC (Allophycocyanin) staining using flow cytometry. (D) Nalm6 cells were treated with control, 10 nM panobinostat alone, 62.5 μM rosiglitazone alone, and10 nM panobinostat combined with 62.5 μM rosiglitazone for 72 hours. The MTT assay was used to analyze the relative viability. Data represent mean ± SD (n = 3). Data with statistical significance are as indicated: **P < .01, ***P < .005, ****P < .001.
Enhanced mitochondrial activity sensitized Nalm6 to panobinostat. (A) ROS quantification in Nalm6 treated with control or 31.25 mM rosiglitazone for 24 and 48 hours were evaluated by DCFH-DA staining. (B) Membrane potential in Nalm6 treated with control or 31.25 mM rosiglitazone for 24 and 48 hours were evaluated by TMRM staining. (C) Nalm6 were treated with control, 10 nM panobinostat alone, 62.5 μM rosiglitazone alone, and10 nM panobinostat combined with 62.5 μM rosiglitazone for 24 hours. Apoptosis cells were detected by Annexin V-APC (Allophycocyanin) staining using flow cytometry. (D) Nalm6 cells were treated with control, 10 nM panobinostat alone, 62.5 μM rosiglitazone alone, and10 nM panobinostat combined with 62.5 μM rosiglitazone for 72 hours. The MTT assay was used to analyze the relative viability. Data represent mean ± SD (n = 3). Data with statistical significance are as indicated: **P < .01, ***P < .005, ****P < .001.
SIRT1 affected panobinostat sensitivity by modulating mitochondrial activity
Our CRISPR/Cas9 screening identified SIRT1 as 1 of the top positively selected genes (Figure 1B). SIRT1 belongs to the class III HDAC family that regulates gene expression by modulating chromatin structures and transcriptional factor activities. SIRT1 plays a significant role in diverse biological processes, such as aging, senescence, mitophagy, oxidative stress, and mitochondrial function.44-47 Given the key regulator role of SIRT1 in mitochondrial biogenesis, we hypothesized that SIRT1 could affect panobinostat sensitivity by modulating mitochondrial activity. First, we performed RNA-seq in Nalm6 on disturbing SIRT1 expression (sgSIRT1) or OE (supplemental Table 7). Differential gene expression analysis found that expression of a subset of genes varied significantly among 3 groups (Figure 5A). KEGG pathway enrichment analysis of the differentially expressed genes (log fold change >1 or <−1, adjusted P < .05) in Nalm6 control (CON) and SIRT1 OE group showed strong enrichment of mitochondrial pathway, such as oxidative phosphorylation, thermogenesis, and the citrate cycle (Figure 5B; supplemental Table 8). To examine whether SIRT1 positively regulated mitochondrial activity in ALL, we next performed GSEA using oxidative phosphorylation gene expression signature.31 This analysis revealed that oxidative phosphorylation genes were positively enriched in the SIRT1 OE group and negatively enriched in the SIRT1 disturbed (sgSIRT1) group compared with the CON group (Figure 5C-D; supplemental Table 8 and 9), consistent with the functions of SIRT1 in positively regulating mitochondrial activity in previous studies. To functionally confirm the role of SIRT1 in regulating mitochondrial activity, we measured the MMP using TMRM staining in 3 groups. Disturbing SIRT1 expression (sgSIRT1) in Nalm6 cells significantly decreased the MMP, whereas SIRT1 OE significantly increased the MMP (Figure 5E), thus demonstrating the positive role of SIRT1 on mitochondrial activity in ALL.
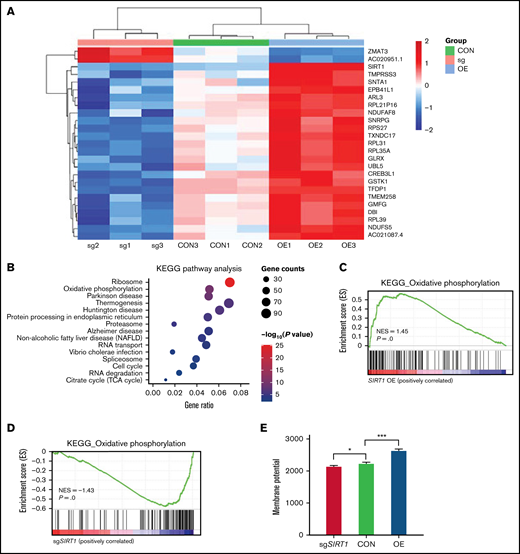
SIRT1 expression modulated mitochondrial activity. (A) Heatmap showing the differentially expressed genes in Nalm6 CON, sgSIRT1(sg), and SIRT1 OE cells (log fold change >1 or <−1, adjusted P < .05). (B) KEGG pathway enrichment analysis of the differentially expressed genes in Nalm6 CON and SIRT1 OE cells. Top 15 enriched pathways with adjusted P < .05 are shown in the bubble plot. (C-D) GSEA analysis of the oxidative phosphorylation gene expression signature for SIRT1 OE vs Nalm6 CON (C) and sgSIRT1 vs Nalm6 CON (D). (E) Membrane potential in Nalm6 CON and sgSIRT1 and SIRT1 OE cells were evaluated by TMRM staining. Data represent mean ± SD (n = 3). Data with statistical significance are as indicated: *P < .05, ***P < .005.
SIRT1 expression modulated mitochondrial activity. (A) Heatmap showing the differentially expressed genes in Nalm6 CON, sgSIRT1(sg), and SIRT1 OE cells (log fold change >1 or <−1, adjusted P < .05). (B) KEGG pathway enrichment analysis of the differentially expressed genes in Nalm6 CON and SIRT1 OE cells. Top 15 enriched pathways with adjusted P < .05 are shown in the bubble plot. (C-D) GSEA analysis of the oxidative phosphorylation gene expression signature for SIRT1 OE vs Nalm6 CON (C) and sgSIRT1 vs Nalm6 CON (D). (E) Membrane potential in Nalm6 CON and sgSIRT1 and SIRT1 OE cells were evaluated by TMRM staining. Data represent mean ± SD (n = 3). Data with statistical significance are as indicated: *P < .05, ***P < .005.
SIRT1 sensitized ALL cells to panobinostat through activation of the mitochondrial apoptosis pathway
Because enhanced mitochondrial activity overcomes panobinostat resistance in ALL, we hypothesized that SIRT1 expression was correlated with panobinostat sensitivity. We confirmed that disturbing SIRT1 expression (sgSIRT1) resulted in panobinostat resistance (Figure 6A-B), and next we overexpressed SIRT1 by transducing overexpression vector into Nalm6 cells. Subsequently, the sensitivity of these cells against panobinostat revealed increased sensitivity of SIRT1 overexpression cells vs CON and SIRT1 disturbed cells (Figure 6A-B). Modulating SIRT1 expression in another ALL cell line (REH) exhibited a similar panobinostat response pattern (Figure 6A,C). Additionally, we overexpressed SIRT1 in the other 2 ALL cell lines (697 and UOCB1) and found SIRT1 OE cells were more sensitive to panobinostat than control cells (supplemental Figure 7A-C), confirming the role of SIRT1 in modulating panobinostat in ALL. Interestingly, an association analysis of SIRT1 expression and panobinostat sensitivity (Sanger GDSC1 IC50) across diverse cancer cell lines (N = 576) retrieved from the Depmap portal revealed a significantly negative correlation (P = .02; supplemental Figure 7D), suggesting that SIRT1 could be an indicator of panobinostat sensitivity across diverse cancer types.
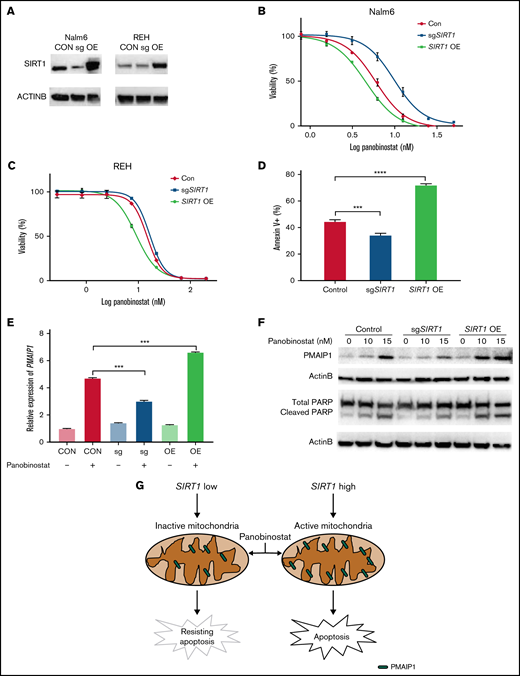
SIRT1 sensitized ALL cells to panobinostat through activation of the mitochondrial apoptosis pathway. (A) Western blot analysis of SIRT1 expression in Nalm6 and REH transduced with CON, SIRT1 sgRNA (sgSIRT1), or OE vectors. (B-C) The MTT assay was performed to detect relative sensitivity of CON, SIRT1 sgRNA (sgSIRT1), and OE cells in Nalm6 (B) and REH (C); cells were incubated with the indicated concentration of panobinostat for 3 days. (D) Annexin V staining of apoptosis cells after panobinostat treatment in Nalm6 transduced with CON, SIRT1 sgRNA (sgSIRT1), or OE vectors. (E) Quantitative reverse transcriptase-PCR analysis of PMAIP1 expression in Nalm6 transduced with CON, SIRT1 sgRNA (sgSIRT1), or OE vectors with or without panobinostat treatment. (F) Western blot analysis of PMAIP1 and cleaved PARP expression with actin B as an internal control in Nalm6 transduced with CON, SIRT1 sgRNA (sgSIRT1), or OE vectors with or without panobinostat treatment. (G) Schematic outline of this study. SIRT1 sensitized ALL cells to panobinostat through activation of the PMAIP1-mediated mitochondrial apoptosis pathway. Data represent mean ± SD (n = 3). r, Pearson correlation coefficient.
SIRT1 sensitized ALL cells to panobinostat through activation of the mitochondrial apoptosis pathway. (A) Western blot analysis of SIRT1 expression in Nalm6 and REH transduced with CON, SIRT1 sgRNA (sgSIRT1), or OE vectors. (B-C) The MTT assay was performed to detect relative sensitivity of CON, SIRT1 sgRNA (sgSIRT1), and OE cells in Nalm6 (B) and REH (C); cells were incubated with the indicated concentration of panobinostat for 3 days. (D) Annexin V staining of apoptosis cells after panobinostat treatment in Nalm6 transduced with CON, SIRT1 sgRNA (sgSIRT1), or OE vectors. (E) Quantitative reverse transcriptase-PCR analysis of PMAIP1 expression in Nalm6 transduced with CON, SIRT1 sgRNA (sgSIRT1), or OE vectors with or without panobinostat treatment. (F) Western blot analysis of PMAIP1 and cleaved PARP expression with actin B as an internal control in Nalm6 transduced with CON, SIRT1 sgRNA (sgSIRT1), or OE vectors with or without panobinostat treatment. (G) Schematic outline of this study. SIRT1 sensitized ALL cells to panobinostat through activation of the PMAIP1-mediated mitochondrial apoptosis pathway. Data represent mean ± SD (n = 3). r, Pearson correlation coefficient.
Mitochondria is a pivotal cellular organelle for energy metabolism and programmed cell death.48 Activation of this intrinsic apoptosis pathway leads to mitochondrial outer membrane permeabilization and cell death. The threshold of cells that is primed for death is determined by the balance between antiapoptotic and proapoptotic proteins in the BCL-2 family.32 Given that SIRT1 enhanced mitochondrial functional in ALL, we hypothesized that SIRT1 boosted Panobinostat-induced cell death through activation of the mitochondrial apoptosis pathway. We first examined the proportion of cells undergoing apoptosis using Annexin-V staining in Nalm6 control, SIRT1 disturbed, and SIRT1 OE cells. SIRT1 OE cells exhibited the highest proportion of apoptosis, whereas SIRT1 disturbed cells exhibited the lowest proportion of apoptosis compared with CON cells (Figure 6D), suggesting that SIRT1 sensitizes ALL cells to panobinostat by regulating apoptosis. Next, we explored the expression of BCL-2 family members from the RNA-seq data, of which Nalm6 control, SIRT1 disturbed, and SIRT1 OE cells were treated with control or 10 nM panobinostat for 24 hours and found SIRT1 overexpression combined with panobinostat treatment increased the expression of PMAIP1 (supplemental Figure 8; supplemental Table 7), which is a proapoptotic protein in the mitochondrial apoptosis pathway. Strikingly, we successfully enriched and validated this gene in the CRISPR/Cas9 screening (Figure 1C), whose knockout conferred panobinostat resistance. Real-time quantitative PCR demonstrated that SIRT1 level modulated Panobinostat-induced PMAIP1 expression, with SIRT1 overexpression cells exhibiting the highest expression of PMAIP1 and SIRT1 disturbed cells exhibiting the lowest expression of PMAIP1 compared with control cells (Figure 6E), showing a similar pattern with apoptosis. Western blot analysis revealed panobinostat treatment had a modest effect on PMAIP1 in SIRT1 disturbed cells and led to a dramatic upregulation in SIRT1 overexpression cells (Figure 6F). Cleaved PARP was expressed in the same pattern as PMAIP1 on panobinostat treatment (Figure 6F), both of which are master regulators of apoptosis.49 Taken together, these results demonstrated that SIRT1 boosted Panobinostat-induced cell death through activation of the mitochondrial apoptosis pathway.
Discussion
Dysregulation of epigenetic modifications, including histone acetylation, has been identified as an important factor in the pathogenesis and progression of leukemia,4,14,15,33 and HDACs have emerged as promising therapeutical targets in leukemia.13,14 Panobinostat, a potent pan-HDAC inhibitor, was first approved by the U.S. Food and Drug Administration in 2015 for the treatment of patients with multiple myeloma.11 Since then, many in vitro and in vivo studies have demonstrated that panobinostat exerts promising cytotoxic activities against leukemia, and clinical trials are ongoing to evaluate the therapeutic value in ALL.18-20 However, the precise molecular mechanisms of its action and the mechanisms involved in resistance to it are largely unknown. In the current study, we performed genome-wide unbiased CRISPR/Cas9 screening combined with other biological experiments and bioinformatics analysis to dissect the underlying molecular mechanism of panobinostat resistance in ALL.
Our CRISPR/Cas9 screening assay uncovered multiple genes that were potentially associated with panobinostat resistance. Pathway analysis of these numerous genes revealed strong enrichment for mitochondrial-related processes, suggesting that mitochondrial function defects might contribute to panobinostat resistance. Transcriptome analysis of ALL cells revealed that mitochondrial activity (ie, oxidative phosphorylation, pyruvate metabolism, and TCA cycle) was decreased under panobinostat exposure, and this adaptive evolution of the transcriptome might be a feedback mechanism to escape panobinostat-induced cell death. Mitochondria plays a central role in apoptotic cell death induced by anticancer agents. For example, Gentric et al50 reported that active mitochondrial metabolism enhances chemosensitivity in human ovarian cancers. In recent years, many groups have reported that the mitochondrial pathway (eg, respiration and translation) is a key determinant of drug response, and targeting the mitochondrial pathway emerges as a strategy to enhance chemosensitivity.51-53 In this study, we used rosiglitazone, a PPARγ activator, to stimulate mitochondrial biogenesis and activate OXPHOS and found that rosiglitazone exposure sensitized Nalm6 cells to panobinostat, which confirmed the role of mitochondrial function in panobinostat response. We also confirmed this synergetic effect of rosiglitazone and panobinostat in the other 2 ALL cell lines (REH and SEM), representing panobinostat resistant and traditional chemotherapy-resistant cell lines, respectively. In vivo studies are critically needed to explore the efficacy of these combination therapies and will be explored in future studies. Noteworthy, mining the DepMap database uncovered that panobinostat sensitivity (Sanger GDSC1 IC50) was significantly negatively correlated with the expression of 3 key transcriptional regulators that controlled mitochondrial biogenesis and were positively selected in CRISPR/Cas9 screening (P < .05). Altogether, the results demonstrated that mitochondrial function state appears to be highly relevant to panobinostat sensitivity, and activating mitochondrial function could be a strategy to sensitize tumor cells to panobinostat. Validation of this finding in a large cohort of patients with ALL is warranted because it has immediate clinical relevance in helping us determine which population of patients would benefit from panobinostat therapy.
The SIRT1 and HDAC1 genes were the two significant hits among all HDACs identified by our CRISPR screening assays. A few factors might have contributed to strong effects of HDAC1 and SIRT1 over other genes in this family. First, it has been reported that panobinostat targets class I, II, and IV HDACs with limited effects on class III HDACs (sirtuins).16 Second, some HDAC genes are not abundantly expressed in ALL and thus are less likely to be involved in panobinostat response in this context. We analyzed the expression of all 4 class HDAC genes using RNA-seq data from St. Jude Cloud (the Pecan portal) and observed substantial variation in their expression pattern: HDAC1, HDAC7, and SIRT1 are highly expressed, whereas HDAC10, HDAC11, and SIRT4 expression is low in ALL. We reason that these highly expressed HDAC genes are more likely to be identified by CRISPR screen. Finally, our CRISPR screen relies on the fold of sgRNA enrichment to quantify the influence of a given gene on drug resistance. This assay strongly favors genes that confer the greatest resistance (eg, those with HDAC1 deletion) because they would outgrow all other clones eventually and become predominant in the cell pool. Cells with the deletion of other HDAC genes may be modestly resistant to panobinostat and enriched at early time point of drug incubation, but over time, they would be diluted in the pool and be taken over by cells lacking HDAC1. For this reason, hits from our CRISPR screen represent those with the strongest effects on drug resistance, but we cannot rule out the contribution of other genes that did not meet our stringent cutoffs. One of the top-ranked genes revealed by our screen is SIRT1, which belongs to the class III HDACs and could not directly be targeted by panobinostat.16 SIRT1 is an NAD+-dependent protein deacetylase involved in multiple pathways, such as aging and metabolic disorders.44-46 Cumulative evidence has supported the involvement of SIRT1 in cancer progression.54-57 SIRT1 exerts its tumor suppression activity by inhibiting oxidative stress, whereas SIRT1 also provides cancer cells with survival advantages through P53 inactivation and MYC activation.57,58 Importantly, SIRT1 also contributes to tyrosine kinase inhibitors resistance in chronic myeloid leukemia through PGC1-1α deacetylation–induced oxidative phosphorylation hyperactivity.56 However, in the context of acute myeloid leukemia, SIRT1 activator resveratrol could sensitize acute myeloid leukemia cells to HDAC inhibitors.59 Altogether, these previous findings indicates that the role of SIRT1 in cancer progression is in a context-dependent manner and dependent on cross talk between drug combinations. In this study, we found manipulating the expression of SIRT1 affected panobinostat sensitivity in ALL; overexpressing it sensitized ALL to panobinostat. A negative correlation between panobinostat sensitivity (Sanger GDSC1 IC50) and SIRT1 expression was revealed by association analysis across diverse cancer cell lines (P < .05, N = 571) from the DepMap database, suggesting the result was robust in multiple cancers. Meanwhile, Scuto et al60 also reported that the SIRT1 activator could sensitize lymphoid malignancies to panobinostat, which further confirmed our findings that SIRT1 was a determinant of ALL response to panobinostat. Mechanically, SIRT1 activated the transcription of mitochondrial-related genes, and mitochondrial activity such as oxidative phosphorylation and the TCA cycle was enhanced on SIRT1 overexpression, which was consistent with the prominent role of SIRT1 in mitochondrial biogenesis.45,47 SIRT1 deacetylates PGC1-1α, and active PGC1-1α binds and activates essential downstream genes for mitochondrial replication and respiration function. It was thus not surprising that 3 key regulators (ie, POLG, TFB1M, and GABPA) of mitochondrial biogenesis were positively enriched in the CRISPR/Cas9 screening, and mitochondrial-related processes were enriched as major pathways that conferred panobinostat resistance. ROS production during mitochondrial OXPHOS plays important roles in stress response and cell apoptosis; however, we did not observe altered ROS level of Nalm6 control cell, SIRT1 disturbed cell, and SIRT1 OE cell after being treated with different dosages of panobinostat (supplemental Figure 10), indicating other mechanisms other than ROS is involved in panobinostat-mediated cytotoxicity. The intrinsic apoptosis pathway controlled by mitochondria is determined by the relative quantities of antiapoptotic and proapoptotic proteins in the BCL-2 family.32 We observed a more significant elevation of PMAIP1 in SIRT1-overexpressed cells than SIRT1 knockout cells on panobinostat exposure, accompanied by increased cleaved PARP referred to as effectors of apoptosis. Noteworthy, PMAIP1 was also ranked as 1 of the top enriched genes, which further demonstrated the importance of the SIRT1-mitochondria-PMAIP1 axis in the sensitivity of ALL to panobinostat (Figure 6G). MTT assay was performed to test the effect of SIRT1 disturbing in Nalm6 on response to the other 2 HDAC inhibitors, namely chidamide and vorinastat, and conventional chemotherapeutic agents used in the treatment of ALL (ie, l-asparaginase, cytarabine, 6-mecaptopurine, vincristine, dexamethasone, and daunorubicin) and found SIRT1 disturbing in Nalm6 led to resistance to these 2 HDACi compounds in Nalm6, whereas they did not affect its sensitivity to conventional drugs (supplemental Figures 11 and 12).This result suggests that SIRT1 may broadly modulate leukemia sensitivity to HDAC inhibitors (beyond ponabinostat), and future studies are warranted to better understand the shared mechanism of HDCAi response in ALL. Although the SIRT1-mitochondria-PMAIP1 pathway was identified as a determinant of panobinostat sensitivity by in vitro ALL cell lines assays, further experiments from patient-derived samples and mouse models are warranted to consolidate these findings. Whether B- and T-cell acute lymphoblastic leukemia (T-ALL) shared the same sensitivity and mechanism involved in SIRT1-mediated panobinostat sensitivity is also warranted for further study.
Our results suggested that patients with higher expression of SIRT1 might benefit from panobinostat therapy. We reanalyzed the SIRT1 expression of ALL samples from St. Jude Cloud and found that patients with MEF2D-rearrangement (MEF2Dr), ZNF-rearrangement (ZNFr), hyperdiploid, mixed-lineage leukemia gene rearrangement, and TCF3-PBX1 showed relatively higher expression of SIRT1, whereas patients with ETV6-RUNX1 and BCR-ABL1 fusion genes showed relatively lower SIRT1 expression (supplemental Figure 9B), pointing to subtypes that might benefit from panobinostat therapy. High SIRT1 expression in mixed-lineage leukemia-rearranged ALL suggest that this ALL subtype might be more sensitive to panobinostat, in line with the notion that infant ALL is particularly sensitive to this drug.18
In conclusion, our CRISPR/Cas9 screening uncovered an SIRT1-mitochondria-PMAIP1 pathway that was determinant of ALL response to panobinostat. This finding potentiates the possibility that patients with higher expression of SIRT1 or hyperactivity of mitochondria function may benefit from panobinostat therapy in ALL. Our data provide a rational basis for panobinostat in combination with mitochondrial activators to overcome resistance.
Acknowledgments
This work was supported by research grants from St. Baldrick’s Foundation International Scholar (581580) and the National Natural Science Foundation of China (82170152) to H.Z. M.Q. is supported by the Program for Professor of Special Appointment (Eastern Scholar) at Shanghai Institutions of Higher Learning and the National Natural Science Foundation of China (81973997). J.J.Y. is supported by National Institutes of Health grants GM118578 and GM115279 and receives funding from Takeda Pharmaceutical Company for research unrelated to this work.
Authorship
Contribution: C.J., S.S., H.Z., and J.J.Y. drafted and revised the manuscript; C.J., Y.G., and G.D. performed functional studies; C.J., M.Q., and W.Y. conducted statistical analysis; J.J.Y. and H.Z. designed and supervised the study; and all authors approved the final manuscript.
Conflict-of-interest disclosure: The authors declare no competing financial interests.
The current affiliation for H.Z. is Department of Hematology and Oncology, Fujian Branch of Shanghai Children’s Medical Center, Fujian Children’s Hospital, Fuzhou, China.
Correspondence: Jun J. Yang, Department of Pharmaceutical Sciences, St Jude Children’s Research Hospital, MS313, 262 Danny Thomas Pl, Memphis, TN 38105; e-mail: jun.yang@stjude.org; and Hui Zhang, Department of Hematology & Oncology, Shanghai Children’s Medical Center, Shanghai Jiao Tong University School of Medicine, 1678 Dongfang Rd, Shanghai 200127, China; e-mail: zhang-hui@scmc.com.cn.

