

Key Points
ER-Hoxb8 conditional immortalization provides a system for the study of TAFAZZIN deficiency in myeloid progenitors and mature neutrophils.
Barth syndrome (ie, TAFAZZIN-deficient) murine neutrophils may be more sensitive to apoptosis, possibly because of increased ER stress.

Abstract
Barth syndrome is an inherited X-linked disorder that leads to cardiomyopathy, skeletal myopathy, and neutropenia. These symptoms result from the loss of function of the enzyme TAFAZZIN, a transacylase located in the inner mitochondrial membrane that is responsible for the final steps of cardiolipin production. The link between defective cardiolipin maturation and neutropenia remains unclear. To address potential mechanisms of neutropenia, we examined myeloid progenitor development within the fetal liver of TAFAZZIN knockout (KO) animals as well as within the adult bone marrow of wild-type recipients transplanted with TAFAZZIN-KO hematopoietic stem cells. We also used the ER-Hoxb8 system (estrogen receptor fused to Hoxb8) of conditional immortalization to establish a new murine model system for the ex vivo study of TAFAZZIN-deficient neutrophils. The TAFAZZIN-KO cells demonstrated the expected dramatic differences in cardiolipin maturation that result from a lack of TAFAZZIN enzyme activity. Contrary to our hypothesis, we did not identify any significant differences in neutrophil development or neutrophil function across a variety of assays including phagocytosis and the production of cytokines or reactive oxygen species. However, transcriptomic analysis of the TAFAZZIN-deficient neutrophil progenitors demonstrated an upregulation of markers of endoplasmic reticulum stress and confirmatory testing demonstrated that the TAFAZZIN-deficient cells had increased sensitivity to certain ER stress-mediated and non-ER stress-mediated triggers of apoptosis. Although the link between increased sensitivity to apoptosis and the variably penetrant neutropenia phenotype seen in some patients with Barth syndrome remains to be clarified, our studies and new model system set a foundation for further investigation.
Introduction
Barth syndrome (BTHS) is a rare inherited X-linked disorder characterized by cardiomyopathy, skeletal muscle myopathy, and neutropenia.1,2 This disease arises following a loss-of-function mutation in the gene TAFAZZIN (TAFAZZIN, which has also been previously annotated as TAZ).3 TAFAZZIN is a mitochondrial enzyme that processes cardiolipin, a phospholipid that is found almost exclusively in the inner mitochondrial membrane.4 The lack of normal TAFAZZIN protein activity abrogates the final step in cardiolipin maturation, resulting in reduced levels of cardiolipin with greater acyl chain diversity and greater saturation, as well as elevated levels of an intermediate, monolysocardiolipin, that contains 3 rather than 4 acyl chains.5
The clinical manifestation with the overall highest mortality is cardiomyopathy, which can progress to heart failure.6 The link between TAFAZZIN deficiency and myopathy has been explained by the high mitochondrial content of myocytes and by their dependence on efficient oxidative respiration. The components of the electron transport chain are colocalized with cardiolipin in the inner mitochondrial membrane, and their structural organization within the membrane lipid bilayer is dependent on mature cardiolipin, which is lacking in individuals with BTHS.7,8 The role of cardiolipins within the mitochondria also goes beyond a structural one, with proposed roles in signaling, in modulating reactive oxygen species (ROS), and in mitochondrial membrane potential and apoptosis (reviewed elsewhere9,10 ).
In addition to cardiomyopathy, many individuals with BTHS suffer from recurrent episodes of neutropenia and life-threatening infections. The neutropenia has variable penetrance and is frequently intermittent. The mechanistic link between TAFAZZIN deficiency and neutropenia is not known.5,11,12 Unlike cardiac and skeletal myocytes, neutrophils have relatively few mitochondria per cell, and it was assumed that neutrophils rely on glycolysis for energy production, though this assumption has more recently been challenged (reviewed in Kumar and Dikshit13 ). Within lymphoblasts derived from patients with BTHS, mitochondria display ultrastructural abnormalities, showing reduced cristae density, poorly aligned cristae, and fragmented cristae distribution.14 However, information on proliferation, survival, or function of neutrophils in the patient with BTHS is scarce. It is unclear if the underlying mechanism of neutropenia in BTHS is due to diminished production or increased clearance of mature neutrophils (eg, increased apoptosis).15-17
Animal models of BTHS have included zebrafish, drosophila, and mouse and have been used primarily in the study of the cardiomyopathy and skeletal muscle defects.18-21 One murine model of BTHS involves knockdown of TAFAZZIN by a doxycycline-inducible short hairpin RNA (shRNA).21-23 Hematologic abnormalities in this model have not been characterized in depth, and the cardiac manifestations are mild and late in onset, likely because of residual TAFAZZIN expression.
More recently, a global TAFAZZIN-knockout (KO) mouse model (C57BL6/J) was developed that emulates many of the hallmark clinical presentations of BTHS.25 Most of these mice die during the perinatal period from skeletal muscle weakness. Those few mice that survive into adulthood develop progressive cardiomyopathy and cardiac fibrosis. The number of circulating neutrophils in TAFAZZIN-KO mice that survive to adulthood (6 months) is reportedly lower than in wild-type (WT) mice (P < .01, data found in online Figure V of Wang et al25 ).
Recent studies have pointed toward the importance of endoplasmic reticulum (ER) stress and the unfolded protein responses in neutrophil survival, differentiation, and function.19-21 The expression of ER stress markers PERK and ATF6 are decreased during neutrophil differentiation in a stage-specific manner, suggesting that dysregulation of ER stress in neutrophils may affect the differentiation process. These authors linked mitochondrial adenosine triphosphate (ATP) production and ER stress, showing that lower ATP supply from mitochondria promoted higher ER stress, which subsequently impaired protein folding and myeloid differentiation.19 These data suggest a mechanistic link between mitochondrial defects, ER stress, and an unfolded protein responses, ultimately resulting in decreased neutrophil survival and function.
Here, we investigated the pathogenesis of neutropenia in TAFAZZIN-KO mice. We took advantage of our established ER-Hoxb8 system of conditional immortalization to generate granulocyte-monocyte progenitors from TAFAZZIN-KO and WT murine fetal liver hematopoietic progenitors.22 These progenitors are capable of unlimited culture and expansion ex vivo as well as synchronous differentiation to mature and functional neutrophils upon inactivation of the ER-Hoxb8 protein. Overall, our in vitro and in vivo findings point toward a mechanism of ER stress and apoptosis underlying the phenotype of neutropenia in patients with BTHS.
Methods
Mice and animal housing
The tafazzin (TAZ) knockout (KO) mouse model was developed by Dr. Douglas Strathdee of the Cancer Research UK Beatson Institute in the C57BL/6J background and generously provided by Dr. Strathdee via Dr. William Pu at Boston Children’s Hospital.24,25 Wild type (WT) CD45.1 B6.SJL-Ptprca Pepcb/BoyJ mice were purchased from Jackson Laboratories. Wild type CD45.1STEM mice (CD45.1 congenic mice) were generated, bred, and maintained at Massachusetts General Hospital (MGH) as described.26 Mice were maintained under pathogen-free conditions and experiments were approved by the MGH Institutional Animal Care and Use Committee (IACUC).
Genotyping protocol
Isolation of genomic DNA was performed using Qiagen’s DNEasy Blood & Tissue kit. Primers for TAFAZZIN genotyping are shown in Table 1 all three primers were combined and used at a final concentration of 1 µM with a Taq polymerase from Takara (Catalog #, R001). DMSO (1 µl to a final 20 µl reaction) was included in each reaction mixture. 35 cycles of PCR were performed under the following conditions: 95°C × 30 s; 67°C × 1 min; 72°C × 1 min. Samples were analyzed on a 2% agarose gel.
Primers used for genotyping PCR
| Primer | Sequence (5’-3’) | Expected size (bp) |
|---|---|---|
| WT-U1 | CTTGCCCACTGCTCACAAAC | 383 |
| WT-D1 | CAGGCACATGGTCCTGTTTC | |
| KO-U1 | CCAAGTTGCTAGCCCACAAG | 280 |
| Primer | Sequence (5’-3’) | Expected size (bp) |
|---|---|---|
| WT-U1 | CTTGCCCACTGCTCACAAAC | 383 |
| WT-D1 | CAGGCACATGGTCCTGTTTC | |
| KO-U1 | CCAAGTTGCTAGCCCACAAG | 280 |
Primers for the GENDER genotyping and the expected results are shown in Table 2.27 The same PCR conditions were used as described above.
Primers used for gender genotyping PCR
| Primer | Sequence (5’-3’) | Expected size (bp) |
|---|---|---|
| Sex primer-F | CACCTTAAGAACAAGCCAATACA | X chromosome = 269bp |
| Sex primer-R | GGCTTGTCCTGAAAACATTTGG | Y chromosome = 353bp |
| Primer | Sequence (5’-3’) | Expected size (bp) |
|---|---|---|
| Sex primer-F | CACCTTAAGAACAAGCCAATACA | X chromosome = 269bp |
| Sex primer-R | GGCTTGTCCTGAAAACATTTGG | Y chromosome = 353bp |
Fetal liver cell isolation
Timed pregnancies were arranged, and pregnant females euthanized on different embryonic days. Fetal livers from CD45.2 wild-type or TAZ-KO littermate embryos were dissected, and limb tissue was collected for the preparation of genomic DNA for genotyping (see Genotyping below). Fetal livers were macerated into a single-cell suspension using the sterile plunger from a 5 cc syringe through a 40 µm filter into 5 mL of Ammonium-Chloride-Potassium (ACK) buffer for red blood cell (RBC) lysis. After 5 minutes of RBC lysis, the single-cell suspension was passed through another 40 µm filter into a 50 ml conical tube and the tonicity restored by the addition of fluorescence-activated cell sorting (FACS) buffer (PBS + 2% FBS + 1 mM EDTA). The cells were counted with the use of acridine orange (ThermoFisher A3568, final concentration ∼1 ug/ml) to count nucleated cells and to distinguish from remaining red blood cells. Fetal liver cells were collected by centrifugation (5 minutes at 500 g) and resuspended in FACS buffer prior to analysis or in PBS prior to transplantation.
Immunophenotyping of myeloid progenitor and stem cell compartments
For immunophenotypic evaluation of the stem cell compartment, fetal liver cells were stained with following fluorescently labeled mouse antibodies (Table 3) and a lineage cocktail of biotinylated anti- mouse antibodies (B220, CD3, CD8, Mac1, Gr1, Ter119) for 45 min at 4°C (Table 4). Cells were washed and stained with the Streptavidin BUV395 or Streptavidin BV650 for 15 min at 4°C. Cells were washed, resuspended in FACS buffer, and analyzed by flow cytometry on an LSRII or Celesta (BD Biosciences). Flow cytometry data were analyzed by FlowJo software.
Antibodies used in flow cytometry
| Marker | Clone | Color | Company | Catalog # |
|---|---|---|---|---|
| CD45 | 30-F11 | PE/Dazzle 594 | BioLegend | 103145 |
| CD45.1 | A20 | FITC | BioLegend | 110706 |
| CD45.1 | A20 | PE/Cy7 | BioLegend | 110730 |
| CD45.1 | A20 | BV421 | BioLegend | 110731 |
| CD45.2 | 104 | PE | Thermo Fisher | 12-0454-83 |
| CD45.2 | 104 | APC/Cy7 | BioLegend | 109824 |
| CD3 | 145-2C11 | APC | BioLegend | 100312 |
| B220 (CD45R) | RA3-6B2 | eFluor 450 | Thermo Fisher | 48-0452-82 |
| CD11b (Mac-1) | M1/70 | AF700 | BioLegend | 101222 |
| CD11b (Mac-1) | M1/70 | APC | BioLegend | 101212 |
| CD11b (Mac-1) | M1/70 | BUV737 | BD Biosciences | 564443 |
| Ly-6C/G (Gr-1) | RB6-8C5 | BV570 | BioLegend | 108431 |
| Ly-6C/G (Gr-1) | RB6-8C5 | PE/Cy7 | Thermo Fisher | 25-5931-82 |
| Ly-6C | HK1.4 | BV711 | BioLegend | 128037 |
| Ly-6G | 1A8 | APC/Cy7 | BioLegend | 127623 |
| CD117 (c-KIT) | 2B8 | PE | BioLegend | 105808 |
| CD117 (c-Kit) | 2B8 | APC | BioLegend | 105812 |
| Sca-1 | D7 | BV421 | BioLegend | 108128 |
| CD34 | RAM34 | FITC | Thermo Fisher | 11-0341-85 |
| CD16/32 | 2.4G2 | BV605 | BD Biosciences | 563006 |
| CD16/32 | 93 | PE/Cy7 | BioLegend | 101318 |
| CD48 | HM48-1 | APC/Cyanine7 | BioLegend | 103432 |
| CD150 | TC15-12F12.2 | APC | BioLegend | 115909 |
| 7-AAD | BD Pharmingen | 51-68981E |
Lineage-cocktail antibodies used in flow cytometry
| Marker | Clone | Color | Company | Catalog # |
|---|---|---|---|---|
| Ter-119 | Ter-119 | Biotin | BD Biosciences | 553672 |
| B220 (CD45R) | RA3-6B2 | Biotin | BD Biosciences | 553086 |
| CD3e | 145-2C11 | Biotin | BD Biosciences | 553060 |
| CD4 | GK1.5 | Biotin | BD Biosciences | 553728 |
| CD8a | 53-6.7 | Biotin | BD Biosciences | 553029 |
| CD11b (Mac-1) | M1/70 | Biotin | BD Biosciences | 553309 |
| Ly-6C/G (Gr-1) | RB6-8C5 | Biotin | BD Biosciences | 553125 |
| SA (Streptavidin) | n/a | BUV395 | BD Biosciences | 564176 |
| SA (Streptavidin) | n/a | BV650 | BioLegend | 405231 |
ER-Hoxb8-GMP cell line development
ER-Hoxb8-granulocyte monocyte progenitor (GMP) cell lines were established as previously described.22 Freshly isolated WT or TAZ-KO fetal liver cells placed into culture in RPMI 1640 supplemented with 10% FBS, 1% penicillin/streptomycin, stem cell factor (SCF, 10 ng/ml), interleukin (IL)-3 (10 ng/ml), and IL-6 (10 ng/ml). Tissue culture plates (12-well) were coated overnight with human plasma fibronectin (Diluted in PBS from 10 mg/ml stock to 100 ug/ml, 500 ul per well) in the tissue culture incubator. The fibronectin was aspirated prior to plating of cells the following day.
At ∼36 hours, the fetal liver cells were counted using acridine orange and their concentration adjusted to ∼500,000/ml. Polybrene (10 mg/ml stock) was added to the cells at a concentration of 24 ug/ml and 500 ul of cells (∼250,000 cells) was added to the 12-well plate. Retrovirus (MSCVneo-HA-ER-Hoxb8, ecotropic pseudotype) was added to each well resulting in a final polybrene concentration of 8 ug/ml. The cells were transduced by spinoculation (1,000 x g, 60 min, RT).
Following the spinoculation, 3 ml of proliferation media was added to each well to dilute the polybrene. ER-Hoxb8 cells were maintained in R10%/SCF/E2 media: RPMI 1640 supplemented with 10% fetal bovine serum (FBS), 1% penicillin/streptomycin, SCF and beta-estradiol (abbreviated E2). The final concentration of SCF was approximately 50 ng/ml and was added as 1% conditioned media collected from a CHO-SCF expressing cell line. Beta-estradiol (E2, Sigma E2578) was added to a final concentration of 0.5 uM from a 10-mM stock dissolved in 100% ethanol.
Single cell cloning was performed by limiting dilution or FACS to place a single WT or TAZ-KO cell ER- HOX-B8 GMP in 250 ul of media in each well of a round-bottom 96-well plate. This generally results in a cloning efficiency of 10-20% (i.e., single cell clones in ∼10-20 wells with clones emerging after ∼10-12 days.
Differentiation of the WT or TAZ-KO GMPs to neutrophils was accomplished by simply washing cells free of beta-estradiol and culturing in the same media (R10%/SCF) in the absence of E2 for 4-days.
Fetal liver cell transplantation
One day prior to transplantation, CD45.1 B6.SJL-Ptprca Pepcb/BoyJ WT mice were irradiated (600 cGy x 2 doses separated by ∼ 6 hours). On the day of transplantation, fetal livers were isolated from either C57BL/6-CD45.2 -WT or C57BL/6-CD45.2 -TAZ-KO embryos on E15.
In addition to the fetal liver cells, bone marrow cells from a CD45.1 WT mouse were isolated as a source of helper cells for transplantation. Following euthanasia, the femur and tibia bones were dissected, and bones were crushed using the back of a sterile 50 ml conical tube into ∼12 ml of FACS buffer. The single cell suspension was transferred through a 40 µM filter into a 50 ml conical tube. Cells were pelleted, resuspended in 4 ml FACS buffer, and then layered onto 4 ml of Ficoll-Paque PLUS gradient. The cells were centrifuged at 400 g x 25 min at RT. Live mononuclear cells were collected from the Ficoll interface, washed in PBS and counted using acridine orange (Cellometer automated cell conter, Nexcelom).
Irradiated CD45.1 recipient WT mice were injected retro-orbitally with either WT- or TAZ-KO fetal liver cells along with helper marrow cells (details in Table 5). Hematopoiesis was assessed by engraftment results obtained by complete blood counts (CBCs) every 4 weeks up to 16 weeks accompanied by immunophenotyping via flow cytometric analysis. For immunophenotyping, peripheral blood cells were collected via retro-orbital bleeding. RBCs were removed by washing cells with ACK lysis buffer. Cells were stained with mouse antibodies, CD45.1-FITC and CD45.2-APC/Cy7 (BioLegend) for quantification of transplanted mononuclear cells.
Cell numbers used in the fetal liver transplantation experiments
| Transplant | Fetal liver cell age | Fetal liver cell count | Helper marrow cell count |
|---|---|---|---|
| #1 | E 15 | 2.4 million | 0.5 million |
| #2 | E 15.5 | 1.3 million | 0.1 million |
| Transplant | Fetal liver cell age | Fetal liver cell count | Helper marrow cell count |
|---|---|---|---|
| #1 | E 15 | 2.4 million | 0.5 million |
| #2 | E 15.5 | 1.3 million | 0.1 million |
Neutrophil differentiation and Wright-Giemsa staining
For in vitro differentiation, GMPs were washed free of beta-estradiol in PBS and cultured in R10%/SCF without E2 for 4 days. Differentiated cells at day 4 were collected and resuspended in PBS at a concentration of approximately 2 million/ml. Cytospin (Thermo Scientific) preparations were prepared by pre-wetting the filter with 100 ul of PBS (1,000 rpm, 60 s) followed by the application of cells (100 ul, ∼200,000 cells, 1,000 rpm, 60 s). As a side note, contrary to popular belief, longer or faster centrifugation times are not required for nice Cytospins. Cells were air-dried and then stained in 100% Wright-Giemsa stain (Siemens, CAT# 23-044626) for 4 min, and in 20% Wright-Giemsa diluted in buffer for 12 minutes. Stained cells were rinsed by dipping in deionized water (we typically use 3 to 4 chambers to ensure good rinsing and a clean background), and coverslips were affixed with Permount™ mounting media prior to microscopy. Images were captured using a 100x oil-immersion lens.
Transmission electron microscopy
WT and TAZ-KO mouse neutrophils were cultured with and without estrogen for four days. Cultured neutrophils were gently pelleted, then fixed in 0.15 M cacodylate buffered 3% glutaraldehyde with 2 mM CaCl2 overnight at ambient temperature. Samples were rinsed in buffer then immersed in cacodylate buffered 2% OsO4 for 90 minutes. Samples were rinsed in water, then stained enbloc with 1% Uranyl acetate overnight at 4 C, rinsed in water, dehydrated in a graded series of ethanol to 100%, then transferred to 100% acetone. Samples were infiltrated with Spurrs’ epoxy and polymerized overnight at 70 C. Sections 80 nm in thickness were collected onto formvar coated slot grids, stained in uranyl acetate followed by lead citrate and examined using a FEI G20 TEM operated at 120KV.
Immunoblotting
WT and TAZ-KO GMPs were collected, and cell lysates prepared by resuspending the cells in loading buffer (NuPAGE LDS sample buffer, CAT NP0008) supplemented with 2-mercaptoethanol. The viscous cell lysate was immediately loaded into a QIAshredder (Qiagen) and centrifuged at 10,000 g for 30 seconds followed by immediate heat denaturation (95°C for 5 minutes). This rapid processing of cell pellets directly into the SDS-containing loading buffer helps to ensure that there is no protein degradation. While this processing is not typically necessary for most cells, it seems that the myeloid progenitors have enough protease activity in their granules that protein degradation can be a major problem with most standard processing techniques.
Immunoblotting was performed with mouse anti-Cox IV (Cell signaling Technology) and mouse anti- TAZ (gift from Dr. Steve Claypool, Johns Hopkins University) antibodies. The blot and blot intensities were imaged and quantified with the Odyssey CLx machine (Li-Cor).
Cardiolipin measurements
Cardiolipins were measured through lipidomics analysis at the Harvard Center for Mass Spectroscopy. ER-Hoxb8 GMPs (WT and TAZ-KO, 10 million cells each) were processed in ice-cold methanol and non-polar metabolites were extracted using methanol-chloroform phase separation (methanol:water:chloroform in 2:1:4 ratio). Lipidomic profiling was then performed on the chloroform fractions on a Thermo Fisher Q‐exactive equipped with HESI source and BioBond column (50x4.6 mm, 5 µm C4; Dikmatech). A volume of 20 µl was injected and the full mass spectrum was obtained in negative mode (0 to 60 minutes, resolution 70,000, AGC target 1e6, m/z range 150 to 2000; dd-MS2: resolution 35,000, AGC target 1e5). Mobile phase A consisted of 0.03% ammonium hydroxide, 5% methanol, in water and mobile phase B of 0.03% ammonium hydroxide, 5% water, 35% methanol, 60% isopropanol. Analysis was performed in an untargeted manner using the LipidSearch software (Thermo Fisher Scientific).
Gene expression analysis by RNA-sequencing
Total RNA was prepared from five million WT or TAZ-KO GMPs using the RNeasy-Plus Mini Kit (QIAGEN). In addition to the genomic DNA removal column, the optional on-column DNAse digestion was performed to further deplete contaminating genomic DNA. Libraries were prepared with an RNA- seq library preparation kit (E7490, NEB) and were sequenced on Illumina HiSeq 2500 instrument, resulting in ∼30 million 50 bp reads per sample.
RNA-seq reads were aligned to the mouse transcriptome (ENSEMBL annotation of mm9 reference genome, NCBI Build 37) using STAR (Dobin et al., 2013). Read counts for individual genes were produced using HTSeq (Anders et al., 2015). Differential expression analysis was performed using the EdgeR (Robinson et al., 2010) after normalizing read counts and including only those genes with CPM > 1 for one or more samples.
DAVID 6.7 was used for analysis of differentially expressed genes obtained from the expression profile data. Gene ontology options GOTERM_BM_ALL (p value < 10 − 7) and GOTERM_KEGG PATHWAY were selected, and a functional annotation heatmap was generated using JavaTreeview. The raw data are available in GEO (GSE151006).
In vitro phagocytosis and imaging flow cytometry
WT or TAZ-KO GMPs were differentiated out of E2 for a period of 4 days. Cells were resuspended in media with fluorescein-labeled heat-killed Escherichia coli or Staphylococcus aureus bioparticles (Molecular Probes) at a ratio of 1:3. Cells and bioparticles were agitated gently for 45 min at 37°C. Cells were washed in PBS and resuspended in FACS buffer for flow cytometry. Cells were also stained with mouse antibody CD11b-APC and DAPI as a viability dye prior to Imaging flow cytometry. The data were collected with the help of Scott Mordecai in the Department of Pathology flow and Image Cytometry Core (Amnis ImageStream, EMD Millipore).
In vivo phagocytosis
Fluorescein-labeled heat-killed E. coli bioparticles (100 µg) resuspended in PBS were injected into the peritoneal cavity of WT recipient mice that had been previously transplanted with either WT or TAZ-KO fetal liver cells and allowed to engraft and reconstitute for a minimum of 16 weeks. After 3 hours, peritoneal cells were collected by instilling 10 ml of FACS buffer into the peritoneum of a euthanized mouse (21 G syringe) and then removed as much fluid as could be obtained using a syringe affixed to a 16 G needle. The cells were washed and stained with DAPI as well as the following mouse antibodies: CD45.1-PeCy7, CD45.2-PE, CD11b-APC, Ly6C-BV711, Ly6G-APC-Cy7 (BioLegend). Flow cytometry was performed to identify bioparticles engulfed by neutrophils.
Detection of cytokine and protease secretion from WT or TAZ-KO neutrophils
The amount of tumor necrosis factor alpha (TNF-α) (R&D system, DY410-05), neutrophil elastase (R&D system, DY4517-05), and lipocalin-2 (R&D system, DY1857-05) from WT and TAZ-KO mature neutrophils was measured by ELISA according to the manufacturer’s instructions. Briefly, 100,000 neutrophils were counted and plated in 96 well round bottom plates and incubated with 10 ng/ml lipopolysaccharide (LPS, Invivogen) for 4 hours at 37°C. Cells were pelleted (1000 x g, 10 minutes) and the cell culture supernatant collected for the ELISA assay. Cell pellets were collected for the measurement of total protein (QuantiPro BCA Assay kit, Sigma-Aldrich) as a means of normalization in addition to the cell counts.
Evaluation of Reactive Oxygen Species (ROS) in neutrophils
Neutrophil activation assay via SeaHorse assay.
The agilent Seahorse XF Neutrophil Acivation Assay was performed according to the manufacturer’s instructions. Briefly, neutrophils were seeded on Cell-Tak (Corning, # 354240) coated 96 well cell culture microplates at a density of 1 X 10⁵ cells per well. The cell culture microplate was centrifuged for 1 min at 200 g to adhere the cells to the plate and incubated at 37°C without CO2 for 45 min prior to XF assay. A pre-hydrated XF cartridge was loaded with Rot/AA and PMA then the plate with a cartridge was placed in the XF instrument. During the assay, an initial injection of inhibitors rotenone and antimycin A (Rot/AA) to discard mitochondrial contribution to OCR, was followed by an injection of activator, 100 ng/ml PMA. The XF instrument monitors and measured the oxygen consumption rate (OCR) from cells for up to 240 minutes. The final OCR values were automatically calculated in Wave Software (version 2.4). During the assay, an additional 96 well plate with 1X10⁵ cells per well was prepared to perform CellTiter-Glo (CTG, Promega) assay for quantifying viable cells. The OCR values were normalized to CellTiter-Glo (CTG, Promega) assay data.
Cytochrome C assay.
One day prior to the assay, 1/3 of a 96 well Immulon I 4HBX Flat-bottom plate (Thermo Scientific, #1424578) was coated with 100 µl of RGD peptide (15 µg/ml, diluted in HBSS with Ca2+ or Mg2+ buffer solution (HBSS+/+), Sigma Aldrich, F8141) and the plate incubated overnight at room temperature. 100 µl of HBSS+/+ was added into all other wells. On the day of the assay, the wells were emptied and 100 µl of PBS + 10% FBS was added to each well and the plate was incubated at 37°C for 30 min and then washed one time with HBSS+/+.
Differentiated neutrophils were collected by gentle pipetting to avoid mechanical activation and were washed 3x in HBSS without Ca2+ or Mg2+ (HBSS-/-). Centrifugation steps were done at 250 g for 5 min to minimize mechanical stimulation. After the last wash, cells were counted and resuspended in HBSS+/+ buffer (at a concentration of 100,000 cells per 40 µl) and allowed to ‘rest’ for at least 2 hours at RT. Cells (40 µl) were plated into each well and Cytochrome C (50 µl, 200 mM in HBSS+/+, Sigma Aldrich) was added. Following the addition of Cytochrome C, 10 µl of PMA (250 nM, Sigma Aldrich) or fMLP (10 µM, Sigma Aldrich) diluted in HBSS+/+ was added into each well to stimulate cells for ROS production.
Reduction of Cytochrome C was quantified by measured fluorescence at two wavelengths (550 minus 490) via plate reader (Synergy HTX, BioTek). The fluorescence measurements were recorded every 2 minutes over the course of one hour. The concentration of superoxide was calculated, graphed, and the area under the curve was calculated using Prism software. The CellTiter-Glo (CTG, Promega) assay was performed to quantify viable cells in each well before the Cytochrome C assay for the purpose of normalization.
H2DCFDA.
After serial incubation steps with HBSS-/- and HBSS+/+ buffers, 500 µl of cells (100,000 cells) were transferred into FACS tubes. Then cells were incubated with 5 µM H2-DCFDA (Thermo Fisher Scientific) diluted in HBSS+/+ in the dark for 15 minutes at 37°C. Cells were washed with HBSS+/+ twice and resuspended in 500 µl of HBSS+/+ with 50 µl of PMA, fMLP, or RGD. All centrifugation was done at 250g for 5 minutes. Immediately after adding stimuli, the mean fluorescence intensities from each FACS tubes were measured at 15 minutes.
MitoSOX.
Mitochondrial-derived ROS (mtROS) were detected in cells (100,000) stained at 37°C for 20–30 min with 5 µM MitoSOX™ Red (ThermoFisher Scientific, M36008). After staining, the cells were washed and analyzed by flow cytometry within 10–20 min of the completion of staining. To increase mtROS production, neutrophils were incubated with PMA (250 nM) for 45 minutes prior to the MitoSOX staining.
In vitro apoptosis assays
Cells (10,000) were counted and plated into the wells of a 96 well flat-bottom plate in a volume of 100 µl. The opaque Corning 96-well solid white flat bottom polystyrene TC-treated microplates were used for these luminescence-based assays (Product 3917). Varying concentrations of ABT199, AMG173, or Thapsigargin (Cayman Chemical Company) dissolved at 10 mM in DMSO were added to each well using an HP D300e digital dispenser (Tecan) (Table 6). After incubation for 24 hours (tissue culture incubator), 100 µl of CellTiter-Glo® was added to each well and incubated for 10 minutes at RT prior to luminescent recording. (As an editorial note, we have taken to using the CellTiter-Glo reagent at a dilution of 1:1 in PBS. A comparison of dilutions in PBS up to 1:8 were equivalent for assays where the final cell # did not exceed 40,000 cells per well).
Compounds and chemicals
| Compound | Company | Catalog | Note |
|---|---|---|---|
| ABT199 | Cayman Chemical Company | 16233 | Dissolved in DMSO |
| Thapsigargin | Cayman Chemical Company | 10522 | Dissolved in DMSO or EtOH/PBS |
| Tunicamycin | Sigma-Aldrich | T7765 | Dissolved in DMSO |
| AMG 176 | ChemieTek | CT-AMG176 | Dissolved in DMSO |
Induction of in vivo ER stress and evaluation of ER stress markers in neutrophils
After 16 weeks, CD45.1 B6.SJL-Ptprca Pepcb/BoyJ WT mice transplanted with either CD45.2 WT- or TAZ-KO fetal liver cells were intraperitoneally injected with Tg dissolved in DMSO (1 mg/kg). After 3h, the mice were anesthetized for retroorbital peripheral blood sampling. Peripheral blood was placed into ACK lysis buffer for 5 min. Cells were then centrifuged 2,000 g x 5 min at RT and pellets were resuspended in PBS for further flow cytometry.
Quantification of ER stress markers by intracellular flow cytometry
At first, cells were incubated with 100 µl of CD16/32 Fc block diluted 1/50 in PBS for 15 min at 4°C. After wash, cells were stained in PBS with CD45.2-APC/Cy7, CD45.1-BV421, CD11b-BUV737, Ly- 6G/C-PE/Cy7 mouse antibodies (Table 7), and a LIVE/DEAD™ fixable dead cell stain (Thermo Fisher Scientific; Cat# L34961) in the dark for 30 min at RT. Then cells were washed, pelleted, and fixed with Cytofix/Cytoperm Fixation & Permeabilization (BD Biosciences). Samples were washed twice with 1X BD Perm/Wash™ Buffer (BD Biosciences) + 2% FBS (WashB), being pelleted at 1,000 g x 5 min at 4°C. Then cells were incubated overnight at 4°C with the following mouse primary antibodies: ATF-4 (Cell Signaling Technology), AFT-6 (Cell Signaling Technology), BiP (Cell Signaling Technology), CHOP (Cell Signaling Technology), phospho-eIF2α (Cell Signaling Technology), or phospho-PERK (Thermo Fisher Scientific). The next day, samples were washed four times and pelleted. Cells were incubated with a donkey anti-rabbit AF488 secondary antibody (Thermo fisher Scientific) for 1-hour at 4°C, after which cells were washed four times and pelleted. Samples were then resuspended in FACS buffer and analyzed on an LSRII (BD Biosciences).
Antibodies used for intracellular staining
| Marker | Clone | Color | Company | Catalog # |
|---|---|---|---|---|
| ATF4 | D4B8 | - | Cell Signaling | 11815S |
| ATF6 | D4Z8V | - | Cell Signaling | 65880S |
| BiP | C50B12 | - | Cell Signaling | 3177S |
| CHOP | D46F1 | - | Cell Signaling | 5554S |
| p-eIF2a | D9G8 | - | Cell Signaling | 3398S |
| p-PERK | Thr982 | - | Thermo Fisher | PA5-102853 |
| beta-Actin | 13E5 | - | Cell Signaling | 4970S |
| Donkey anti-rabbit | AF488 | Invitrogen | A-21206 |
Quantification of mitochondrial DNA
Multiple nuclear and mitochondrial genes were selected to evaluate the relative copy number of mitochondrial DNA and nuclear DNA (Table 8). A comparison of mtDNA expression relative to nDNA expression was utilized to determine the mtDNA:nDNA copy number ratio.28
Primers used for qPCR to determine mitochondrial copy #
| Mitochondrial | Primer | Sequence |
|---|---|---|
| ND1 (JS) | Forward | CTAGCAGAAACAAACCGGGC |
| Reverse | CCGGCTGCGTATTCTACGTT | |
| ND3 (TB) | Forward | GCATTCTGACTCCCCCAAAT |
| Reverse | TGAATTGCTCATGGTAGTGGA | |
| 12S (TB) | Forward | ACCGCGGTCATACGATTAAC |
| Reverse | CCCAGTTTGGGTCTTAGCTG | |
| 16S (JS) | Forward | GCAATTATTCCCCATGAACG |
| Reverse | CCGCAAGGGAAAGATGAAAGAC |
| Genomic | Primer | Sequence |
|---|---|---|
| 18S (TB) | Forward | CGCGGTTCTATTTTGTTGGT |
| Reverse | AGTCGGCATCGTTTATGGTC | |
| SEMA (GS) | Forward | ACCGATTCCAGATGATTGGC |
| Reverse | TCCATATTAATGCAGTGCTTGC | |
| HK2 (JS) | Forward | GCCAGCCTCTCCTGATTTTAGTGT |
| Reverse | GGGAACACAAAAGACCTCTTCTGG |
Nuclear and mitochondrial DNA was prepared from GMP clones using Qiagen's QIAamp DNA Mini Kit. We did perform the ‘optional’ RNAse digestion, which greatly improved the quality of our data. Once the DNA was extracted quantified (NanoDrop), the samples were diluted to 5 ng/uL. For each gene, a 10 µM working stock mastermix of forward and reverse primers was prepared from a 100 µM primer stock solution. Mastermixes for each primer set were prepared as follows (per well): forward and reverse primers 1 µl (10 µM stock, final concentration 500 nM), Biorad Syber Green 10 µl, water 7 µl. In 96-well plate format, 18 µl of mastermix was added and 2 µl (10 ng) of DNA combined for a total of 20 ul/well. For each gene and each sample quadruplicate wells were used. Plates were sealed and qPCR performed (Biorad).
Isolation of mitochondria from the ER-Hoxb8 GMP
Mitochondria were isolated using Qiagen’s Qproteome Mitochondria Isolation Kit (37612). Given the low number of mitochondria per cell, we started the protocol with 40 million cells and followed the additional recommended steps for isolation of “high-purity mitochondria”. Mitochondria were resuspended in 50 µl of the Mitochondrial Storage Buffer and stored at (-)80°C.
Blue native polyacrylamide gel electrophoresis (BN-PAGE)
Isolated mitochondria samples were thawed on ice and 20 ul of cellular mitochondrial protein corresponding to the mitochondria from 16 million cells were treated with 1.5 ul of the detergent n- Dodecyl-b-D-maltoside (DDM) prepared at 10% in water (89903, Thermo Scientific) and incubated on ice for 10 min. The samples were centrifuged at 20,000 x g for 30 min at 4°C, the pellet was discarded, and the supernatant transferred to new microcentrifuge tubes. 1.5 ul of 1.25% Coomassie brilliant blue G-250 (20279, Thermo Scientific) dye and 2 ul of glycerol was added to samples, mixed and 25 ul was loaded to each well of a pre-cast 3-12% Bis-Tris native PAGE gel (BN1001BOX, Invitrogen). The NativeMarkTM unstained protein standard (LC0725, Invitrogen) was used as a molecular weight marker.
Electrophoresis was performed using the XCellTM SurelockTM Mini-Cell blot module (Invitrogen). Dark blue cathode buffer (1 X Native PAGETM running buffer with 0.05% NativePAGETM cathode buffer additive, by Invitrogen, BN2001 and BN2002 respectively) was added to the inner chamber of the blot module and the anode buffer (1 X Native PAGETM running buffer) was added to the outer chamber (Alba Timon-Gomez et al., Star Protocols, 2020; Edgard M. Mejia et al., J. Biol. Chem., 2018). The gel was run at a constant voltage of 100 V for 1 h at 4°C whereby the dark blue cathode buffer was replaced with the light blue cathode buffer (1 X Native PAGETM running buffer with 0.005% NativePAGETM cathode buffer additive) and run at 200 V for 2h at 4°C.
After the electrophoresis the gel was fixed and incubated with 0.25% Coomassie brilliant blue G-250 staining solution (40% methanol and 7% acetic acid) for 30 min at room temperature. The staining solution was removed and replaced with Coomassie destaining solution (40% methanol and 7% acetic acid) and placed on a rocker for 3h. The gel was scanned and the bands corresponding to the mitochondrial supercomplexes were quantified with the Odyssey CLx machine (Li-Cor).
Statistical analyses
Statistical methods as well as the number of clones and independent experiments is listed on the Figures or within the Figure Legends.
Study approval
All animal experiments were approved by the Massachusetts General Hospital (MGH) Institutional Animal Care and Use Committee (IACUC).
Results
TAFAZZIN-deficient mice demonstrate normal fetal liver hematopoietic development
We hypothesized that the loss of TAFAZZIN may result in a defect in myelopoiesis that would be exacerbated during periods of stress or infectious challenge. Unfortunately, the majority of TAFAZZIN-knockout (TAFAZZINnull/Y; abbreviated in the figures as TAZ-KO) mice do not survive into adulthood, preventing a straightforward analysis of adult hematopoiesis.18
In the developing embryo, blood development occurs in the fetal liver (beginning around embryonic day [E]11.5) before the hematopoietic stem cells migrate to bone marrow.23 To investigate whether the TAFAZZIN deficiency results in impaired neutrophil development, we characterized the myeloid progenitors within the hematopoietic compartment of TAFAZZIN-KO and WT (TAFAZZINWT/Y) fetal livers at 5 time points (E14-E16) along embryonic development (Figure 1B). Using timed pregnancies, fetal livers were dissected and dissociated into single-cell suspensions for antibody staining and flow cytometry (the gating strategy is indicated in Figure 1A).29 Of note, the percent of lineage negative, KITPOS cells was much higher in the fetal liver hematopoietic cells as compared with adult murine bone marrow. Polymerase chain reaction (PCR)-based genotyping distinguished WT from TAFAZZIN-KO embryos (supplemental Figure 1A) and distinguished male from female embryos (supplemental Figure 1B).
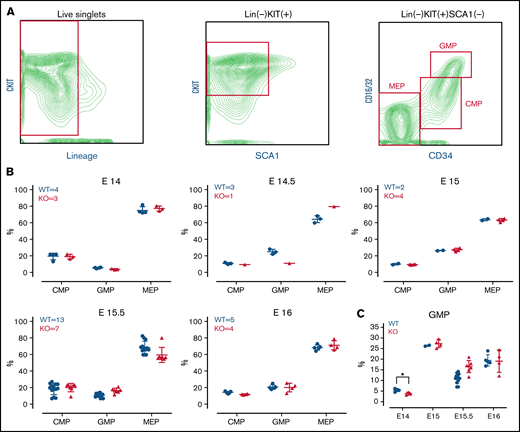
TAFAZZIN is dispensable for fetal liver myelopoiesis. (A) Flow cytometry gating strategy for fetal liver myeloid progenitor populations. Common myeloid progenitors (CMPs), megakaryocyte-erythrocyte progenitors (MEPs), and granulocyte-macrophage progenitors (GMPs) were identified based on CKIT, SCA1, CD16/32, and CD34 staining. (B) Myeloid progenitors were enumerated in the WT or TAFAZZIN-KO fetal livers harvested at embryonic days 14, 14.5, 15, 15.5, and 16. The numbers of fetal livers included in the analysis is indicated. (C) A focus on the frequency of GMPs, combined from the other panels, within the fetal livers of WT or TAFAZZIN-KO embryos shows as significant difference only at E14. Error bars indicate the mean ± SD. t tests were performed. *P < .05. Other results are not statistically significant.
TAFAZZIN is dispensable for fetal liver myelopoiesis. (A) Flow cytometry gating strategy for fetal liver myeloid progenitor populations. Common myeloid progenitors (CMPs), megakaryocyte-erythrocyte progenitors (MEPs), and granulocyte-macrophage progenitors (GMPs) were identified based on CKIT, SCA1, CD16/32, and CD34 staining. (B) Myeloid progenitors were enumerated in the WT or TAFAZZIN-KO fetal livers harvested at embryonic days 14, 14.5, 15, 15.5, and 16. The numbers of fetal livers included in the analysis is indicated. (C) A focus on the frequency of GMPs, combined from the other panels, within the fetal livers of WT or TAFAZZIN-KO embryos shows as significant difference only at E14. Error bars indicate the mean ± SD. t tests were performed. *P < .05. Other results are not statistically significant.
Analysis of the TAFAZZIN-deficient E14 and E14.5 embryos suggested a lower percentage of granulocyte monocyte progenitors (GMPs) as compared with their WT littermates (Figure 1C), though statistical power is limited by the limited number of embryos per litter and the lack of multiple replicates at each time point. This difference was abrogated at the E15, E15.5, and E16 time points, where the distribution of myeloid progenitors was strikingly similar between KO and WT embryos (Figure 1B). Overall, these experiments suggest that the lack of TAFAZZIN activity may result in slightly delayed, but ultimately normal myeloid progenitor development.
TAFAZZIN deficiency does not affect adult hematopoiesis
Most TAFAZZIN-KO animals die in the perinatal stage, making an analysis of the adult bone marrow compartment challenging. To investigate the developmental potential of TAFAZZIN-deficient hematopoietic stem cells and myeloid progenitors, we used a strategy of fetal liver stem cell transplantation.30,31
This experiment was performed twice, and the results are presented in Figure 2 and supplemental Figure 2. In the first experiment, E15 embryos (2 WT males and 4 TAFAZZIN-KO males) were genotyped, pooled, and transplanted into WT recipients (Figure 2A). Here, the fetal liver hematopoietic cells are marked with CD45.2, whereas the lethally irradiated, WT recipients are the congenic CD45.1STEM strain.26 CD45.1STEM helper bone marrow was also provided given the limited number of fetal liver cells.

TAFAZZIN deficiency leads to a mild peripheral leukopenia in adult mice. (A) Schematic outlining the approach of transplanting fetal liver cells from WT or TAFAZZIN-KO donors (CD45.2) into WT recipient mice (CD45.1). CD45.1 and CD45.2 staining of leukocytes in the peripheral blood quantifies the degree and contribution of engraftment. (B) The frequency of CD45.2 donor cells, both WT and TAFAZZIN-KO, in the peripheral blood remains stable following transplantation. (C) Complete blood counts of the peripheral blood demonstrate a mild leukopenia in mice transplanted with TAFAZZIN-KO fetal liver cells. (D) Flow cytometry was used to enumerate specific populations within the peripheral blood, with a focus on the transplanted CD45.2 cells. The lack of TAFAZZIN results in significantly fewer B cells, T cells, myeloid cells, and neutrophils. (E) Flow cytometric analysis of mature and progenitor populations within the bone marrow did not reveal any differences between mice reconstituted with WT or TAFAZZIN-KO fetal liver cells. Error bars indicate the mean ± SD. t tests were performed. **P < .01; ***P < .001; ****P < .0001. NS, not statistically significant.
TAFAZZIN deficiency leads to a mild peripheral leukopenia in adult mice. (A) Schematic outlining the approach of transplanting fetal liver cells from WT or TAFAZZIN-KO donors (CD45.2) into WT recipient mice (CD45.1). CD45.1 and CD45.2 staining of leukocytes in the peripheral blood quantifies the degree and contribution of engraftment. (B) The frequency of CD45.2 donor cells, both WT and TAFAZZIN-KO, in the peripheral blood remains stable following transplantation. (C) Complete blood counts of the peripheral blood demonstrate a mild leukopenia in mice transplanted with TAFAZZIN-KO fetal liver cells. (D) Flow cytometry was used to enumerate specific populations within the peripheral blood, with a focus on the transplanted CD45.2 cells. The lack of TAFAZZIN results in significantly fewer B cells, T cells, myeloid cells, and neutrophils. (E) Flow cytometric analysis of mature and progenitor populations within the bone marrow did not reveal any differences between mice reconstituted with WT or TAFAZZIN-KO fetal liver cells. Error bars indicate the mean ± SD. t tests were performed. **P < .01; ***P < .001; ****P < .0001. NS, not statistically significant.
The contribution of the donor WT and TAFAZZIN-KO cells remained stable over 12 weeks posttransplant, as demonstrated by peripheral blood sampling (Figure 2B). The percentage of CD45.2 white blood cells was on average 79% and 63% in the WT fetal liver into WT recipients and TAFAZZIN-KO fetal liver into WT recipients transplants, respectively. The stability of the %CD45.2 over time suggested that the TAFAZZIN-KO cells had similar reconstitution potential in the hematopoietic system. It is possible that we simply transplanted fewer hematopoietic stem cells, and possible that the TAFAZZIN-KO cells had slightly lower engraftment potential. The mice were considered to have stable reconstitution at 16 weeks, establishing a cohort of mice specifically lacking TAFAZZIN in their hematopoietic system.
At approximately 16 weeks, analysis of the complete blood counts of these transplanted mice consistently demonstrated leukopenia (Figure 2C) in the setting of normal peripheral red blood cell and platelet counts. Flow cytometric analysis of the peripheral blood cells, with a focus on cells derived from the transplanted fetal liver cells (CD45.2+) revealed fewer white blood cells across the spectrum of B, T, and myeloid cells without the specific loss of any compartment (Figure 2D; gating strategy, supplemental Figure 2D). Analysis of the bone marrow compartment was performed by flow cytometry (Figure 2E; gating strategy, supplemental Figure 2E); no differences were detected within the bone marrow mature or progenitor populations when comparing mice transplanted with WT or TAFAZZIN-KO fetal liver cells.
In the second experiment, E15.5 embryos (4 WT males and 1 TAFAZZIN-KO male) were genotyped, pooled, and transplanted. Analysis of reconstitution (supplemental Figure 2A), complete blood counts (supplemental Figure 2B), and flow cytometric characterization of peripheral blood leukocytes (supplemental Figure 2C) was entirely consistent with our first experiment. The degree of fetal liver cell (CD45.2) reconstitution at 16 weeks was slightly less in the TAFAZZIN-KO transplants (89%) compared with the WT transplants (95%), again suggesting simple technical variability or a mild defect in engraftment. The bone marrow compartment of these mice was not assayed because the mice were used for the in vivo phagocytosis experiments described later.
Overall, these experiments point toward a mild and consistent leukopenia in the mice transplanted with the TAFAZZIN-KO fetal liver cells. This leukopenia manifests as a mild decrease across lineages, including peripheral B cells, T cells, myeloid cells, and neutrophils.
The ER-Hoxb8 system of conditional immortalization establishes TAFAZZIN-deficient GMPs
The ER-Hoxb8 system was first described in 2006 and has been adopted by more than 125 laboratories worldwide as a model for the study of myeloid progenitors and their mature progeny cells including neutrophils, monocytes, eosinophils, basophils, and dendritic cells.32 The retrovirally delivered ER-Hoxb8 protein is constitutively expressed but active only in the presence of supra-physiologic concentrations (0.5 µM) of β-estradiol (E2). While active, ER-Hoxb8 arrests myeloid differentiation at the GMP stage of development, allowing for their continuous self-renewal and propagation ex vivo. Upon removal of E2, which inactivates the ER-Hoxb8 protein, the cells undergo synchronous and terminal differentiation to mature neutrophils over approximately 4-days.
Following transduction of wild-type and TAFAZZIN-KO fetal liver cells, we generated conditionally immortalized GMP populations and then single-cell clones in the presence of stem cell factor and E2 (Figure 3A). The genotype of the clones (C, F, I, and L) was confirmed by PCR; immunoblotting confirmed the lack of TAFAZZIN protein expression (Figure 3B). The proliferation rate varied slightly from clone to clone, though overall the TAFAZZIN-KO GMPs proliferated more slowly than the WT GMPs. Both WT and TAFAZZIN-KO GMPs exhibited normal morphologic differentiation to mature neutrophils as evidence by Wright-Giemsa staining of Cytospin preparations 4 days out from E2 (Figure 3C; supplemental Figure 3A). Both WT and TAFAZZIN-KO GMPs exhibited the expected acquisition of CD11b and GR1 cell-surface staining upon withdrawal of E2 and differentiation (Figure 3D). Multiple WT and TAFAZZIN-KO clones were analyzed for mitochondrial content using parallel methods of quantitative reverse transcriptase PCR (supplemental Figure 3B) and MitoTracker staining (supplemental Figure 3C). The lack of TAFAZZIN did not lead to a significant change in the mitochondrial content of the GMP clones.
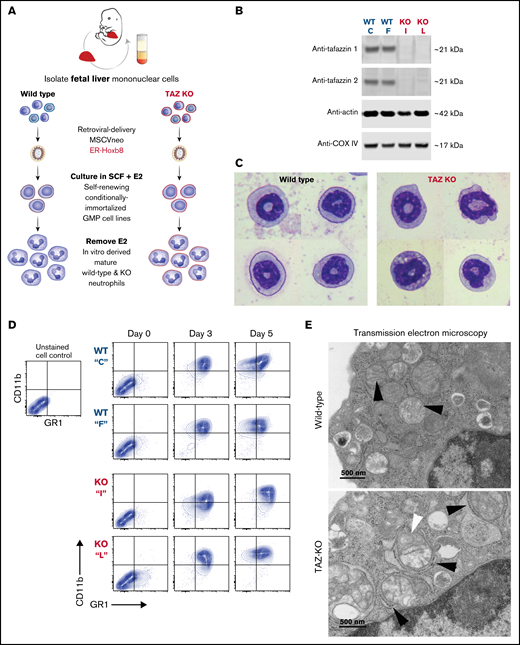
Conditionally immortalized GMPs generated from WT and TAFAZZIN-KO fetal liver hematopoietic progenitors. (A) Schematic outlining the generation of conditionally immortalized WT and TAFAZZIN-KO GMPs via the retroviral expression of the ER-Hoxb8 fusion protein, resulting in unlimited ex vivo expansion of progenitors in the presence of estrogen. (B) Immunoblotting confirms the absence of TAFAZZIN expression in the TAFAZZIN-KO GMPs using 2 different antibodies; β-actin and COX-IV are included as housekeeping controls. (C) Wright-Giemsa staining of WT and TAFAZZIN-KO mature neutrophils. (D) Cell-surface staining of CD11b (Mac1) and GR1 (Ly6G/C) was assayed by flow cytometry in the GMPs (day 0) and as the cells differentiated out of estrogen to mature neutrophils (days 3 and 5). There was no apparent difference between WT and TAFAZZIN-KO clones. (E) Transmission electron microscopy of WT and TAFAZZIN-KO GMPs demonstrated more distinct mitochondrial cristae in the WT cells (black arrows, top), with spiral cristae structures more prevalent in the KO (white arrow, bottom). In many cases, the mitochondria within the TAFAZZIN-KO cells were encircled by RER (black arrows, bottom). Scale bar: 500 nm.
Conditionally immortalized GMPs generated from WT and TAFAZZIN-KO fetal liver hematopoietic progenitors. (A) Schematic outlining the generation of conditionally immortalized WT and TAFAZZIN-KO GMPs via the retroviral expression of the ER-Hoxb8 fusion protein, resulting in unlimited ex vivo expansion of progenitors in the presence of estrogen. (B) Immunoblotting confirms the absence of TAFAZZIN expression in the TAFAZZIN-KO GMPs using 2 different antibodies; β-actin and COX-IV are included as housekeeping controls. (C) Wright-Giemsa staining of WT and TAFAZZIN-KO mature neutrophils. (D) Cell-surface staining of CD11b (Mac1) and GR1 (Ly6G/C) was assayed by flow cytometry in the GMPs (day 0) and as the cells differentiated out of estrogen to mature neutrophils (days 3 and 5). There was no apparent difference between WT and TAFAZZIN-KO clones. (E) Transmission electron microscopy of WT and TAFAZZIN-KO GMPs demonstrated more distinct mitochondrial cristae in the WT cells (black arrows, top), with spiral cristae structures more prevalent in the KO (white arrow, bottom). In many cases, the mitochondria within the TAFAZZIN-KO cells were encircled by RER (black arrows, bottom). Scale bar: 500 nm.
On very rare occasions, TAFAZZIN-KO animals survive the perinatal period into adulthood. The unexpected availability of a TAFAZZIN-KO adult mouse and WT male littermate control permitted the isolation and morphologic analysis of Cytospin preparations by Wright-Giemsa staining of primary bone marrow neutrophils (supplemental Figure 3E). The appearance of the primary neutrophils was similar to the ER-Hoxb8-derived neutrophils, and in neither setting did the lack of TAFAZZIN change the morphologic appearance of the cells.
Loss of TAFAZZIN results in ultrastructural changes within the mitochondria
Transmission electron microscopy was performed on WT and TAFAZZIN-KO GMPs and mature neutrophils. Within the progenitors, mitochondrial size appeared equal but mitochondrial cristae were more distinct in the WT cells and spiral structures more prevalent in the TAFAZZIN-KO cells (Figure 3E; supplemental Figure 4A). Intriguingly, the TAFAZZIN-KO mitochondria were often entirely encircled by rough ER (Figure 3E; supplemental Figure 4C). These same findings persisted in the mature neutrophils (Figure 3E; supplemental Figure 4B).
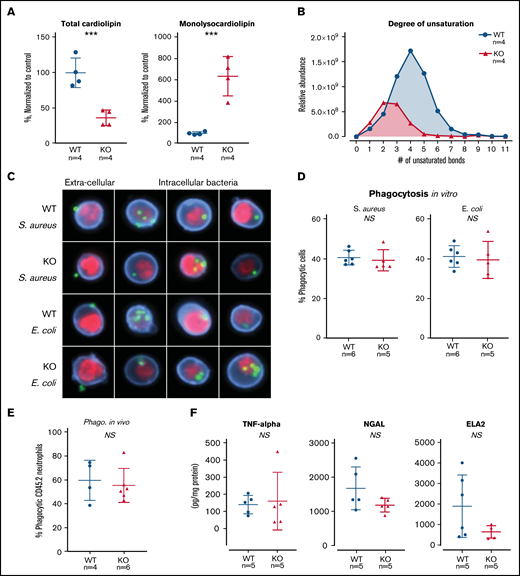
TAFAZZIN deficiency results in cardiolipin changes but does not affect neutrophil function. (A) Quantification of cardiolipin and monolysocardiolipin content in WT and TAFAZZIN-KO GMPs. Total CL and monolysocardiolipin values are normalized to the average of WT cells. (B) The degree of unsaturation within the cardiolipin acyl chains was compared between WT and TAFAZZIN-KO cells. The average of the 4 clones is displayed, demonstrating the expected decrease in number of unsaturations in the TAFAZZIN-KO cells. (C) Imaging flow cytometry was used to confirm phagocytosis of FITC-labeled BioParticles within the WT or TAFAZZIN-KO mature neutrophils. The intracellular S aureus or E coli BioParticles (green) can be quantified separated from the extracellular particles simply adherent to the cell’s surface. CD11b (blue) was used to highlight the membrane and 4′,6-diamidino-2-phenylindole (red) the nuclei of the neutrophils. (D) The degree of in vitro phagocytosis was quantified by flow cytometry across multiple WT and TAFAZZIN-KO clones. This assay was performed on 3 independent occasions. (E) In vivo analysis of phagocytosis was performed in a limited number of adult mice (CD45.1) that had been transplanted with WT or TAFAZZIN-KO fetal liver hematopoietic cells (CD45.2), as described in Figure 2A. Mice received an intraperitoneal injection of BioParticles and peritoneal fluid was collected at 3 hours for flow cytometric analysis. This experiment was performed twice and data from both experiments combined. (F) The amount of TNF-α, NGAL, and ELA2 secreted from LPS-stimulated (4 hours, 10 ng/mL) mature neutrophils was quantified by enzyme-linked immunosorbent assay. This experiment was performed twice. Error bars indicate the mean ± SD. t tests were performed. ***P < .001. NS, not statistically significant.
TAFAZZIN deficiency results in cardiolipin changes but does not affect neutrophil function. (A) Quantification of cardiolipin and monolysocardiolipin content in WT and TAFAZZIN-KO GMPs. Total CL and monolysocardiolipin values are normalized to the average of WT cells. (B) The degree of unsaturation within the cardiolipin acyl chains was compared between WT and TAFAZZIN-KO cells. The average of the 4 clones is displayed, demonstrating the expected decrease in number of unsaturations in the TAFAZZIN-KO cells. (C) Imaging flow cytometry was used to confirm phagocytosis of FITC-labeled BioParticles within the WT or TAFAZZIN-KO mature neutrophils. The intracellular S aureus or E coli BioParticles (green) can be quantified separated from the extracellular particles simply adherent to the cell’s surface. CD11b (blue) was used to highlight the membrane and 4′,6-diamidino-2-phenylindole (red) the nuclei of the neutrophils. (D) The degree of in vitro phagocytosis was quantified by flow cytometry across multiple WT and TAFAZZIN-KO clones. This assay was performed on 3 independent occasions. (E) In vivo analysis of phagocytosis was performed in a limited number of adult mice (CD45.1) that had been transplanted with WT or TAFAZZIN-KO fetal liver hematopoietic cells (CD45.2), as described in Figure 2A. Mice received an intraperitoneal injection of BioParticles and peritoneal fluid was collected at 3 hours for flow cytometric analysis. This experiment was performed twice and data from both experiments combined. (F) The amount of TNF-α, NGAL, and ELA2 secreted from LPS-stimulated (4 hours, 10 ng/mL) mature neutrophils was quantified by enzyme-linked immunosorbent assay. This experiment was performed twice. Error bars indicate the mean ± SD. t tests were performed. ***P < .001. NS, not statistically significant.
Loss of TAFAZZIN in myeloid progenitors results in expected increase in monolysocardiolipin
The ER-Hoxb8 WT and TAFAZZIN-KO GMPs provided an unlimited source of homogenous progenitors for lipodomic analysis following methanol-chloroform extraction from 4 WT and 4 TAFAZZIN-KO clones. The total pool of cardiolipin was significantly reduced in the TAFAZZIN-KO cells with the expected shift toward the accumulation of monolysocardiolipin (Figure 4A). When looking at specific species of cardiolipins and enumerating the number of unsaturations (eg, double bonds) within the 4 cardiolipin lipid tails, there was a clear distinction with the expected complete lack of highly unsaturated cardiolipins in the TAFAZZIN-KO cells (Figure 4B), consistent with published findings.24
Loss of TAFAZZIN does not affect neutrophil phagocytosis or cytokine production
The terminally differentiated neutrophil has myriad effector functions for efficient pathogen clearance including phagocytosis, cytokine production, and the release of antimicrobial proteins. The ER-Hoxb8 GMPs were differentiated ex vivo and experiments performed 4 days following removal of E2. Mature neutrophils were incubated with fluorescently labeled BioParticles Staphylococcus aureus (S aureus) and Escherichia coli (E coli) to assess phagocytic capacity. Imaging flow cytometry (ImageStream) confirmed the process of phagocytosis by demonstrating that bacteria were truly internalized as compared with stuck to the extracellular membrane (Figure 4C). The capacity for phagocytosis of both S aureus and E coli in vitro was strikingly similar across multiple WT and TAFAZZIN-KO clones (Figure 4D).
To examine phagocytosis in vivo, we took advantage of WT mice that had received hematopoietic stem cell transplantations from both WT and TAFAZZIN-KO fetal livers, as described previously (Figure 2A). At 20 weeks posttransplant, >85% of their hematopoietic cells were derived from the transplanted fetal liver cells (CD45.2) and could be distinguished from host (CD45.1) on the basis of CD45 staining. These mice received a single intraperitoneal injection of fluorescently labeled E coli BioParticles to stimulate neutrophil recruitment and phagocytosis within the peritoneal cavity. At 3 hours postinjection, there was no difference in the degree of recruitment (data not shown) or in the degree of in vivo phagocytosis (Figure 4E) between WT and TAFAZZIN-KO neutrophils.
In similar fashion to the in vitro phagocytosis assays described, ER-Hoxb8 neutrophils were stimulated with lipopolysaccharide (LPS) as a strong TLR4 agonist mimicking infection with gram-negative rod bacteria. Using enzyme-linked immunosorbent assay, we quantified the production and release of tumor necrosis factor α (TNF-α), neutrophil elastase (ELA2), and neutrophil gelatinase associated lipocalin (NGAL). Similar to our phagocytosis assays, there were no significant differences between WT and TAFAZZIN-KO clones in their ability to produce TNF-α, ELA2, or NGAL (Figure 4F). In addition, there were no significant differences in the ability of mature neutrophils to migrate across a semipermeable transwell membrane in response to LPS stimulation (supplemental Figure 3D).
Together, these results suggest that TAFAZZIN is dispensable for the terminal neutrophil effector functions of phagocytosis, cytokine production, and antimicrobial granule release.
Loss of TAFAZZIN does not affect neutrophil production of ROS
Neutrophils generate a variety of ROS for pathogen killing including superoxide (O2−) and hydrogen peroxide (H2O2). Figure 5A outlines some of the commonly understood ROS pathways as well as the reagents used to measure and to distinguish the different species. Using the ER-Hoxb8 mature neutrophils, we compared oxygen consumption, superoxide generation, and hydrogen peroxide generation between the WT and TAFAZZIN-KO cells.
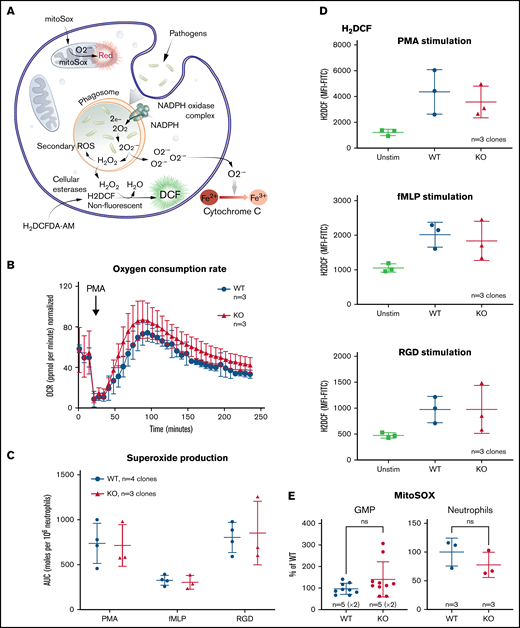
The loss of TAFAZZIN does not affect the production of neutrophil reactive oxygen species. (A) Schematic outlining commonly understood ROS pathways as well as reagents used to quantify and distinguish the different species within neutrophils. Microbial pathogens can be recognized and engulfed by neutrophils. In the process of phagocytosis, neutrophils activate membrane-associated NADPH oxidase to generate a powerful oxidative burse (measured by the Seahorse assay). During this oxidative burst, oxygen is consumed generating ROS including superoxide (O2−) (measured by the Cytochrome C assay) and hydrogen peroxide (H2O2) (measured by the H2DCF assay). The mitochondria are also an important source of ROS, in particular, O2− (measured by the MitoSOX reagent). (B) The oxygen consumption rate (OCR) was measured within the XF Neutrophil Activation Assay. Cells were stimulated with PMA, 100 ng/mL and OCR monitored over 240 minutes. This experiment was performed twice. (C) WT and TAFAZZIN-KO neutrophils were stimulated with PMA, fMLP, or RGD and the production of superoxide monitored over 60 minutes. The total superoxide (area under the curve) is displayed. This experiment was performed 3 times. (D) WT and TAFAZZIN-KO neutrophils were stimulated with PMA, fMLP, or RGD; the conversion of H2DCF to its fluorescent product was quantified by flow cytometry and displayed as mean fluorescence intensity (MFI). Unstimulated cells are displayed as a negative control. This experiment was performed 3 times. (E) Mitochondrial ROS was quantified by MitoSOX staining and flow cytometry in both GMPs and mature neutrophils. Data are displayed the MFI normalized to the WT clones. This experiment was performed twice (GMP) and once (neutrophils). Error bars indicate the mean ± SD. t tests were performed. NS, not statistically significant.
The loss of TAFAZZIN does not affect the production of neutrophil reactive oxygen species. (A) Schematic outlining commonly understood ROS pathways as well as reagents used to quantify and distinguish the different species within neutrophils. Microbial pathogens can be recognized and engulfed by neutrophils. In the process of phagocytosis, neutrophils activate membrane-associated NADPH oxidase to generate a powerful oxidative burse (measured by the Seahorse assay). During this oxidative burst, oxygen is consumed generating ROS including superoxide (O2−) (measured by the Cytochrome C assay) and hydrogen peroxide (H2O2) (measured by the H2DCF assay). The mitochondria are also an important source of ROS, in particular, O2− (measured by the MitoSOX reagent). (B) The oxygen consumption rate (OCR) was measured within the XF Neutrophil Activation Assay. Cells were stimulated with PMA, 100 ng/mL and OCR monitored over 240 minutes. This experiment was performed twice. (C) WT and TAFAZZIN-KO neutrophils were stimulated with PMA, fMLP, or RGD and the production of superoxide monitored over 60 minutes. The total superoxide (area under the curve) is displayed. This experiment was performed 3 times. (D) WT and TAFAZZIN-KO neutrophils were stimulated with PMA, fMLP, or RGD; the conversion of H2DCF to its fluorescent product was quantified by flow cytometry and displayed as mean fluorescence intensity (MFI). Unstimulated cells are displayed as a negative control. This experiment was performed 3 times. (E) Mitochondrial ROS was quantified by MitoSOX staining and flow cytometry in both GMPs and mature neutrophils. Data are displayed the MFI normalized to the WT clones. This experiment was performed twice (GMP) and once (neutrophils). Error bars indicate the mean ± SD. t tests were performed. NS, not statistically significant.
Neutrophils were stimulated by phorbol 12-myristate 13-acetate (PMA), an activator of protein kinase C, and oxygen consumption monitored over time using the Seahorse XF platform; there was no significant difference when comparing WT and TAFAZZIN-KO cells (Figure 5B).
Neutrophils were stimulated with PMA as well as the chemotactic peptide formyl-methionyl-leucyl-phenylalanine (fMLP), or the multivalent peptide poly-arginine-glycine-aspartate (poly-RGD). Extracellular superoxide anion production was measured over time using a technique of cytochrome C reduction and the area under the curve was calculated as a measure of total superoxide production (Figure 5C). There were no differences in superoxide production of neutrophils when comparing WT and TAFAZZIN-KO clones.
The cell-permeant dye fluorescein 2′, 7′-dichlorodihydrofluorescein diacetate can be converted intracellularly to the fluorescent molecule 2′, 7′-dichlorofluorescein (DCF) in the presence of intracellular H2O2. Thus, the accumulation of DCF, and of green fluorescence, can be monitored by flow cytometry as a surrogate of intracellular H2O2. WT and TAFAZZIN-KO neutrophils responded similarly to the 3 stimuli of PMA, fMLP, and RGD in terms of H2O2 production and DCF fluorescence (Figure 5D).
WT and TAFAZZIN-KO GMPs and mature neutrophils were assayed under homeostatic conditions to measure the amount of mitochondrial superoxide using the dye indicator MitoSOX. There was no significant difference between the 2 genotypes in terms of the amount of measurable mitochondrial superoxide (Figure 5E).
Together, these results suggest that TAFAZZIN is dispensable for the generation of ROS in response to multiple stimuli within the context of the mature neutrophil.
The loss of TAFAZZIN does not affect mitochondrial complex assembly
Given the role of mature cardiolipin in the organization of the inner mitochondrial membrane and the close relationship with complexes and supercomplexes of the electron transport chain,31-36 we examined the effect of TAFAZZIN deficiency on complex assembly in our model GMP cell lines. Following the isolation of purified mitochondrial, a system of Blue Native polyacrylamide gel electrophoresis (BN-PAGE) was used to separate the high-molecular-weight complexes under nondenaturing conditions.37-39 These were stained with Coomassie Brilliant Blue G-250 (Figure 6A) and quantification done on the LI-COR scanner because Coomassie can be readily imaged in the 700-nm channel (Figure 6B). A comparison of 3 WT and 3 TAFAZZIN-KO clones did not reveal significant differences in mitochondrial complex assembly in our model GMPs. Higher molecular weight supercomplexes were not readily visible in the mitochondrial isolated from our neutrophil progenitors. Overall, these results are consistent with previous results in WT and BTHS human lymphoblasts, where the RNA interference knockdown of TAFAZZIN in the WT lymphoblasts did not lead to changes in the mitochondrial complexes.39
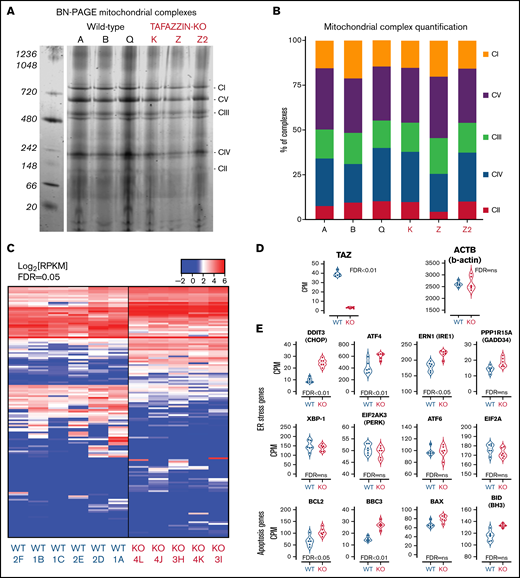
Transcriptomic analysis implicates genes associated with endoplasmic reticulum stress-induced apoptosis. (A) BN-PAGE of purified mitochondrial from three WT ER-Hoxb8 clones and three TAFAZZIN-KO clones. The gel is Coomassie stained. The 5 mitochondrial supercomplexes are highlighted on the right. (B) Following quantification of the mitochondrial supercomplexes, the relative contributions of each supercomplex within each clone depicted. (C) Heat map representation of gene expression from WT (n = 6) and TAFAZZIN-KO (n = 5) GMP clones. (D) TAFAZZIN is the most highly differentially expressed gene. (E) The count per million (CPM) are displayed for select genes involved in mediated ER stress and apoptosis. The false discovery rate (FDR) is displayed with each gene.
Transcriptomic analysis implicates genes associated with endoplasmic reticulum stress-induced apoptosis. (A) BN-PAGE of purified mitochondrial from three WT ER-Hoxb8 clones and three TAFAZZIN-KO clones. The gel is Coomassie stained. The 5 mitochondrial supercomplexes are highlighted on the right. (B) Following quantification of the mitochondrial supercomplexes, the relative contributions of each supercomplex within each clone depicted. (C) Heat map representation of gene expression from WT (n = 6) and TAFAZZIN-KO (n = 5) GMP clones. (D) TAFAZZIN is the most highly differentially expressed gene. (E) The count per million (CPM) are displayed for select genes involved in mediated ER stress and apoptosis. The false discovery rate (FDR) is displayed with each gene.
Gene expression analysis suggests increased ER stress
Given the functional similarity of neutrophils in our assays, we turned to a transcriptomic comparison (RNA-sequencing) of ER-Hoxb8 GMPs. The lack of TAFAZZIN did not lead to widespread transcriptomic changes (Figure 6C). Furthermore, there were no obvious and significant changes at the pathway level that resulted from the loss of TAFAZZIN (eg, gene ontology, DAVID, GSEA, data not shown). In manually curating the gene expression data, we noted that TAFAZZIN was the gene most differentially expressed (as would be expected) and that housekeeping genes such as β-actin were unaffected by the loss of TAFAZZIN expression (Figure 6D).
One of the most differentially expressed genes was the transcription factor DNA Damage Inducible Transcript 3, also known as C/EBP homologous protein (CHOP) (Figure 6E). Given the role of CHOP as a terminal effector of ER stress,40 we examined the expression of other canonical ER stress pathway genes and found significant changes in the expression of ATF4 and ERN1 as well as apoptosis pathway genes BCL2 (Figure 6E). Notably, many of the other genes in the ER stress and apoptotic pathways did not show significant differences at the transcriptomic level.
Gene expression data are publicly available in GEO (GSE151006) and the complete list of count per million, logFC, and false discovery rate can be found in supplemental Spreadsheet 1.
TAFAZZIN-deficient myeloid progenitors are more sensitive to apoptosis and ER stress in vitro
Given the gene expression differences, we wished to assay the sensitivity of the WT and TAFAZZIN-KO ER-Hoxb8 GMPs to triggers of apoptosis. Cells were exposed to an inhibitor of BCL2 (ABT199), an inhibitor of MCL1 (AMG176), and a trigger of ER stress (thapsigargin). Thapsigargin is an inhibitor of the sarcoplasmic ER Ca2+ ATPase, which leads to ER stress and activation of the unfolded protein response and ultimately cell death. Viability was assayed at 24 hours. The TAFAZZIN-KO cells showed increased sensitivity to apoptosis following inhibition of BCL2, but not MCL1, and were slightly more sensitive to thapsigargin (Figure 7A). Given the subtle nature of the differences, these assays were repeated on multiple clones and on 5 to 6 different experimental days to account for any technical differences; the data in Figure 7A are displayed without error bars for the sake of clarity (the same data with standard deviation error bars is presented in supplemental Figure 5A).
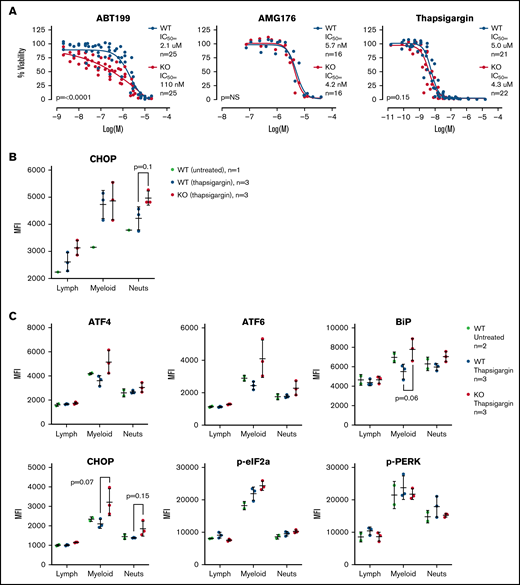
TAFAZZIN deficient myeloid progenitors are more sensitive to apoptosis and ER stress signals. (A) Viability was assessed in vitro (CellTiter Glo) at 24 hours after exposure to ABT199, AMG176, or Thapsigargin. This assay was performed on >5 different days with multiple clones; the total N is displayed on each graph. The same data with error bars are displayed in supplemental Figure 5A. A 2-way analysis of variance (ANOVA) was used to determine the statistical difference between viability curves. (B) In vivo CHOP protein expression following thapsigargin treatment was assayed by intracellular antibody staining on peripheral blood neutrophils from adult mice transplanted and reconstituted with WT or TAFAZZIN-KO fetal liver hematopoietic cells as described in Figure 2A. CHOP expression was quantified as mean fluorescence intensity (MFI) by flow cytometry. (C) This experiment was repeated on additional mice to quantify CHOP as well as other intracellular proteins. The expression of CHOP and BiP in the peripheral blood circulating myeloid populations following treatment with thapsigargin demonstrated a trend toward increase in the TAFAZZIN-KO animals. t tests were performed, and P values are indicated on the plots. All other results are not statistically significant.
TAFAZZIN deficient myeloid progenitors are more sensitive to apoptosis and ER stress signals. (A) Viability was assessed in vitro (CellTiter Glo) at 24 hours after exposure to ABT199, AMG176, or Thapsigargin. This assay was performed on >5 different days with multiple clones; the total N is displayed on each graph. The same data with error bars are displayed in supplemental Figure 5A. A 2-way analysis of variance (ANOVA) was used to determine the statistical difference between viability curves. (B) In vivo CHOP protein expression following thapsigargin treatment was assayed by intracellular antibody staining on peripheral blood neutrophils from adult mice transplanted and reconstituted with WT or TAFAZZIN-KO fetal liver hematopoietic cells as described in Figure 2A. CHOP expression was quantified as mean fluorescence intensity (MFI) by flow cytometry. (C) This experiment was repeated on additional mice to quantify CHOP as well as other intracellular proteins. The expression of CHOP and BiP in the peripheral blood circulating myeloid populations following treatment with thapsigargin demonstrated a trend toward increase in the TAFAZZIN-KO animals. t tests were performed, and P values are indicated on the plots. All other results are not statistically significant.
To validate the findings of our ER-Hoxb8 GMPs, primary fetal liver hematopoietic cells from the litters of 3 timed pregnancies were also exposed to ABT199 and viability assayed at 24 hours. Consistent with the data in the ER-Hoxb8 cell lines, the primary fetal liver TAFAZZIN-KO cells also demonstrated a significantly increased sensitivity to apoptosis (supplemental Figure 5B).
TAFAZZIN-deficient neutrophils are more sensitive to ER stress in vivo
Recognizing the limitations of in vitro assays, we wished to assess the sensitivity of mature neutrophils to ER stress in vivo. We took advantage of our system of fetal liver transplantation (Figure 2A) to reconstitute adult mice with a TAFAZZIN-deficient hematopoietic compartment. This experiment was performed twice. In the first iteration, mice were exposed to a single dose of thapsigargin delivered by intraperitoneal injection, and the protein expression of CHOP in peripheral blood neutrophils was assayed by intracellular antibody staining 3 hours after injection (Figure 7B; gating strategy shown in supplemental Figure 5C). The increase in CHOP expression was more pronounced in TAFAZZIN-deficient neutrophils, suggesting an increased propensity toward apoptosis following a trigger of ER stress.
In the second experiment, the protein expression of an expanded number of ER stress markers was evaluated (Figure 7C). Consistent with the first experiment, the TAFAZZIN-deficient neutrophils again appeared to have an increased propensity to undergo apoptosis following treatment with thapsigargin, as evidenced by the increased expression of CHOP in addition to ATF4, ATF6, and BiP. In this second experiment, the lack of difference within the lymphoid population of peripheral blood cells was highly suggestive that this propensity toward apoptosis was limited to cells of the myeloid compartment.
Together, these data suggest that the loss of TAFAZZIN expression results in increased sensitivity to ER stress-induced apoptosis both in myeloid progenitors when assayed in vitro and in mature circulating neutrophils in vivo.
Discussion
In this study, we took advantage of a TAFAZZIN-KO mouse and combined in vivo studies with in vitro studies using the ER-Hoxb8 system of conditional immortalization to assess the effect of TAFAZZIN deficiency on myeloid progenitors and mature neutrophils. The strengths of our study include the analysis of embryonic hematopoietic development in parallel with the analysis of adult hematopoiesis using a transplantation model. Furthermore, we were successful in the generation of ER-Hoxb8 GMPs from both WT and TAFAZZIN-KO fetal liver cells, providing an inexhaustible source of progenitors and mature neutrophils for mechanistic studies, and a useful and practical reagent for the field. Where possible, data generated in the context of the ER-Hoxb8 model system were validated using primary cells, though the paucity of cells (in most cases available from the embryonic fetal liver) made this challenging and spoke to the practical advantage of the ER-Hoxb8 lines.
The neutropenia of BTHS can be pleiotropic, with almost 90% of patients affected to some degree, though individual patients can have periods of neutropenia alternating with normal neutrophil counts.6,41 The molecular basis of the neutropenia has been elusive and difficult to replicate in model systems.16 The original description of BHTS reported histologic and electron microscopic analyses of patient bone marrow and concluded that “a maturation arrest was observed at the myelocyte stage… myeloblasts, promyelocytes and myelocytes had abnormal mitochondria.”1 Functional studies of patient neutrophils, including phagocytosis, oxygen consumption, and chemotaxis were normal.1 Later, neutrophils isolated from patients demonstrated increased Annexin-V binding in vitro in the absence of other markers of apoptosis.15 In these patients, colony formation (colony-forming unit granulocyte-macrophage) from peripheral blood mononuclear cells in methylcellulose media demonstrated the same number of colonies as controls, arguing against a developmental defect.15
Another group used shRNA-mediated knockdown of TAFAZZIN in human acute myeloid leukemia cells lines (eg, HL60 and U937) and similarly demonstrated increased Annexin-V binding. This was accompanied by changes in mitochondrial membrane potential as well as leaking of mitochondrial cytochrome c, activation of caspase-3, and increased apoptosis.17 These changes seemed specific to the myeloid leukemia cell lines because TAFAZZIN knockdown in lymphoid cell lines had minimal to no effect.17
The first murine model of BTHS was based on a doxycycline-inducible transgenic shRNA for the knockdown of TAFAZZIN.42,43 Though the data were not shown, the authors reported neutropenia in 50% of TAFAZZIN-KO animals (2 months old) as well as 20% of WT control animals. However, they attributed this to the confounding variable of doxycycline (administered to the mice via drinking water or chow), which can decrease circulating neutrophil numbers in mice.44
In this historical context, our results are quite consistent with what has been published. We were expecting a more dramatic functional phenotype under the hypothesis that our system was one of complete lack of TAFAZZIN activity (from the murine genetic KO) rather than a knock-down (shRNA) or potential low-level residual TAFAZZIN activity (eg, hypomorphic mutation) that can be seen in patient samples. The lack of deficit does not appear to be due to a compensatory mechanism, in the sense that there are striking differences in the cardiolipin content and makeup of WT and TAFAZZIN-KO myeloid progenitors.
In our transplantation model, where TAFAZZIN-KO bone marrow was transplanted into WT recipient mice, might the lack of in vivo hematopoietic phenotype be due to the compensatory presence of intact TAFAZZIN within the stromal and endothelial cells of the bone marrow? This question is made more relevant by the observation that mitochondria can be transferred between hematopoietic and bone marrow stromal cells, particularly in the context of leukemia or other inflammatory settings.45-47 Cell-to-cell mitochondrial transfer has not been well-characterized in populations of normal GMPs or mature neutrophils, so we suspect that this is less likely to be a confounding variable in our system.
The lack of a functional deficit may be due to the observation that mature neutrophils have relatively few mitochondria (on a per-cell basis) and even those mitochondria are quite small48 (in comparison with the very high number of large mitochondria seen in the cardiac myocytes). Still, we were surprised that there did not appear to be a difference in the production of ROS, which is felt to be dependent on the efficient function of the mitochondrial electron transport chain complexes. Our mitochondrial supercomplex data, based on Blue Native polyacrylamide gel electrophoresis, did not show any obvious changes in supercomplex assembly in the absence of TAFAZZIN. Our transmission electron micrographs of TAFAZZIN-deficient neutrophils demonstrated the known ultrastructural differences as well as a previously undescribed tendency of the rough ER to completely encircle the TAFAZZIN-deficient mitochondria.
Neutrophil mitochondria have been reported to play a limited role in supporting ATP production, but a more important role in apoptosis and cell death.49 These findings led us to investigate the sensitivity to apoptosis in cells lacking TAFAZZIN. We demonstrated that the lack of TAFAZZIN leads to an increased sensitivity to BCL2 inhibition and to ER stress triggered by the chemical thapsigargin. The variable presentation of neutropenia in patients with BTHS is likely due to the pleiotropic effects of other modifying genes, possibly from the variability of residual TAFAZZIN enzyme activity, and certainly influenced by the nuanced differences in how patients respond to periods of stress. It is not clear how environmental, nutritional, or infectious stresses may be affecting the pool of circulating neutrophils in certain patients with BTHS and may be contributing to susceptibility to apoptosis and therefore to neutropenia.
The link between TAFAZZIN deficiency and increased sensitivity to the ER stress-induced apoptosis is unknown. The communication between ER and mitochondria and its role in regulating critical biological functions and apoptosis has been described49,50 and our electron micrographs clearly demonstrate physical contact between these organelles. The ER–mitochondrial contacts allow for the transport of metabolites, such as lipids, between the ER and mitochondria. In fact, cardiolipin is synthesized from phosphatidyl acid that is transported from the ER to the mitochondrial inner membrane.51 It is possible that the depletion of CL or the accumulation of monolysocardiolipin that results from TAFAZZIN deficiency may disrupt the normal lipid crosstalk between the ER and mitochondria, leading to an accumulation of undesired lipid species in the ER. Dysregulation of lipid metabolism is known to activate the ER stress and apoptotic signaling pathways,52 pointing toward a potential mechanism to explain why TAFAZZIN deficiency results in an increased sensitivity to apoptosis.
Patients with BTHS and neutropenia are typically treated with granulocyte colony-stimulating factor (G-CSF) to boost their circulating neutrophil count, with most patients responding to G-CSF therapy.41 G-CSF is known to inhibit neutrophil apoptosis in vitro and in vivo.53,54 Overall, the clinical response to G-CSF in patients with BTHS, possibly counteracting a predisposition toward apoptosis, is thus consistent with our model data.
We hope that these studies, and the generation of ER-Hoxb8 myeloid progenitors, will set the foundation for further mechanistic studies and help point toward therapeutic strategies to address BTHS neutropenia. Although this is a very rare disease, these model systems will also be useful in addressing fundamental questions of how loss of TAFAZZIN and changes in mitochondrial-specific cardiolipin composition impact myeloid development, function, and survival, possibly linked to other subcellular systems including protein trafficking through the endoplasmic reticulum.
Acknowledgments
The authors thank Douglas Strathdee for generating and sharing of the TAFAZZIN knock-out mouse strain. They also thank Maris Handley and the staff of the Harvard Stem Cell Institute-Center for Regenerative Medicine Flow Cytometry Core for assistance with flow cytometry and cell sorting; Fred Preffer and Scott Mordecai for aiding with the imaging flow cytometry; Sunia Trauger and Charles Vidoudez at the Harvard Center for Mass Spectrometry for the lipid and cardiolipin measurements; Grant Hatch, who provided a detailed protocol for the Blue Native polyacrylamide gel electrophoresis; and Brittany Hallgren, Elizabeth Zanetakos, and Aathmika Krishnan for their experimental assistance.
This study was supported by research funding from the Barth Syndrome Foundation (D.B.S.), American Society of Hematology Scholar Award (D.B.S.), National Institutes of Health National Heart, Lung, and Blood Institute (R01 HL128694) (W.T.P.), and Alex’s Lemonade Stand Foundation (N.v.G.).
Authorship
Contribution: D.B.S. and J.S. undertook study conception and design; D.B.S., J.S., J.M., T.B., J.E., N.A., S.W., S.F.T., and D.R.K. collected data; D.B.S., J.S., J.M., T.B., J.E., N.v.G., M.C., R.I.S., S.F.T., D.R.K., S.W., and W.T.P. undertook analysis and interpretation of results; D.B.S., J.S., and T.B. wrote the original draft; D.B.S., J.S., T.B., N.v.G., J.M., N.A., and W.P. provided manuscript review and editing; and all authors reviewed the results and approved the final version of the manuscript.
Conflict-of-interest disclosure: J.S. is currently employed by Biogen and declares no competing interests with this work performed at the Massachusetts General Hospital. D.B.S. is a cofounder and holds equity in Clear Creek Bio, is a consultant and holds equity in SAFI Biosolutions, and is a consultant for Keros Therapeutics. W.T.P. and S.W. hold intellectual property in TAFAZZIN gene therapy. W.T.P. is on the Barth Syndrome Foundation Scientific and Medical Advisory Board. The remaining authors declare no competing financial interests.
The current affiliation for J.S. is Biogen, Cambridge, MA 02142.
Correspondence: David B. Sykes, Massachusetts General Hospital, CPZN 4238, Boston, MA 02114; e-mail: dbsykes@mgh.harvard.edu.

