

Key Points
Cebpa activates granulocytic differentiation in early myeloid-biased progenitors but not in LT-HSCs during steady-state hematopoiesis.
Unresolved neutropenia caused by Cebpa +37kb enhancer deletion disturbs the LT-HSC pool and leads to severe BM dysplasia.

Abstract
The transcription factor C/EBPa initiates the neutrophil gene expression program in the bone marrow (BM). Knockouts of the Cebpa gene or its +37kb enhancer in mice show 2 major findings: (1) neutropenia in BM and blood; (2) decrease in long-term hematopoietic stem cell (LT-HSC) numbers. Whether the latter finding is cell-autonomous (intrinsic) to the LT-HSCs or an extrinsic event exerted on the stem cell compartment remained an open question. Flow cytometric analysis of the Cebpa +37kb enhancer knockout model revealed that the reduction in LT-HSC numbers observed was proportional to the degree of neutropenia. Single-cell transcriptomics of wild-type (WT) mouse BM showed that Cebpa is predominantly expressed in early myeloid-biased progenitors but not in LT-HSCs. These observations suggest that the negative effect on LT-HSCs is an extrinsic event caused by neutropenia. We transplanted whole BMs from +37kb enhancer-deleted mice and found that 40% of the recipient mice acquired full-blown neutropenia with severe dysplasia and a significant reduction in the total LT-HSC population. The other 60% showed initial signs of myeloid differentiation defects and dysplasia when they were sacrificed, suggesting they were in an early stage of the same pathological process. This phenotype was not seen in mice transplanted with WT BM. Altogether, these results indicate that Cebpa enhancer deletion causes cell-autonomous neutropenia, which reprograms and disturbs the quiescence of HSCs, leading to a systemic impairment of the hematopoietic process.
Introduction
Pioneering transplantation studies showed that long-term hematopoietic stem cells (LT-HSCs) possess a multilineage differentiation potential toward all hematopoietic lineages after myeloablative conditioning.1,2 Bone marrow (BM) differentiation occurs along a continuum of cellular states, progressing in a trajectory from LT-HSC toward cell-lineage specific progenitors.3-6 Hematopoietic stem and progenitor cells (HSPCs) forming these trajectories are interconnected by transcription factor networks that drive differentiation.7 Despite their role in differentiation, it remains unclear how transcription factors protect HSCs from exhaustion to preserve BM integrity.8
The myeloid lineage transcription factor C/EBPα, encoded by Cebpa, has been studied extensively to understand its role in myeloid differentiation. The expression of Cebpa in myeloid cells is specifically controlled by the +37 kb enhancer (+42 kb in humans).9,10 Genetic knockout of Cebpa11 or its +37kb enhancer9,12 in vivo (both referred to as Cebpa null mice) causes neutropenia concomitant with reduced LT-HSC numbers. These studies describe C/EBPα as one of the major myeloid regulators that interconnect HSCs with myeloid progenitors. In addition, it has been suggested that C/EBPα has a dual role in LT-HSCs: maintaining LT-HSC quiescence by repressing the self-renewal13 and proliferative14 gene expression programs while simultaneously priming early myeloid genes.11
One major technical limitation in these studies is the low resolving power of the technologies used to study rare cell types such as LT-HSCs. Bulk genome-wide transcriptomics measures gene expression signatures at the population level, thereby masking the presence of any rare and transient cell state of physiological importance in the BM. This limitation has been overcome by high-resolution single-cell technologies combined with lineage tracing or in vivo barcoding. Emerging findings from studies in native hematopoiesis4,15,16 place LT-HSCs as a separate and an occasional contributing entity to myelopoiesis in contrast with a continuous HSC to myeloid state, therefore questioning the role of Cebpa as a myeloid priming factor in HSCs.
Here we investigated whether LT-HSC loss in Cebpa null mice is the cause or consequence of neutropenia. We hypothesize that either (1) LT-HSCs harboring an active Cebpa locus are lost upon enhancer deletion, leading to myeloid trajectory shutdown, and ultimately neutropenia or, (2) myeloid-biased progenitors expressing Cebpa are lost upon enhancer deletion, causing neutropenia, which systematically disturbs and depletes the LT-HSC pool. To address this question, we combined previously published single-cell datasets from wild-type (WT) BMs with bulk-cell transcriptomics from the +37kb enhancer-deleted mice. Furthermore, we transplanted Cebpa enhancer-deleted cells to study the possible systemic effects on hematopoiesis of the host. Using these approaches, we conclude that LT-HSCs do not express detectable levels of Cebpa in unperturbed hematopoiesis, and Cebpa null-induced neutropenia systemically disturbs LT-HSC quiescence, leading to HSC depletion, BM hypocellularity, and severe dysplasia.
Materials and methods
RNA sequencing
Total sample RNA was extracted using Trizol with Genelute LPA (Sigma) as a carrier, and SMARTer Ultra Low RNA kit for Illumina Sequencing (Clontech) was used for cDNA synthesis according to the manufacturer’s protocol. cDNA was sheared with the Covaris device and processed according to the TruSeq RNA Sample Preparation v2 Guide (Illumina). Amplified sample libraries were subjected to paired-end sequencing (2 × 75 bp) and aligned against mm10 using TopHat.17 Gene expression levels were quantified by the fragments per kilobase of exon per million fragments mapped (FPKM) statistic as calculated by Cufflinks18 in the RefSeq Transcriptome database.19 Read counts were determined with HTSeq-count20 and subsequently used for differential expression analysis in DESeq2,21 with default parameters in the R environment. Multiple testing correction was performed by the Benjamini-Hochberg procedure on the calculated P values to control the false discovery rate (FDR).
For gene set enrichment analysis (GSEA), a ranking metric was defined for each gene as the log10 of the adjusted P value calculated by DESeq2 with the sign of the log2 fold change. The ranked gene list was tested against a customized version of the C2 MSigDB collection, incorporating datasets on HSC quiescence from the literature3,22-24 (supplemental Table 1).
Single-cell RNA sequencing
A compendium of previously published mouse BM single-cell RNA-Seq datasets (Fluidigm C1 platform) was assembled to evaluate the expression of key progenitor genes of interest described25-27 (available at: http://www.altanalyze.org/ICGS/Public/Mm-Grimes-Fluidigm-Panorama/User.php). Specifically, WT in vivo mouse SLAM, LSK, GMP, CMP, and lineage-negative Sca1+ CD117+ cells from BM were selected, with labels derived from the noted prior studies (GSE70245, GSE141472). Data were analyzed with RSEM to estimate TPM for all genes as previously described.28 The gene expression data of selected genes were visualized in the python package plotly or GraphPad Prism, represented as log2 TPM values.
For the analysis in supplemental Figure S1, published single-cell RNA-seq data of HSPCs from the BM of 10 female 12-week-old C57BL/6 mice were retrieved.29 Raw counts were downloaded from the GEO database (GSE81682), with labels derived from the broad gating strategy used in the original study (available here: http://blood.stemcells.cam.ac.uk/data/all_cell_types.txt). Data were imported and processed using the Seurat R package.30 Cells with fewer than 200 000 total counts, fewer than 4000 detected genes, or more than 10% mitochondrial reads were excluded. Expression data were log-normalized, and the 5000 most variable features were selected for dimensionality reduction with UMAP. Cebpa expression was projected on the UMAP and compared with the expression of other selected genes (Mecom, Hlf) to investigate its association with different cell populations.
Mice and transplantation procedures
The strains of +37kb enhancer-1.2kb and +37kb enhancer-1.15kb-deleted mice were generated using zygotes derived from C57/BL6 mice by CRISPR/Cas9 editing and maintained as previously described.9 The CRISPR/Cas9 single guide RNAs were directed against the +37kb enhancer of Cebpa, using the following sequences:
5′: TGAAGCCTACACTACTTTGT and AGAGGTAGGAACTCCATTCC
3′: AGAGCCTCGCTCAAGCCCAT and TTGAGACATCTGGTAACCTT
Recipient mice were exposed to a 5.5 Gy of γ radiation. Given that the native +37kbHOM mouse exhibits a 3- to 5-fold increase in the cKIT+ lineage-negative progenitor fraction of the BM, we transplanted 1 million WT CD34.2 total BM cells and 250 000 of HOM CD34.2 cells to compensate for the fold difference. Nontransplanted mice were sacrificed for FACS analysis between 4 and 8 weeks of age. For transplantation experiments, BM from 4 week old WT or +37kb enhancer-deleted CD45.2 mice were harvested in phosphate-buffered saline (PBS)/5% FCS and injected intravenously in tails of (CD45.1) female mice. All mice were sacrificed in a CO2 chamber. Animal studies were approved by the Animal Welfare/Ethics Committee of the EDC in accordance with legislation in The Netherlands (approval No. EMC 2067, 2714, 2892, 3062).
Flow cytometry and sorting
Flow cytometry was carried out on the LSRII and the FACSCanto II (BD Biosciences). FACS AriaIII (BD Biosciences) was used for cell sorting, using the following fluorescent antibodies: markers for mature hematopoietic cells (CD11B APC/GR1-FITC/B220-PE/CD3 PB); pan-hematopoietic marker (CD45.1 PE; CD45.2 APC-CY7); LIN biotinylated cocktail (CD11B, GR-1, B220, and CD3) streptavidin-Pacific Orange; LSK (cKIT-APC/SCA1-PB); LT-HSCs (CD48-FITC/CD150-PE-CY7). Lineage-negative selection was carried out using a cocktail of antibodies targeting antigens expressed on mature hematopoietic cells, including CD11B, GR-1, B220, and CD3. All antibodies were purchased from BD Biosciences or Biolegend (supplemental Table 2). The LSK population was gated from live (DAPI-), CD45+, lineage-cKIT+ SCA-1+ BM cells, and the sorted LSK fraction was collected in 500 μl PBS with 5% FCS, spun down and resuspended in 800 μl of Trizol and used for RNA-seq.
Results
Neutropenia results in LT-HSC number reduction in +37kb Cebpa enhancer-deleted mice
To study the causal relationship of neutropenia and loss of LT-HSCs, we investigated the allelic dosage effect of Cebpa enhancer deletion on the numbers of neutrophils and LT-HSCs using Cebpa +37kb enhancer heterozygous (+37kbHET)-deleted and +37kb homozygous (+37kbHOM)-deleted mouse strains.9 The neutrophil (Mac1+Gr1+) frequency and absolute numbers in the peripheral blood (PB) and BM of the +37kbHET and the +37kbHOM mice correlated with their monoallelic and biallelic enhancer deletion, respectively (Figure 1A-D). Therefore, 50% enhancer activity reduced the neutrophil output by approximately half (median frequency: 44.6%) (Figure 1C), while a full enhancer deletion completely abrogated neutrophil production (median frequency 0%). The reduction of neutrophils occurring in the +37kbHOM mice was confirmed by hematoxylin and eosin (H&E) staining of BM sections (Figure 1E) and by the decreased frequency of S100A8 cells (Figure 1F). To investigate whether enhancer deletion affects the LT-HSC pool, we studied the LT-HSC population using the SLAM CD150 and CD48 markers (LT-HSCs: LSK/CD150+CD48-) in the +37kbHET and +37kbHOM mice. The LT-HSC pool was not affected in the +37kbHET mice despite the 50% enhancer dosage (Figure 1G,H). Although there was a near 2-fold reduction in LT-HSC numbers, this difference was not statistically significant. In contrast, a 10-fold reduction of LT-HSC numbers at 100% enhancer dosage reduction was observed in the +37kbHOM mice (Figure 1G,H). The fact that monoallelic enhancer deletion does not affect LT-HSC numbers, but reduces the neutrophil compartment by half, suggests that Cebpa only becomes expressed in neutrophil-primed progenitors and is inactive in LT-HSCs. Thus, the quantitative changes in the LT-HSC pool of the +37kbHOM mice could be explained by an indirect effect of complete ablation of neutrophils, whereas partial neutropenia in the +37kbHET is insufficient to inflict these changes. Alternatively, myeloid progenitors may be more sensitive to reduced C/EBPa levels than LT-HSCs, which would only become depleted upon biallelic deletion of the +37 kb enhancer.
![Cebpa enhancer deletion causes neutropenia and reduction in LT-HSCs of +37kbHOM BMs. (A-B) Representative flow cytometry plots showing Mac1+Gr1+ myeloid cell populations in PB (A) and BM (B) of +37kbWT (blue), +37kbHET (green), and +37kbHOM (red) mice. (C) Absolute numbers of Mac1+Gr1+ cells calculated from total PB counts of 37kbWT (blue), +37kbHET (green), and +37kbHOM (red) mice. (D) Relative numbers of total Mac1+Gr1+ cells calculated from total BM cell count from 1 femur, corrected for body weight in grams of each mouse. (E) Hematoxylin and eosin (H&E) staining of representative cross sections showing BM architecture (left), identifying megakaryocytes (right [arrows]) in +37kbWT and +37kbHOM mice. (F) S100A8 immunohistochemical staining of representative BM cross sections from 37kbWTand +37kbHOM mice. (G) Representative flow cytometry plots of LK, LSK, LT-HSC, ST-HSC, MPP3, MPP2 cell populations in BM of 37kbWT, +37kbHET, and +37kbHOM mice. (H) Absolute numbers of CD150+CD48- LT-HSCs calculated from total BM cell counts from 1 femur. All data are represented as mean +/− SD. Statistical significance was calculated using a Student t-test. *P value < .05; **P value < .005; ***P value < .0005; N.S., not significant; SD, standard deviation; LK, Lineage- cKit+; LSK, Lineage- Sca1+ cKit+; LT-HSC, long-term hematopoietic stem cell; ST-HSC, short-term hematopoietic stem cell; MPP, multipotent progenitor; +37kbWT, wild type +37kb enhancer; +37kbHET, heterozygous +37kb enhancer deletion; +37kbHOM, homozygous +37kb enhancer deletion.](https://ash.silverchair-cdn.com/ash/content_public/journal/bloodadvances/6/5/10.1182_bloodadvances.2021005851/3/m_advancesadv2021005851f1a.png?Expires=1767697318&Signature=ouMFJPrU82A5QNkC2K8~kCrGKu0wk8ZuaHbXOsCl9Pr30a6mJk37sV6ccNqDbQlSmxfFMufUw2kw2l3lJ8ltmjNhq0~xWw6yrD023A6U5jLhjZem1faT-p14sH2LHE8cE4sCxJd1bQo6ATtwxmUaWaS6MTXHybRS810vgYOUYR710dJCGb7a-aF-SWb0~dm4qZHZ~lkjXadcatNwjsqMFG9NX0bKBvxCLQb3VDsf5vb2AzB0YHj7ztHoFXvCBXfgxXWVjZDSnmlMbbMXBH5ILBHKavT0tekfSU0jnK83cbLIEwyBws6-iTRqzFaEC4T~937igbuCNExs8fJ7-aiEhg__&Key-Pair-Id=APKAIE5G5CRDK6RD3PGA)
![Cebpa enhancer deletion causes neutropenia and reduction in LT-HSCs of +37kbHOM BMs. (A-B) Representative flow cytometry plots showing Mac1+Gr1+ myeloid cell populations in PB (A) and BM (B) of +37kbWT (blue), +37kbHET (green), and +37kbHOM (red) mice. (C) Absolute numbers of Mac1+Gr1+ cells calculated from total PB counts of 37kbWT (blue), +37kbHET (green), and +37kbHOM (red) mice. (D) Relative numbers of total Mac1+Gr1+ cells calculated from total BM cell count from 1 femur, corrected for body weight in grams of each mouse. (E) Hematoxylin and eosin (H&E) staining of representative cross sections showing BM architecture (left), identifying megakaryocytes (right [arrows]) in +37kbWT and +37kbHOM mice. (F) S100A8 immunohistochemical staining of representative BM cross sections from 37kbWTand +37kbHOM mice. (G) Representative flow cytometry plots of LK, LSK, LT-HSC, ST-HSC, MPP3, MPP2 cell populations in BM of 37kbWT, +37kbHET, and +37kbHOM mice. (H) Absolute numbers of CD150+CD48- LT-HSCs calculated from total BM cell counts from 1 femur. All data are represented as mean +/− SD. Statistical significance was calculated using a Student t-test. *P value < .05; **P value < .005; ***P value < .0005; N.S., not significant; SD, standard deviation; LK, Lineage- cKit+; LSK, Lineage- Sca1+ cKit+; LT-HSC, long-term hematopoietic stem cell; ST-HSC, short-term hematopoietic stem cell; MPP, multipotent progenitor; +37kbWT, wild type +37kb enhancer; +37kbHET, heterozygous +37kb enhancer deletion; +37kbHOM, homozygous +37kb enhancer deletion.](https://ash.silverchair-cdn.com/ash/content_public/journal/bloodadvances/6/5/10.1182_bloodadvances.2021005851/3/m_advancesadv2021005851f1b.png?Expires=1767697318&Signature=TSIQFI-JA6xExIQkJ39zuf3JCf7mpAdvbF~ZYcodZTi2qZgixxdzFwU~4m4Q3M~zBac4a6XD4l04bJqKTX918fUMZiufe2HddK-ohyy1kpyS0r-iH5OEogW4dj2-J6oIQsZNJQHkd-yxHqf3EnYXwJCQ3FDP-MxVfz8a1NZga1GKAB5QQKcjfHcBgCzG8niJq5XiO9~EmKdaoGcpa5Fum4ocBpvv9Igf-rBIKdhzZxQb4tt~qIogsCWA2I-jQP~OwK1yIGL~dZ6-S1HB5t-QtE-dJBscjdgj2cUz5seDwut6AreQCFM-aE75~rlpQEJPR65SPQwUgx1meEo9XxIHCQ__&Key-Pair-Id=APKAIE5G5CRDK6RD3PGA)
Cebpa enhancer deletion causes neutropenia and reduction in LT-HSCs of +37kbHOM BMs. (A-B) Representative flow cytometry plots showing Mac1+Gr1+ myeloid cell populations in PB (A) and BM (B) of +37kbWT (blue), +37kbHET (green), and +37kbHOM (red) mice. (C) Absolute numbers of Mac1+Gr1+ cells calculated from total PB counts of 37kbWT (blue), +37kbHET (green), and +37kbHOM (red) mice. (D) Relative numbers of total Mac1+Gr1+ cells calculated from total BM cell count from 1 femur, corrected for body weight in grams of each mouse. (E) Hematoxylin and eosin (H&E) staining of representative cross sections showing BM architecture (left), identifying megakaryocytes (right [arrows]) in +37kbWT and +37kbHOM mice. (F) S100A8 immunohistochemical staining of representative BM cross sections from 37kbWTand +37kbHOM mice. (G) Representative flow cytometry plots of LK, LSK, LT-HSC, ST-HSC, MPP3, MPP2 cell populations in BM of 37kbWT, +37kbHET, and +37kbHOM mice. (H) Absolute numbers of CD150+CD48- LT-HSCs calculated from total BM cell counts from 1 femur. All data are represented as mean +/− SD. Statistical significance was calculated using a Student t-test. *P value < .05; **P value < .005; ***P value < .0005; N.S., not significant; SD, standard deviation; LK, Lineage- cKit+; LSK, Lineage- Sca1+ cKit+; LT-HSC, long-term hematopoietic stem cell; ST-HSC, short-term hematopoietic stem cell; MPP, multipotent progenitor; +37kbWT, wild type +37kb enhancer; +37kbHET, heterozygous +37kb enhancer deletion; +37kbHOM, homozygous +37kb enhancer deletion.
Cebpa enhancer deletion causes neutropenia and reduction in LT-HSCs of +37kbHOM BMs. (A-B) Representative flow cytometry plots showing Mac1+Gr1+ myeloid cell populations in PB (A) and BM (B) of +37kbWT (blue), +37kbHET (green), and +37kbHOM (red) mice. (C) Absolute numbers of Mac1+Gr1+ cells calculated from total PB counts of 37kbWT (blue), +37kbHET (green), and +37kbHOM (red) mice. (D) Relative numbers of total Mac1+Gr1+ cells calculated from total BM cell count from 1 femur, corrected for body weight in grams of each mouse. (E) Hematoxylin and eosin (H&E) staining of representative cross sections showing BM architecture (left), identifying megakaryocytes (right [arrows]) in +37kbWT and +37kbHOM mice. (F) S100A8 immunohistochemical staining of representative BM cross sections from 37kbWTand +37kbHOM mice. (G) Representative flow cytometry plots of LK, LSK, LT-HSC, ST-HSC, MPP3, MPP2 cell populations in BM of 37kbWT, +37kbHET, and +37kbHOM mice. (H) Absolute numbers of CD150+CD48- LT-HSCs calculated from total BM cell counts from 1 femur. All data are represented as mean +/− SD. Statistical significance was calculated using a Student t-test. *P value < .05; **P value < .005; ***P value < .0005; N.S., not significant; SD, standard deviation; LK, Lineage- cKit+; LSK, Lineage- Sca1+ cKit+; LT-HSC, long-term hematopoietic stem cell; ST-HSC, short-term hematopoietic stem cell; MPP, multipotent progenitor; +37kbWT, wild type +37kb enhancer; +37kbHET, heterozygous +37kb enhancer deletion; +37kbHOM, homozygous +37kb enhancer deletion.
Cebpa is predominantly expressed in early myeloid-biased progenitors
To study Cebpa expression along differentiation from LT-HSCs toward multipotent and myeloid progenitors, we used single-cell RNA sequencing datasets generated by a Fluidigm-based platform. In total, 1110 BM cells were analyzed (27 libraries, ∼50 cells per library, and >2 million reads/cell on average) and assigned to a specific BM cell type. The identified cellular states were classified into LT-HSC (SLAM) population, HSPC-1 and HSPC-2 (both LSK), and multilineage progenitors, which constitute a mixture of bipotent and unipotent restricted myeloid progenitors, as previously described.25-27 To investigate at what differentiation stage Cebpa becomes expressed, we first used known gene markers associated with HSC quiescence, namely Hlf3 and Mecom,31 and early myeloid differentiation (Elane, Mpo) (Figure 2A). We found a positive correlation between Hlf and Mecom, while Cebpa negatively correlated with Hlf/Mecom (Figure 2B). Accordingly, Cebpa expression was almost negligible in LT-HSCs (detected in 0.8% of LT-HSCs), while it appeared in a subset of HSPCs expressing early myeloid lineage genes, indicating priming of the myeloid lineage at very early stages of differentiation (Figure 2C). The detection limit of this technique is 0.25 transcripts per million (TPM), which could possibly exclude cells with very low but present levels of Cebpa. However, these results were confirmed in another dataset29 generated by a different single-cell sequencing strategy (supplemental Figure S1). Altogether, our single-cell analysis does not support a cell-autonomous role for Cebpa in LT-HSCs. Thus, the reduction in LT-HSC numbers observed in the Cebpa null mice seems to occur systemically as a consequence of neutropenia.
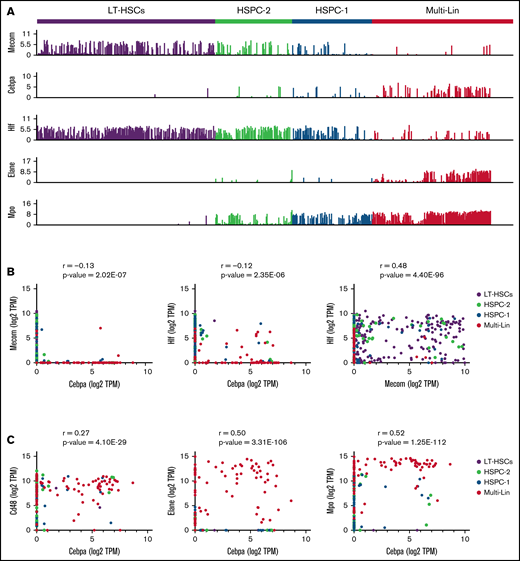
Single-cell RNA sequencing data in WT BMs exclude the presence of Cebpa-expressing LT-HSCs. (A) Bar plot of single-cell expression of Cebpa in different progenitor populations alongside genes involved in LT-HSC quiescence (Mecom, Hlf) or myeloid differentiation (Elane, Mpo). (B) Scatterplots of single-cell gene expression showing that Mecom and Cebpa are mutually exclusive, whereas Hlf and Cebpa are occasionally coexpressed and Mecom frequently cooccurs with Hlf. (C) Scatterplots of single-cell gene expression showing coexpression of Cebpa with Cd48 (a marker not found in LT-HSCs) and the myeloid differentiation markers Elane and Mpo. All gene expression data are presented as transcripts per million (TPM). Cells are color-coded by the population they belong to. Pearson correlation coefficients and the related P values for the pairwise gene combinations are depicted in the scatter plots.
Single-cell RNA sequencing data in WT BMs exclude the presence of Cebpa-expressing LT-HSCs. (A) Bar plot of single-cell expression of Cebpa in different progenitor populations alongside genes involved in LT-HSC quiescence (Mecom, Hlf) or myeloid differentiation (Elane, Mpo). (B) Scatterplots of single-cell gene expression showing that Mecom and Cebpa are mutually exclusive, whereas Hlf and Cebpa are occasionally coexpressed and Mecom frequently cooccurs with Hlf. (C) Scatterplots of single-cell gene expression showing coexpression of Cebpa with Cd48 (a marker not found in LT-HSCs) and the myeloid differentiation markers Elane and Mpo. All gene expression data are presented as transcripts per million (TPM). Cells are color-coded by the population they belong to. Pearson correlation coefficients and the related P values for the pairwise gene combinations are depicted in the scatter plots.
Transcriptional programs of LT-HSC quiescence and neutrophil lineage priming are deregulated in +37kbHOM HSPCs
The results so far indicate that the enhancer deletion decreased the pool of LT-HSCs through a systemic effect in the presence of neutropenia. To study mechanisms linking the 2 observed events, we applied RNA sequencing on sorted HSPCs using LSK markers on +37kbWT (n = 3) and +37kbHOM (n = 3) BM cells. We confirmed that +37kb enhancer deletion in HSPCs reduces Cebpa expression relative to WT controls (Figure 3A). Differential expression analysis identified dysregulated genes related to neutrophil differentiation (S100a9, Camp) and HSC quiescence (Hlf) (Figure 3B; supplemental Table 3). Differentially expressed genes in +37kbHOM LSKs were further investigated by GSEA (supplemental Tables 4 and 5). Genes associated with neutrophil ontogeny were downregulated in +37kbHOM LSK cells (Figure 3C), indicating an early block in myeloid differentiation. Interestingly, we found an early myeloid gene set (Cpa3, Mpo, Cd48) (Figure 3D) to be upregulated in +37kbHOM HSPCs, suggesting that an early myeloid-biased population upstream of Cebpa-HSPCs is primed for myelopoiesis. Based on these findings, we conclude that Cebpa-HSPCs are intermediate progenitors that link early myeloid-biased HSPCs to myeloid-committed progenitors, and they represent the cell of origin for the induced neutropenia in Cebpa null mice.
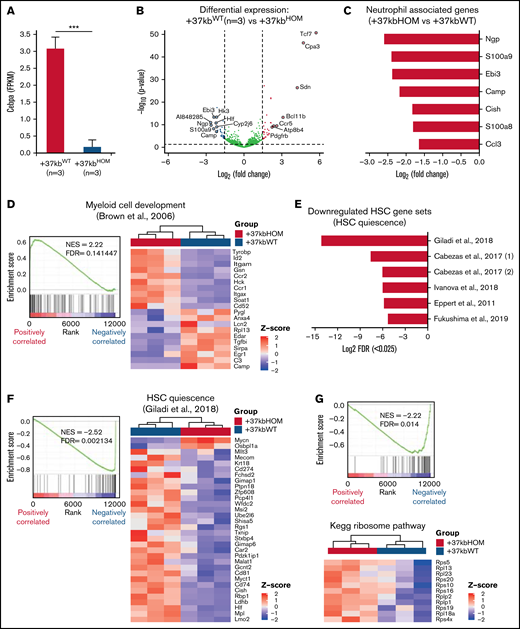
Transcriptome analysis reveals loss of HSPC quiescence in +37kbHOM mice. (A) Volcano plot showing genes differentially expressed in HSPCs of +37kbHOM (n = 3) compared with +37kbWT mice (n = 3). Differentially expressed genes are represented as log2 fold change (x-axis) and log10 P value (y-axis). Significantly upregulated genes (log2 fold change >1.5, P value < .05) are shown in red, downregulated genes (log2 fold change <−1.5, P value < .05) are shown in blue, and genes without significant differences are shown in gray. (B) Mean and SD of Cebpa expression in +37kbWT and +37kbHOM LSKs, expressed as FPKM values. (C) Bar plot showing the top downregulated neutrophil-associated genes in +37kbHOM HSPCs compared with +37kbWT HSPCs, presented as log2 fold change. (D) GSEA enrichment plot (left) showing upregulation (NES = 2.22; FDR <0.05) of the early myeloid-biased gene expression program in +37kbHOM HSPCs. Heatmap (right) showing significant differentially expressed genes of this pathway in +37kbHOM vs +37kbWT HSPCs. (E) Bar plot showing downregulation of LT-HSC quiescence-related pathways in +37kbHOM vs +37kbWT HSPCs, expressed as -log2 transformation of FDR. (F) GSEA enrichment plot (left) showing downregulation (NES = −2.52; FDR <0.05) of the HSC quiescence pathway from3 in +37kbHOM vs +37kbWT HSPCs. Heatmap (right) of the significant differentially expressed genes in this dataset. (G) GSEA enrichment plot (left) showing downregulation (NES = −2.22; FDR <0.05) of the ribosome pathway and heatmap (right) of differentially expressed ribosomal Rsp and Rlp genes. (H) Mean and SD of Mycn expression in +37kbWT and +37kbHOM HSPCs, expressed as FPKM values. The experiment was done in triplicates for each condition, +37kbWT (n = 3) and +37kbHOM (n = 3), and the heatmap values were calculated using Z-scores. SD, standard deviation.
Transcriptome analysis reveals loss of HSPC quiescence in +37kbHOM mice. (A) Volcano plot showing genes differentially expressed in HSPCs of +37kbHOM (n = 3) compared with +37kbWT mice (n = 3). Differentially expressed genes are represented as log2 fold change (x-axis) and log10 P value (y-axis). Significantly upregulated genes (log2 fold change >1.5, P value < .05) are shown in red, downregulated genes (log2 fold change <−1.5, P value < .05) are shown in blue, and genes without significant differences are shown in gray. (B) Mean and SD of Cebpa expression in +37kbWT and +37kbHOM LSKs, expressed as FPKM values. (C) Bar plot showing the top downregulated neutrophil-associated genes in +37kbHOM HSPCs compared with +37kbWT HSPCs, presented as log2 fold change. (D) GSEA enrichment plot (left) showing upregulation (NES = 2.22; FDR <0.05) of the early myeloid-biased gene expression program in +37kbHOM HSPCs. Heatmap (right) showing significant differentially expressed genes of this pathway in +37kbHOM vs +37kbWT HSPCs. (E) Bar plot showing downregulation of LT-HSC quiescence-related pathways in +37kbHOM vs +37kbWT HSPCs, expressed as -log2 transformation of FDR. (F) GSEA enrichment plot (left) showing downregulation (NES = −2.52; FDR <0.05) of the HSC quiescence pathway from3 in +37kbHOM vs +37kbWT HSPCs. Heatmap (right) of the significant differentially expressed genes in this dataset. (G) GSEA enrichment plot (left) showing downregulation (NES = −2.22; FDR <0.05) of the ribosome pathway and heatmap (right) of differentially expressed ribosomal Rsp and Rlp genes. (H) Mean and SD of Mycn expression in +37kbWT and +37kbHOM HSPCs, expressed as FPKM values. The experiment was done in triplicates for each condition, +37kbWT (n = 3) and +37kbHOM (n = 3), and the heatmap values were calculated using Z-scores. SD, standard deviation.
To investigate pathways related to LT-HSC depletion, we retrieved datasets from published hematopoietic studies and pooled them with the MSigDB datasets.3,23,32-34 Of the most significantly (FDR <0.025) enriched pathways, 6 gene sets were enriched for loss of HSC quiescence and exhaustion (Figure 3E). The identified gene sets (Figure 3F; supplemental Figure S2A-F) included transcription factors related to HSC dormancy (Hlf, Mecom, Tcf15),3,31,35 HSC retention factors (Ptpn21, Cxcr4),36,37 cluster of differentiation (Cd) markers for HSC regeneration and engraftment (Cd81, Cd274),38,39 and the polycomb chromobox proteins for HSC self-renewal regulation (Pbx6, Pbx7) (gene lists in supplemental Table 1). Deregulation of ribosomal genes (Figure 3G) in our dataset is in accordance with the loss of HSC quiescence. Thus, LT-HSC loss in the presence of neutropenia may result from quiescence exit and subsequent exhaustion. Altogether, the transcriptomic analysis of sorted LSK cells from +37kbHOM mice suggests that myeloid priming in HSPCs occurs before Cebpa activation and that a neutrophil differentiation block in these progenitors potentially leads to HSC quiescence exit.
Transplantation of +37kbHOM BM into WT recipients confirms that neutropenia is induced by the +37kb enhancer deletion
Next, we studied the systemic effects of the +37kbHOM BM on normal hematopoiesis in recipient mice. A sublethal irradiation approach was used to overcome the low survival rate caused by the weak chimerism known to occur when transplanting Cebpa null BM cells into lethally irradiated recipients.11 We used donor BM cells from 2 different +37kbHOM mouse strains to ensure that the observed phenotype was not caused by an off-target effect. The strains differed in the genomic size of enhancer deletion generated by CRISPR, ie, +37kbHOM deletion of 1.15kb (CD45.2 +37kbHOM-1.15kb deletion) or +37kbHOM deletion of 1.2kb (CD45.2 +37kbHOM-1.2kb) (supplemental Figure S3A,B). Sublethally irradiated recipient (CD45.1) mice were transplanted with total BM of CD45.2 +37kbWT (n = 8), CD45.2 +37kbHOM-1.15kb (n = 7), or CD45.2 +37kbHOM-1.2kb (n = 8) mice (Figure 4A). As expected, PB samples withdrawn 12 weeks after transplantation showed a weaker chimerism in mice transplanted with +37kbHOM BM compared with those transplanted with WT BM (Figure 4B). For cellular reconstitution, we determined the frequency of myeloid cells (Mac1+Gr1+), B cells (B220+), and T cells (CD3+) by flow cytometry for mice transplanted with +37kbWT or +37kbHOM BM cells (Figure 4C-F; supplemental Figure S4A-C).
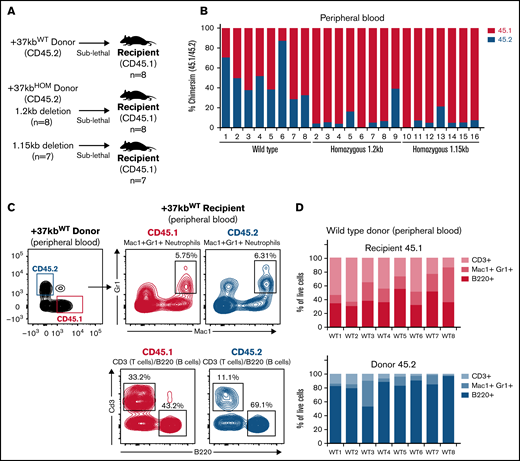
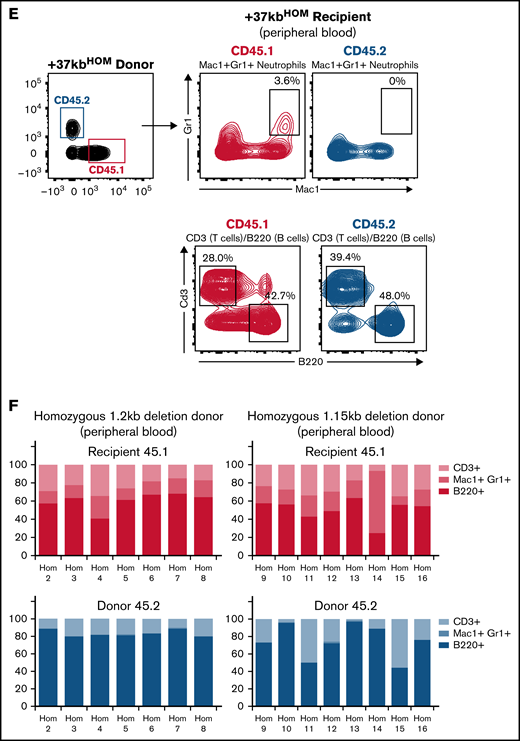
Transplanted +37kb enhancer-deleted BM cells show low chimerism and are neutropenic. (A) Transplantation scheme representing donor (CD45.2) WT, donor (CD45.2) with homozygous 1.2kb deletion, and donor (CD45.2) with homozygous 1.15kb deletion in CD45.1 recipients. Eight recipient mice per condition (n = 24) were used in the experiment. One mouse transplanted with 1.2kb enhancer-deleted BM cells died before it could be analyzed. (B) Bar chart showing percentage of CD45.1 and CD45.2 cell chimerism in PB 12 weeks after transplantation of WT and homozygous BM. (C) Flow cytometry contour plot of BM after transplantation with +37kbWT cells: Mac1+Gr1+ myeloid cells, B220+ B cells, and CD3+ T-cell populations were gated from CD45.1 and CD45.2 fractions. (D) Proportion of +37kbWT Mac1+Gr1+ myeloid cells, B220+ B cells, and CD3+ T-cell populations from recipient CD45.1 (up) and donor CD45.2 (lower). (E) Flow cytometry contour plots of BM after transplantation with +37kbHOM cells: Mac1+Gr1+ myeloid cells, B220+ B cells, and CD3+ T-cell populations were gated from CD45.1 and CD45.2 fractions. (F) Proportion of +37kbHOM Mac1+Gr1+ myeloid cells B220+ B cells and CD3+ T-cell populations from recipient CD45.1 (upper) and donor CD45.2 (lower). Experiments were conducted on PB samples of +37kbWT (n = 8) and +37kbHOM (n = 15), drawn 12 weeks posttransplantation.
Transplanted +37kb enhancer-deleted BM cells show low chimerism and are neutropenic. (A) Transplantation scheme representing donor (CD45.2) WT, donor (CD45.2) with homozygous 1.2kb deletion, and donor (CD45.2) with homozygous 1.15kb deletion in CD45.1 recipients. Eight recipient mice per condition (n = 24) were used in the experiment. One mouse transplanted with 1.2kb enhancer-deleted BM cells died before it could be analyzed. (B) Bar chart showing percentage of CD45.1 and CD45.2 cell chimerism in PB 12 weeks after transplantation of WT and homozygous BM. (C) Flow cytometry contour plot of BM after transplantation with +37kbWT cells: Mac1+Gr1+ myeloid cells, B220+ B cells, and CD3+ T-cell populations were gated from CD45.1 and CD45.2 fractions. (D) Proportion of +37kbWT Mac1+Gr1+ myeloid cells, B220+ B cells, and CD3+ T-cell populations from recipient CD45.1 (up) and donor CD45.2 (lower). (E) Flow cytometry contour plots of BM after transplantation with +37kbHOM cells: Mac1+Gr1+ myeloid cells, B220+ B cells, and CD3+ T-cell populations were gated from CD45.1 and CD45.2 fractions. (F) Proportion of +37kbHOM Mac1+Gr1+ myeloid cells B220+ B cells and CD3+ T-cell populations from recipient CD45.1 (upper) and donor CD45.2 (lower). Experiments were conducted on PB samples of +37kbWT (n = 8) and +37kbHOM (n = 15), drawn 12 weeks posttransplantation.
Populations from the T-cell, myeloid, and B-cell lineages were present in the recipients from the 3 cohorts, indicating that hematopoiesis is functional in the recipient (Figure 4D upper panel and 4F upper panel). However, +37kbHOM donor cells (Figure 4E lower panel and Figure 4F lower panel) lacked myeloid reconstitution as compared with +37kbWT (Figure 4C lower panel and Figure 4D lower panel). Therefore, transplanted +37kbHOM BM cells in a WT niche did not recover neutrophil differentiation, confirming that neutropenia in +37kbHOM enhancer-deleted mice is cell-autonomous. In the +37kbWT donor cell compartment, there was a large contribution of B cells, as previously observed in other transplantation experiments.40-42 Of note, the presence of B cells and T cells from the +37kbHOM donors in both the native and the transplanted mice also argues against a strict need for Cebpa in LT-HSCs since they were able to survive and differentiate into the lymphoid lineage.
Transplanted +37kbHOM BM causes dysplasia and hypocellularity in recipient mice
Despite the low chimerism, the CD45.2 +37kbHOM BM cells persisted and survived for at least 10 months in the CD45.1 recipient but eventually declined to almost 0% (median = 0.89%) on the day the mice were sacrificed (supplemental Figure S5A). Therefore, cells from the blood and BM samples analyzed were mostly derived from the recipient mice. We grouped the recipient mice based on their phenotype severity, ie, +37kbHOM-mild (n = 8) or +37kbHOM-severe (n = 6, namely mice # 2,5,7,9,12, and 17). The +37kbHOM-severe mice represented 40% of all the transplanted mice that showed physical weakness (squinting eyes, hunched posture, and social isolation), which had to be sacrificed (supplemental Figure S5B). One of the mice died before it could be analyzed. BM hypocellularity and pancytopenia were the primary hallmarks of the +37kbHOM-severe group (Figure 5A; supplemental Figure S5C). Hypocellular BMs showed remodeling of blood vessels surrounded by a high degree of immature hematopoietic cells characterized by incomplete differentiation (Figure 5B). The +37kbHOM-mild group showed lower white blood cell (supplemental Figure S6A) and platelet counts (supplemental Figure S6C) compared with WT controls, whereas hemoglobin levels were comparable to those of the +37kbWT group (supplemental Figure S6B). BM cellularity in the +37kbHOM-mild mice varied from normocellular to hypocellular. Both the +37kbHOM-severe and the +37kbHOM-mild cohorts showed abnormal megakaryocytes with dysplastic features (Figure 5B). These data are in line with the dysplastic megakaryocytes found in the native +37kb enhancer-deleted mice (Figure 1E; supplemental Figure S7), which might possibly explain the abnormal PB platelet counts in the recipient mice (supplemental Figure S6C). In conclusion, a significant number of mice transplanted with +37kbHOM BM exhibit perturbed hematopoiesis featuring hypocellularity and peripheral cytopenia, incomplete differentiation, and severe dysplasia.
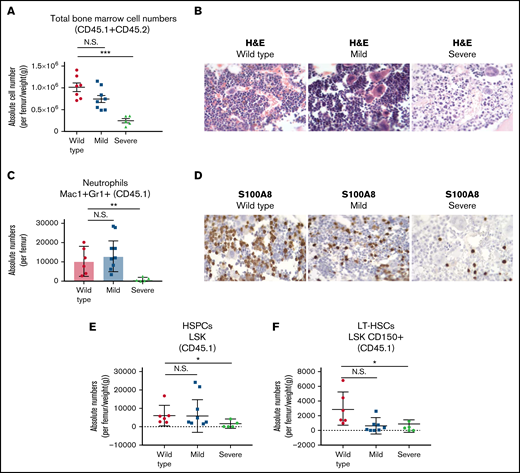
Systemic BM perturbations impair myeloid differentiation and deplete the LT-HSC pool of recipient mice. (A) Total BM cellularity per femur, corrected for body weight in grams of each mouse. The mice transplanted with homozygous BM cells were divided into 2 subgroups based on disease severity: homozygous mild and homozygous severe. Mice transplanted with WT BM were used as controls. (B) Histological examination using H&E on processed paraffin BM sections of recipient CD45.1 transplanted mice. (C) Absolute numbers of Mac1+Gr1+ neutrophils from BM of CD45.1 recipient mice. (D) Immunohistochemistry of S100A8 protein expression on histological BM sections of recipient CD45.1 transplanted mice. (E) HSPC absolute numbers in BMs of CD45.1 recipient mice, calculated from LSK/lineage-negative/live cells (7AAD) and corrected for total cellularity per femur and body weight (in grams) of each mouse. (F) LT-HSC absolute numbers in BM of CD45.1 recipient mice, calculated from CD48-Cd150+/LSK/lineage-negative/live cells (7AAD) and corrected for total cellularity per femur and body weight in grams of each mouse. All data are represented as mean +/− SD. Statistical significance was calculated using a Student t-test. *P value < .05; **P value < .005; ***P value < .0005; N.S., not significant; SD, standard deviation.
Systemic BM perturbations impair myeloid differentiation and deplete the LT-HSC pool of recipient mice. (A) Total BM cellularity per femur, corrected for body weight in grams of each mouse. The mice transplanted with homozygous BM cells were divided into 2 subgroups based on disease severity: homozygous mild and homozygous severe. Mice transplanted with WT BM were used as controls. (B) Histological examination using H&E on processed paraffin BM sections of recipient CD45.1 transplanted mice. (C) Absolute numbers of Mac1+Gr1+ neutrophils from BM of CD45.1 recipient mice. (D) Immunohistochemistry of S100A8 protein expression on histological BM sections of recipient CD45.1 transplanted mice. (E) HSPC absolute numbers in BMs of CD45.1 recipient mice, calculated from LSK/lineage-negative/live cells (7AAD) and corrected for total cellularity per femur and body weight (in grams) of each mouse. (F) LT-HSC absolute numbers in BM of CD45.1 recipient mice, calculated from CD48-Cd150+/LSK/lineage-negative/live cells (7AAD) and corrected for total cellularity per femur and body weight in grams of each mouse. All data are represented as mean +/− SD. Statistical significance was calculated using a Student t-test. *P value < .05; **P value < .005; ***P value < .0005; N.S., not significant; SD, standard deviation.
Acquired neutropenia leading to LT-HSC loss is recapitulated in mice transplanted with +37kbHOM BM
Next, we sought to study whether the differences between the +37kbHOM-severe and the +37kbHOM-mild phenotypes involve maturation defects of myeloid cells or LT-HSCs in the BM of recipient mice. The +37kbHOM-severe-transplanted mice showed a marked reduction in the numbers of recipient (CD45.1) Mac1+Gr1+ cells (Figure 5C), which was confirmed by the decrease in S100A8 protein-expressing cells (Figure 5D). In contrast, the +37kbHOM-mild mice showed normal neutrophil numbers compared with the WT controls (Figure 5C). The +37kbHOM-severe mice also showed a reduction in the CD45.1 HSPC and LT-HSC numbers (Figure 5E,F), whereas the LT-HSC numbers in the +37kbHOM-mild mice were comparable to those of the +37kbWT group. Thus, the findings in the +37kbHOM-severe support the notion that Cebpa null-induced neutropenia triggers LT-HSC loss in a cell nonautonomous manner, as observed in 37kbHOM native mice.
Discussion
C/EBPα is indispensable for myeloid lineage formation and differentiation.13,43 Induced genetic defects in the Cebpa locus of mouse models9,12,44-46 or CEBPA coding mutations detected in human acute myeloid leukemia (AML) specimens47,48 are all associated with myeloid differentiation abnormalities. The expression of CEBPA is also frequently repressed in leukemia by transcriptional or posttranscriptional mechanisms.8 Notably, CEBPA is silenced by oncoproteins targeting the +42 kb enhancer (homologous to +37 kb in mouse), including RUNX1-RUNX1T149 and EVI1.50 Earlier mouse studies revealed an indispensable role for Cebpa in differentiating common myeloid progenitors into granulocyte-monocyte progenitors. The profound neutropenia observed in our +37 kb enhancer-deleted model confirms the absolute requirement for Cebpa in myelopoiesis. We observed a 3-fold increase in Cebpb expression in cKit+ Sca1- Cd34+ myeloid progenitors, but this was insufficient to compensate for the loss of Cebpa. Although C/EBPbeta can substitute for C/EBPalpha during hematopoiesis when knocked into the Cebpa gene locus,51 it cannot fully replace C/EBPalpha when expressed from its native locus.
Several studies hinted toward an intrinsic role for Cebpa in myeloid lineage priming of LT-HSCs.11,12 However, the bulk-sequencing methods used in these studies do not meet the resolution required to dissect the heterogeneity of the HSPC compartment. Using single-cell RNA sequencing, we showed that Cebpa is barely detectable in LT-HSCs during steady-state hematopoiesis. In contrast to previous studies, we found that Cebpa licenses myeloid-primed HSPCs downstream of LT-HSCs for neutrophil lineage differentiation. This suggests that other transcription factors account for the myeloid lineage bias in LT-HSCs52 and activate the neutrophil lineage trajectory through binding the Cebpa +37kb enhancer in a subset of HSPCs.9,53 Although Fluidigm C1 exhibits better sensitivity54 and fewer dropout events55,56 than droplet-based approaches, it remains possible that LT-HSCs with very low Cebpa levels (below the detection threshold of 0.25 TPM) exist. The physiological relevance of such low transcript levels, which could be attributable to pervasive transcription, is unknown. It is equally possible that the few Cebpa-expressing LT-HSCs identified are the result of technical noise or phenotypic misclassification.
In the enhancer-deleted models, LT-HSC loss was proportional to the degree of neutropenia, suggesting a causal relationship between them. Although an alternative explanation could be that LT-HSCs are less sensitive to Cebpa levels than myeloid progenitors, the normal production of lymphoid cells indicates that LT-HSCs remain viable in the absence of Cebpa. This is further supported by the almost complete absence of Cebpa-expressing LT-HSCs in healthy BM. Critically, LT-HSCs were also lost in mice transplanted with +37 kbHOM BM: 40% of the transplanted mice showed this severe phenotype, while the other 60% showed signs of myeloid differentiation defects and dysplasia, suggesting they were in an early stage of the same pathological process. These effects can only be explained by systemic consequences triggered in the presence of neutropenia. Even in a hybrid model in which a few LT-HSCs express Cebpa, the evidence gathered in this study supports the hypothesis that the major LT-HSC depletion in Cebpa null mice is an indirect consequence of neutropenia.
To our knowledge, none of the previously reported neutropenia mouse models26,57 demonstrated a depletion of LT-HSCs. A likely explanation is that the differentiation block in these other models (such as Sbds57 and Gfi158 mutants) often occurs at a late stage of neutrophil differentiation. Niches supporting a late stage of neutrophil differentiation are located distant from LT-HSC niches. Given that the differentiation block in Cebpa null BM occurs in early progenitors located proximally to LT-HSC niches, the proposed systemic effect of neutropenia onto the LT-HSCs might be specific to this model. Fifteen percent of patients with congenital neutropenia develop LT-HSC clonal BM conditions such as myelodysplasia and AML,59,60 suggesting LT-HSC impairment may also occur in human neutropenia. Thus other models of neutropenia are required in order to understand the mechanisms that lead to hematopoietic insufficiency in the presence of neutropenia, such as Cebpa-+37kb-Enh(f/f);Mx1-Cre mice.12 The advantage of those mice with an inducible +37kb enhancer-deletion system is that one could avoid enhancer deletion during embryogenesis.
Loss of HSC quiescence is one of the hallmarks identified at the transcriptional level in the +37kbHOM enhancer-deleted mice. The activation of compensatory mechanisms forcing neutrophil differentiation in myeloid-biased progenitors is a potential underlying cause. For example, increased production of granulocyte colony-stimulating factor (G-CSF) in the absence of peripheral neutrophils is seen in patients with neutropenia.61,62 G-CSF stimulates granulopoiesis through binding to G-CSF receptor-expressing progenitors63 and activates HSCs through attenuation of the Cxcr4-Cxcl12 retention factors expressed on HSCs and BM stromal cells, respectively.64,65 Therefore, the neutropenia-GCSF-HSC activation loop can eventually lead to exhaustion and consumption of the LT-HSC pool. Other potential causes that might lead to LT-HSC quiescence exit include metabolic stress caused by impaired differentiation,66 emergency myelopoiesis due to infections acquired in the absence of neutrophils,67 or the lack of mature neutrophils in the BM niche that support HSC quiescence.68
Myeloid niches in the BM have been reported to be located spatially distant from niches occupied by HSCs69 or lymphoid progenitor populations.70 In addition, the dendritic, neutrophil, and monocyte lineages are also distantly located from each other and organized in different sinusoid niches. Therefore, it is likely that the neutrophil-primed progenitors derived from both donor and recipient share a common environment that is potentially disturbed upon transplantation of +37kbHOM BM. The question that remains to be answered is how transplanted +37kbHOM myeloid progenitors impair the differentiation process of the host. Transcriptome analysis shows that myeloid progenitors (cKit+ Sca1- Cd34+) derived from the +37kb enhancer-deleted model are metabolically reprogrammed and exhibit downregulation of the oxidative phosphorylation (OXPHOS) pathway (supplemental Figure S8A; supplemental Table 6), as compared with normal myeloid progenitors that are dependent on oxidative and mitochondrial metabolism.71 Shutting down OXPHOS eventually activates the glycolytic pathway (known as the Warburg effect), under the control of nuclear factors such as Mycn,72,73 a critical metabolic regulator involved in cell competition. In line with this, we find Mycn expressed at high levels in the +37kbHOM myeloid progenitors (supplemental Figure S8B). Such metabolic changes impact cell-to-cell communication processes required for normal differentiation programs,66 which may partially explain the acquired neutropenia in the recipient when transplanted with +37kbHOM BMs.
Our study suggests that prolonged neutropenia induced perturbations in localized myeloid niches and further caused systemic BM changes resulting in LT-HSC loss, BM hypocellularity, and severe dysplasia. Although the underlying mechanisms remain unclear, we hypothesize that Cebpa null progenitors acquire metabolic reprogramming that impairs differentiation and disturbs HSC quiescence. Functional studies are required to investigate the intracellular role of Cebpa in controlling the metabolic pathways related to neutrophil differentiation and further elucidate how Cebpa null progenitors are metabolically reprogrammed to inflict systemic changes in the BM. From a clinical perspective, this phenomenon may explain how metabolic stress on HSCs might give rise to BM clonal disorders in a subset of congenital neutropenia patients. Therefore, our study sets a paradigm about the underlying mechanisms involved in the progression of neutropenia to clonal BM disorders.
Acknowledgments
The authors are grateful to Michael Vermeulen for the flow cytometric analysis and to their colleagues from the Erasmus Animal Facility, who took care of the mice used in this study and conducted regular bleeding to obtain blood cells. They would also like to thank Stefan Erkeland, Zhen Ping, and Jacqueline Feyen for their valuable input. The work was funded by grants and fellowships from the Dutch Cancer Society (EMCR 2015-7935) (R.D., R.A., R.M.L., M.H., and L.S.) and the Lady Tata Foundation (R.A.).
Authorship
Contribution: R.A., R.M.L., and R.D. designed the research and wrote the paper; R.A., M.H., L.S., N.S., and E.B. performed research; and R.A., R.M.L., R.H., N.S., R.K.S., and L.G. analyzed data.
Conflict-of-interest disclosure: The authors declare no competing financial interests.
Corresponding author: Ruud Delwel, Department of Hematology, Erasmus University Medical Center, Dr Molewaterplein 40, 3015 GD Rotterdam, The Netherlands; email, h.delwel@erasmusmc.nl.

