

Key Points
AlloHSCT patients who develop NIPC have higher health care resource use, more costly hospitalizations, and pulmonary function testing costs.
These higher rates of health care service use led to mean annual per patient costs nearly $160 000 higher in the first year post-alloHSCT.

Abstract
Noninfectious pulmonary complications (NIPC) after allogeneic hematopoietic stem cell transplantation (alloHSCT), including bronchiolitis obliterans syndrome (BOS), cause significant morbidity and mortality, but their impact on health care resource utilization (HRU) and costs is unknown. This longitudinal retrospective study quantified the economic burden of NIPC and BOS in alloHSCT patients using commercial claims data from the IQVIA PharMetrics Plus database. Study patients were aged 0 to 64 years and underwent alloHSCT between 1 January 2006 and 30 September 2018, and were observable 12 months before and up to 5 years after index alloHSCT. NIPC patients were identified using International Classification of Disease (ICD) diagnosis codes. Outcomes were mean per patient HRU (inpatient admissions, outpatient office, hospital visits, and prescription medications) and costs paid by insurers in each post-transplant year. Among 2162 alloHSCT patients, 254 developed NIPCs, and 155 were propensity score (PS)-matched to non-NIPC patients. The year following transplantation, NIPC patients had significantly higher inpatient admission rates (3.8 ± 3.2 vs non-NIPC: 2.6 ± 2.4; P < .001) and higher total costs ($567 870 vs $412 400; P = .07), reflecting higher costs for inpatient admissions ($452 475 vs $300 202; P = .06). Among those observable for more years, costs remained higher for NIPC patients, reflecting significantly higher inpatient admission rates in the first 3 years following transplant. Subanalysis of patients with diagnoses likely reflective of BOS were consistent with these findings. AlloHSCT patients who developed NIPC had higher health care resource utilization and incurred higher costs compared with alloHSCT patients who did not develop NIPC following transplant.
Introduction
Allogeneic hematopoietic stem cell transplantation (alloHSCT) is a lifesaving and potentially curative treatment for a variety of malignant and nonmalignant hematologic conditions,1 offering significant benefits to patients despite high costs.2 Eighty-five percent of alloHSCT recipients who survive 2 years without recurrence of disease are alive at 10 years after transplantation.3 Outcomes for contemporary cohorts of alloHSCT transplant recipients show continued improvements in relapse and nonrelapse mortality.4 Noninfectious pulmonary complications (NIPC), which are seen in 20% of alloHSCT patients, are significant contributors to morbidity and mortality.5,6 For example, idiopathic pneumonia syndrome is associated with 70% mortality at 1 year, and NIPCs that are often considered to be steroid-responsive, such as cryptogenic organizing pneumonia, are still associated with a 1-year mortality of 25%.7,8
Bronchiolitis obliterans syndrome (BOS), the most common and well-studied NIPC post-alloHSCT, typically presents no earlier than 100 days post-transplant, with most cases presenting between 12 and 18 months after alloHSCT.9 BOS is more common following lung transplantation, but estimates of BOS prevalence in patients who have undergone alloHSCT range from 3.4% to 10%.10,11 BOS is characterized by progressive airflow obstruction in both lung transplant and alloHSCT patients.12,13 The histopathology of small airways shows lymphocytic inflammation that can progress to peribronchiolar fibrosis, resulting in airway occlusion.14 BOS is generally irreversible, and most treatments are focused on halting the progression of the disease.15,16 Prognosis after BOS is poor, with a 5-year survival rate of 60%.12 Consequently, alloHSCT patients who develop BOS following transplantation may be unlikely to derive the full benefit of alloHSCT.
While the burden of alloHSCT for payers, patients, and providers has been well-studied,2 the additional impact of NIPC, including BOS, on health care resource utilization (HRU) and costs after alloHSCT has not been quantified. The goal of this study was to use real-world data to quantify the economic burden of NIPC and BOS in alloHSCT. Secondary goals were to: (1) quantify HRU and costs in alloHSCT patients and (2) quantify the marginal increase in HRU for NIPC patients.
Methods
Study design, data source, and study timeframe
The data source for this retrospective longitudinal study was the IQVIA PharMetrics Plus commercial database. The study timeframe was 1 January 2006 through 30 September 2018. The PharMetrics Plus database contains fully adjudicated, deidentified medical and prescription drug claims for over 150 million individuals enrolled in health insurance plans in the United States. The claims in this database reflect the health care encounters for patients and include information on setting of care, type and date of service, and actual reimbursement amounts paid by insurers to providers for each health care encounter. The database also contains demographic and enrollment information. The database is representative of the commercially insured United States population for individuals <65 years. This study was exempt from IRB approval, as it did not involve any interventional biomedical research with human subjects.
Patient selection
Study participants were patients treated with alloHSCT, which was identified using Current Procedural Terminology (CPT) procedure codes and International Classification of Diseases, Ninth Revision & Tenth Revision, Clinical Modification (ICD-9-CM & ICD-10 CM) diagnosis and procedure codes. The medical coding transition from ICD-9-CM to ICD-10-CM took effect on 1 October 2015, and we used ICD-9-CM codes prior to this date and ICD-10-CM codes subsequently. AlloHSCT patients were identified in both inpatient and outpatient hospital settings using clinical codes listed in an online appendix (supplemental Table 1).
Patients were limited to <65 years as individuals aged ≥65 years could have Medicare coverage, with claims not observable in the commercial claims data. Patients were also required to be observable for at least 12 months before and after the index transplant, with no evidence of transplantation for 1 year before the index transplant claim. We excluded patients with a diagnosis of chronic obstructive pulmonary disease (COPD) prior to transplantation, as those patients could be miscategorized as developing NIPC following transplantation. Subgroups of patients observable for at least 1, 2, 3, 4, and 5 years post-transplant were identified (Figure 1A-B).
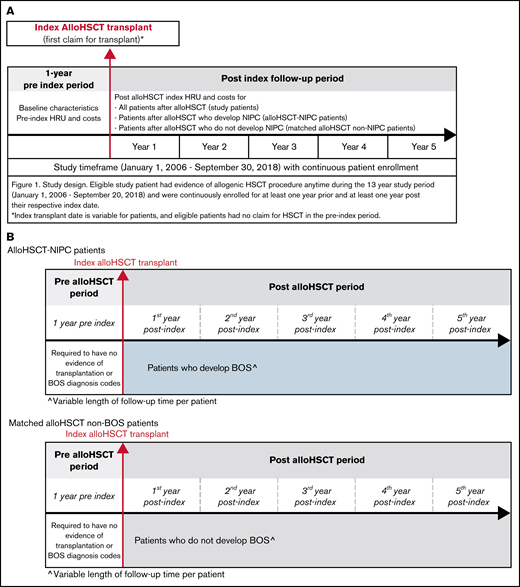
Study design, timeframe, and measures. (A) study design and timeframe requirements for all patient cohorts. (B) The study design and timeframe requirements for propensity score matched alloHSCT-NIPC patients and alloHSCT non-NIPC patients.
Study design, timeframe, and measures. (A) study design and timeframe requirements for all patient cohorts. (B) The study design and timeframe requirements for propensity score matched alloHSCT-NIPC patients and alloHSCT non-NIPC patients.
NIPC and non-NIPC patients
In order to evaluate the impact of NIPC on HRU and costs, we identified patients with an index diagnosis for NIPC after transplantation. We considered patients to be newly diagnosed with NIPC if they had no claims with a diagnosis code for NIPC prior to transplantation and a first claim with 1 of these diagnoses following transplantation. Patients with no diagnoses for NIPC prior to or following transplantation were considered non-NIPC patients; for NIPC, we used clinical codes listed in an online appendix (supplemental Table 2A).
We then used propensity score (PS) matching to identify alloHSCT patients who were as similar as possible to NIPC patients (cases) but who did not develop NIPC after alloHSCT (controls), allowing us to identify the additional burden of NIPC between the 2. The PS matching was performed using all observable demographic and clinical characteristics, health status, comorbidity conditions, and follow-up time after transplantation.
Subgroup analysis
We identified a subset of patients who developed BOS following transplantation using a subset of NIPC diagnosis codes. We based this on clinical input and a review of medical records for patients with confirmed BOS following alloHSCT, as there is no ICD-9 or ICD-10 diagnosis code specific to BOS. Costs were compared with all study patients and with PS-matched cases. Clinical codes used to identify alloHSCT, NIPC, and BOS are listed in an online appendix (supplemental Tables 1 and 2).
Study outcomes
We identified patient demographic and clinical characteristics in the year prior to the index transplant and patient age as of the index transplant date. The Charlson Comorbidity Index (CCI) was used to estimate overall disease burden. The CCI is a widely used measure of illness burden originally developed to estimate the odds of 1-year mortality among hospitalized patients. It is calculated using comorbidities identified through ICD-9 and ICD-10 diagnosis codes; each comorbid condition is assigned a numerical weight. These weights are then summed to generate a value that reflects each patient’s illness burden.17 Clinical codes used to calculate the CCI are listed in an online appendix (supplemental Table 3).
We calculated mean annual per patient rates of all-cause HRU during the year before and each of the first through fifth years after the index transplant. HRU included inpatient hospital admissions, emergency department (ED) visits, outpatient hospital visits, physician office visits, other outpatient services, and prescription medications. ED visits were those where a patient was not admitted to the hospital, as an ED visit that results in hospital admission is not reported separately from the claim for the hospitalization. We also examined pulmonary function testing; these tests were identified using procedure codes, which are listed in an online appendix (supplemental Table 10).
We also calculated annual per patient costs associated with each of these resource utilization categories during the 1-year pre-index and each post-index year. Note that the costs for the index transplant were included in the first follow-up year costs. All analyses for the second, third, fourth, and fifth post-index years were conducted using the subsets of patients observable at least 2, 3, 4, and 5 years post-alloHSCT, respectively. Costs were the amounts reimbursed by payers to providers. Because commercial claims do not include reliable mortality data, it was not possible to determine whether patients had died or, alternatively, moved to Medicare or other insurance coverage when they were not observable beyond the first or a subsequent study year.
Statistical analysis
We conducted descriptive HRU and cost analyses for all study groups, reporting means and standard deviations, frequencies, and proportions. To quantify the effect of NIPC on HRU and costs, we compared annual per patient HRU and costs among matched NIPC and non-NIPC patients following index transplant. We used Student t-tests for continuous variables and χ-squared tests for categorical variables to evaluate whether differences between NIPC and non-NIPC patients were significant. Finally, we conducted cost analyses for the BOS subgroup to examine whether BOS patients were similar to NIPC patients overall. All statistical analyses were performed using the statistical software SAS 9.4.
Results
Study patients
Allogeneic HSCT patients.
Among 2162 patients with an alloHSCT procedure who met study inclusion criteria, 46% were female, with a mean age of 42.9 years (SD: ±17.3 years). Patients were lost to follow-up over the study period, with 1305 (60%) observable for at least 2 years, 825 (38%) observable at least 3 years, 564 (26%) observable at least 4 years, and 366 (17%) observable at least 5 years following transplantation. During the pre-index period, the cohort of 2162 patients had a mean CCI of 3.0 (SD: ±2.3), consistent with a substantial illness burden. Chronic pulmonary disease (CPD) is defined in the CCI as asthma or COPD. Since patients with COPD were excluded from the study, the remaining 19% of patients identified as having CPD specifically had asthma. A small number of patients had diagnoses of pulmonary fibrosis or interstitial lung disease (n = 73; 3%).
PS-matched NIPC and non-NIPC control patients.
Among the cohort of alloHSCT patients (n = 2162), 12% (n = 254) developed NIPC within 5 years of their index transplant (hereafter referred to as alloHSCT-NIPC). Out of the 254 patients who developed NIPC, 83% developed it within 2 years of transplant. In our analysis of PS-matched patients, a total of 155 alloHSCT-NIPC patients were 1:1 matched to alloHSCT patients who did not develop NIPC (ie, matched controls). All patients were observable for at least 1 year following alloHSCT; nearly half were observable for 2 or more years (NIPC: n = 73; non-NIPC: n = 74). The matched alloHSCT-NIPC and non-NIPC control patients were similar, with no significant differences at P < .05 on most observable characteristics. The non-NIPC patient group had a baseline mean CCI of 3.3, while the NIPC group had a mean CCI of 3.5 (Table 1).
Study patient demographic and clinical characteristics
| Overall alloHSCT patients, n (%) | Propensity-matched analysis | ||
|---|---|---|---|
| alloHSCT-NIPC patients, n (%) | alloHSCT non-NIPC patients, n (%) | ||
| Total patients | 2167 | 155 | 155 |
| Female, n (%) | 1004 (46) | 61 (39) | 58 (37) |
| Age (years), mean ± SD | 42.9 ± 17.3 | 51.1 ± 12.9 | 50.2 ± 14.1 |
| Age groups, n (%) | |||
| <18 y | 259 (12) | *** | *** |
| 18-40 y | 536 (25) | 21 (14) | 20 (13) |
| 41-64 y | 1367 (63) | 129 (83) | 127 (82) |
| Geographic region, n (%) | |||
| Midwest | 734 (34) | 61 (39) | 61 (39) |
| Northeast | 478 (22) | 34 (20) | 28 (18) |
| South | 768 (36) | 52 (34) | 54 (35) |
| West | 167 (8) | 11 (7) | 12 (8) |
| Health plan type, n (%) | |||
| Preferred provider organization | 1781 (82) | 128 (83) | 133 (86) |
| Point of service | 74 (3) | *** | *** |
| Health maintenance organization | 233 (11) | 14 (9) | 12 (8) |
| Other | 61 (3) | *** | *** |
| Year of transplant, n (%) | |||
| 2007 | 107 (5) | *** | *** |
| 2008-2009 | 381 (18) | 37 (24) | 29 (19) |
| 2010-2011 | 417 (19) | 37 (24) | 17 (11) |
| 2012-2013 | 468 (22) | 30 (19) | 38 (25) |
| 2014-2015 | 452 (21) | 29 (19) | 33 (21) |
| 2016-Q32017 | 337 (16) | 16 (10) | 30 (19) |
| Clinical characteristics, n (%) | |||
| Myocardial infarction | 71 (3) | *** | *** |
| Congestive heart failure | 234 (11) | 24 (15) | 15 (10) |
| Peripheral vascular disease | 123 (6) | 13 (8) | 12 (8) |
| Cerebrovascular disease | 110 (5) | *** | 11 (7) |
| Dementia | *** | 0 (0) | *** |
| Asthma | 419 (19) | 41 (26) | 29 (19) |
| Rheumatic disease | 54 (2) | *** | *** |
| Peptic ulcer disease | 23 (1) | *** | 0 (0) |
| Liver disease | 415 (19) | 40 (26) | 33 (21) |
| Diabetes | 310 (14) | 30 (19) | 22 (14) |
| Hemiplegia or paraplegia | 22 (1) | *** | *** |
| Renal disease | 124 (6) | 14 (9) | *** |
| Cancer | 1678 (78) | 146 (94) | 136 (88) |
| HIV/AIDS | *** | 0 (0) | 0 (0) |
| Charlson comorbidity index score, mean ± SD | 3.0 ± 2.3 | 3.5 ± 2.1 | 3.3 ± 2.2 |
| Time period patients observable | |||
| 12+ months | 2162 (100) | 155 (100) | 155 (100) |
| 24+ months | 1305 (60) | 73 (47) | 74 (48) |
| 36+ months | 825 (38) | 47 (30) | 47 (30) |
| 48+ months | 564 (26) | 33 (21) | 31 (20) |
| 60+ months | 366 (17) | 21 (14) | 18 (12) |
| Year of NIPC diagnosis | |||
| Year 1 after transplantation | 135 (53) | 79 (51) | — |
| Year 2 after transplantation | 79 (31) | 50 (32) | — |
| Year 3 after transplantation | 24 (10) | 15 (10) | — |
| Year 4 or 5 after transplantation | 16 (6) | 11 (7) | — |
This table describes the demographics and comorbidities for the overall alloHSCT cohort, as well as the propensity-matched NIPC and non-NIPC alloHSCT patients.
Among all alloHSCT patients, 254 developed NIPC, but only 155 were propensity-matched. These totals were used to calculate percentages in the year of index NIPC diagnosis. ***, patient count was <11.
Health care resource utilization and costs
Allogeneic HSCT patients.
Among all alloHSCT patients, the mean annual number of per patient inpatient hospital admissions was high in both the pre-index (2.9 SD: ±2.9) and first post-index years (2.7 SD: ±3.2). The mean inpatient length of stay (LOS) for each hospitalization was also high (pre-index: 45.4 days [SD: ±64.6 days]; first-year post-index: 50.4 days [SD: ±238.2 days]). Outpatient healthcare use was also high before and after alloHSCT, with multiple per patient office visits (pre-index: 22.4 [SD: ±19.9]; first year postindex: 21.4 [SD: ±20.9]), outpatient hospital visits (pre-index: 30.5 [SD: ±24.2]; first year post-index: 45.2 [SD: ±33.0]), and ED visits (pre-index: 1.1 [SD: ±2.7]; first year post-index: 0.6 [SD: ±1.2]). Among patients observable in the second post-alloHSCT year, HRU rates were lower, with 0.8 (SD: ±2.0) inpatient admissions per patient, on average, 16.4 (SD: ±16.8) office visits, 19.4 (SD: ±22.9) outpatient hospital visits, and 0.6 (SD: ±1.2) ED visits. Among patients observable for 3, 4, or 5 years, HRU rates continued to trend downward (Table 2; supplemental Table 4).
HRU: all alloHSCT patients
| Pre-alloHSCT | Post-alloHSCT (years 1,2)* | ||
|---|---|---|---|
| Mean number per patient | Year −1 | Year 1 | Year 2 |
| Mean ± SD | n = 2162 | n = 2162 | n = 1305 |
| Patients with 1+ hospital admission, n (%) | 1614 (75) | 1895 (88) | 398 (30) |
| Number of inpatient admissions, per patient, mean ± SD | 2.9 ± 2.9 | 2.7 ± 3.2 | 0.8 ± 2.0 |
| Length of stay per admission (days), mean ± SD | 45.4 ± 64.6 | 50.4 ± 238.2 | 28.6 ± 55.8 |
| Annual number of outpatient visits per patient, mean ± SD | |||
| Physician office visit | 22.4 ± 19.9 | 21.5 ± 21.0 | 16.4 ± 16.8 |
| Outpatient hospital visit | 30.5 ± 24.2 | 45.2 ± 33.0 | 19.4 ± 22.9 |
| ED visit | 1.1 ± 2.7 | 0.9 ± 2.3 | 0.6 ± 1.2 |
| Number of pulmonary function test dates of any kind† | 2.3 ± 1.8 | 1.8 ± 2.7 | 1.7 ± 3.0 |
| Number of days with 1+ treatments of any kind | 0.9 ± 1.8 | 1.7 ± 5.7 | 2.1 ± 7.5 |
| Annual number of prescription fills per patient, mean ± SD | |||
| Chemotherapy | 5.8 ± 9.3 | 2.2 ± 5.6 | 1.4 ± 4.3 |
| Immunosuppressive agents | 0.4 ± 2.3 | 6.9 ± 8.9 | 3.4 ± 6.7 |
| Antifungals | 0.3 ± 2.3 | 1.7 ± 7.5 | 0.6 ± 4.7 |
| Antibiotics | 3.1 ± 3.2 | 4.0 ± 5.3 | 3.7 ± 4.9 |
| Antivirals | 1.6 ± 2.4 | 7.6 ± 7.4 | 4.5 ± 4.9 |
This table shows the HRU for all patients that received an alloHSCT transplant in the follow-up years 1 and 2 compared with the period before transplant.
Years 3 through 5 in supplemental Materials.
Pulmonary function test includes spirometry, lung function volume, lung diffusion capacity, and plethysmography.
In the year prior to transplant, total costs for these patients averaged $278 008 (SD: ± $545 470), largely driven by costs for hospitalizations ($194 679 [SD: ± $537 405]). Among alloHSCT patients, total costs per patient in the first year post-transplant averaged $417 605 (SD: ±$543 299); these included the costs for alloHSCT. Hospitalizations were responsible fo most of these costs ($312 852 [SD: ±494 762]), with the remainder reflecting outpatient services ($86 388; [SD: ±125 987]) and prescription medications ($17 864; [SD: ±36 589]). In years 2 through 5 post-transplant, costs declined substantially. Mean total costs per patient were $108 863 (SD: ±$327 050), $64 245 (SD: ±$222 575), $52 611 (SD: ±$266 776), and $33 264 (SD: ±$89 934), in years 2, 3, 4, and 5 post-transplant, respectively (Table 3; supplemental Table 5).
Mean annual per patient costs: all alloHSCT patients
| Annual per patient costsMean ± SD | Pre-alloHSCT ($) | Post-alloHSCT (years 1,2)* ($) | |
|---|---|---|---|
| Year −1 | Year 1 | Year 2 | |
| n = 2 162 | n = 2 162 | n = 1 305 | |
| Inpatient costs | 194 679 ± 537 405 | 312 852 ± 494 762 | 57 464 ± 297 070 |
| ER costs | 646 ± 1 423 | 578 ± 1 423 | 431 ± 1 174 |
| Outpatient costs | 60 030 ± 56 687 | 86 388 ± 125 987 | 31 594 ± 67 273 |
| Physician office costs | 5 351 ± 7 577 | 5 538 ± 11 094 | 3 211 ± 5 499 |
| Outpatient hospital costs | 49 925 ± 54 398 | 72 953 ± 121 283 | 31 594 ± 67 273 |
| Other outpatient costs | 4 754 ± 12 709 | 7 897 ± 18 568 | 4 343 ± 29 334 |
| Pulmonary function test costs† | 494 ± 986 | 381 ± 884 | 350 ± 922 |
| Medication costs | 22 653 ± 47 051 | 17 864 ± 36 589 | 11 820 ± 37 898 |
| Chemotherapy | 20 948 ± 45 809 | 8 965 ± 29 808 | 8 605 ± 35 638 |
| Immunosuppressive agents | 495 ± 4 909 | 3 781 ± 9 738 | 1 577 ± 5 827 |
| Antifungals | 681 ± 6 703 | 1 852 ± 9 546 | 717 ± 5 784 |
| Antibiotics | 225 ± 1 268 | 301 ± 870 | 227 ± 1 580 |
| Antivirals | 288 ± 2 044 | 2 855 ± 7 327 | 661 ± 3 095 |
| TOTAL | 278 008 ± 545 470 | 417 605 ± 543 299 | 108 863 ± 327 050 |
This table shows the mean costs for all patients that received an alloHSCT transplant in the follow-up years 1 and 2 compared with the period before transplant.
Years 3 through 5 in supplemental Materials.
Pulmonary function test includes spirometry, lung function volume, lung diffusion capacity, and plethysmography.
PS-matched NIPC and non-NIPC patients.
HRU.
Prior to transplantation, HRU rates were high for both PS-matched cases and controls. The mean inpatient length of stay for hospitalization was 38.4 days for cases (SD: ±36.3) and 42.3 days in controls (SD: ±34.9). Among matched patients, those who developed NIPC following alloHSCT had significantly higher mean annual numbers of per patient inpatient admissions compared with non-NIPC patients in the first year post-transplant (NIPC: 3.8; SD: ±3.2; vs non-NIPC 2.6; SD: ±2.4; P < .001). AlloHSCT-NIPC patients also had longer stays for each admission (length of stay: NIPC: 68.7 days; SD: ±109.7 vs non-NIPC: 41.5; SD: ±46.3; P < .1). Rates of outpatient hospital visits were significantly higher for NIPC patients, compared with non-NIPC (55.6; SD: ±31.0 vs 44.8; SD: ±8.9; P < .1), as were rates of pulmonary function testing (mean number of tests per patient: NIPC: 3.0 SD: ±3.5 vs non-NIPC: 2.1 SD: ±2.5, P < .001) (Table 4; supplemental Table 6). In subsequent years, NIPC patients had consistently higher rates of HRU compared with non-NIPC matched controls. NIPC patients continued to have higher rates of inpatient admissions (NIPC vs non-NIPC: year 2: 1.7 [SD: ±2.7] vs 0.7 [SD: ±1.5] P < .05; year 3: 0.9 [SD: ±1.4] vs 0.2 [SD: ±0.6] P < .01; year 4: 0.6 [SD: ±1.7] vs 0.2 [SD: ±0.5] P = .16; year 5: 1.0 [SD: ±2.5] vs .2 [SD: ±0.5] P = .15). Rates of office visits, ED visits, and outpatient hospital visits also remained higher for NIPC patients.
HRU: PS-matched alloHSCT-NIPC patients and alloHSCT non-NIPC patients
| AlloHSCT-NIPC patients (years 1,2)† | AlloHSCT non-NIPC patients (years 1,2)† | |||||
|---|---|---|---|---|---|---|
| Year −1 | Year 1 | Year 2 | Year −1 | Year 1 | Year 2 | |
| n = 155 | n = 155 | n = 73 | n = 155 | n = 155 | n = 74 | |
| Patients with 1+ hospital admission, n (%) | 127 (82%) | 149 (96%)*** | 39(53%)** | 124 (80%) | 145 (94%)*** | 24 (32%)** |
| Number of inpatient admissions, per patient, mean ± SD | 3.0 ± 2.8 | 3.8 ± 3.2*** | 1.7 ± 2.7* | 3.0 ± 2.5 | 2.6 ± 2.4*** | .7 ± 1.5* |
| Length of stay per admission (days), mean ± SD | 38.4 ± 36.3 | 68.7 ± 109.7** | 26.2 ± 37.5 | 42.3 ± 34.9 | 41.5 ± 46.3** | 23.9 ± 32.4 |
| Annual number of outpatient visits per patient, mean ± SD | ||||||
| Physician office visits | 24.6 ± 20.7 | 24.8 ± 21.8 | 23.4 ± 19.4*** | 25.4 ± 20.3 | 24.2 ± 21.5 | 13.9 ± 12.5*** |
| Outpatient hospital visits | 35.1 ± 20.0 | 55.6 ± 31.0** | 30.1 ± 24.7*** | 33.3 ± 20.8 | 44.8 ± 28.9** | 17.0 ± 14.6*** |
| ED visits | 1.0 ± 1.4 | 1.4 ± 3.6 | .8 ± 1.5 | 1.2 ± 2.0 | 1.0 ± 2.6 | .5 ± 1.0 |
| Number of pulmonary function test dates of any kind‡ | 2.6 ± 1.5 | 3.0 ± 3.5*** | 3.7 ± 4.0*** | 2.6 ± 1.7 | 2.1 ± 2.5*** | 1.5 ± 2.5*** |
| Number of days with 1+ treatments of any kind | .9 ± .8 | 2.3 ± 4.5 | 4.1 ± 8.0** | 0.8 ± 0.9 | 1.2 ± 2.4 | .7 ± 2.4** |
| Annual number of administrations or prescription fills per patient, mean ± SD | ||||||
| Chemotherapy | 6.9 ± 9.4 | 1.8 ± 3.4 | 1.2 ± 3.6 | 7.9 ± 11.1 | 2.8 ± 6.6 | 1.2 ± 3.3 |
| Immunosuppressive agents | .5 ± 2.6 | 8.0 ± 7.8 | 5.8 ± 6.5 | 0.7 ± 2.9 | 7.8 ± 8.3 | 4.3 ± 6.9 |
| Antifungals | .5 ± 3.4 | 1.8 ± 5.7 | .6 ± 2.2 | 0.4 ± 2.2 | 1.7 ± 6.9 | .4 ± 2.4 |
| Antibiotics | 3.4 ± 3.1 | 5.1 ± 4.7 | 6.0 ± 5.4 | 3.4 ± 3.0 | 5.0 ± 4.8 | 3.4 ± 3.9 |
| Antivirals | 1.8 ± 2.6 | 8.9 ± 5.8 | 6.1 ± 4.8 | 2.5 ± 2.9 | 9.3 ± 5.3 | 6.1 ± 4.7 |
This table shows the mean costs for matched alloHSCT patients (NIPC vs non-NIPC) in the follow-up years 1 and 2 compared with the period before transplant.
Years 3 through 5 in supplemental Materials.
Pulmonary function test includes spirometry, lung function volume, lung diffusion capacity, and plethysmography.
P value ≤ .05; **P value ≤ .01; ***P value ≤ .001.
Costs: PS-matched alloHSCT-NIPC patients and alloHSCT non-NIPC patients
| AlloHSCT-NIPC patients (years 1,2)† ($) | AlloHSCT non-NIPC patients (years 1,2)† ($) | |||||
|---|---|---|---|---|---|---|
| Year −1 | Year 1 | Year 2 | Year −1 | Year 1 | Year 2 | |
| n = 155 | n = 155 | n = 73 | n = 155 | n = 155 | n = 74 | |
| Inpatient costs | 161 326 ± 220 463 | 452 475 ± 987 060 | 100 862 ± 268 531 | 200 286 ± 254 098 | 300 202 ± 369 453 | 50 017 ± 153 685 |
| ER costs | 647 ± 1763 | 676 ± 1195 | 530 ± 1177 | 648 ± 1510 | 657 ± 2229 | 439 ± 1117 |
| Outpatient costs | 67 873 ± 61 258 | 95 476 ± 105 479 | 55 207 69 012* | 65 249 ± 44 532 | 89 768 ± 79 073 | 32 208 ± 40 351* |
| Physician office costs | 6095 ± 8813 | 6346 ± 11 531 | 5163 ± 8175 | 7189 ± 8419 | 8153 ± 12 483 | 4158 ± 9408 |
| Outpatient hospital costs | 58 124 ± 58 581 | 79 611 ± 103 434 | 46 255 ± 66 538* | 53 310 ± 44 005 | 72 464 ± 76 650 | 24 378 ± 29 101* |
| Other outpatient costs | 3654 ± 6394 | 9519 ± 17 234 | 3789 ± 8383 | 4751 ± 9417 | 9151 ± 22 501 | 3672 ± 18 194 |
| Pulmonary function test costs‡ | 491 ± 742 | 519 ± 834* | 661 ± 952 | 722 ± 1381 | 587 ± 1984* | 463 ± 1529 |
| Medication costs | 27 622 ± 49 880 | 19 243 ± 31 079 | 15 671 ± 38 759 | 33 654 ± 61 905 | 21 772 ± 43 206 | 10 268 ± 23 417 |
| Chemotherapy | 25 558 ± 48 627 | 9660 ± 26 216 | 10 862 ± 36 389 | 30 943 ± 61 299 | 9029 ± 21 320 | 6738 ± 20 571 |
| Immunosuppressive agents | 505 ± 3980 | 3990 ± 5811 | 2554 ± 4080 | 868 ± 5086 | 5117 ± 18 152 | 2016 ± 4443 |
| Antifungals | 970 ± 8561 | 1605 ± 5260 | 396 ± 1524 | 830 ± 5210 | 2757 ± 17 967 | 226 ± 1660 |
| Antibiotics | 305 ± 1140 | 447 ± 891 | 277 ± 466 | 377 ± 2797 | 503 ± 1239 | 234 ± 793 |
| Antivirals | 254 ± 1007 | 3493 ± 6211 | 517 ± 6427 | 630 ± 3861 | 4336 ± 9926 | 1038 ± 3874 |
| Total | 257 468 ± 255 419 | 567 870 ± 1 014 222 | 172 269 ± 323 740 | 299 837 ± 263 313 | 412 400 ± 404 915 | 92 932 ± 170 863 |
This table shows the HRU for matched alloHSCT patients (NIPC vs non-NIPC) in the follow-up years 1 and 2 compared with the period before transplant.
Years 3 through 5 in supplemental Materials.
Pulmonary function test includes spirometry, lung function volume, lung diffusion capacity, and plethysmography.
P value ≤ .05.
HEALTH CARE COSTS.
In the year before transplantation, healthcare costs were similar for PS-matched NIPC and non-NIPC patients. Mean total costs per patient for cases and controls were $257 468 (SD: ±$255 419) and $299 837 (SD: ±263 313), respectively. In the first post-alloHSCT year however, costs inclusive of transplant were $155 470 higher for alloHSCT-NIPC patients compared with matched controls ($567 870 vs $412 400; P = .07). Much of this difference reflected higher costs for hospital admissions ($452 475; SD: ±$987 060 vs $300 202; SD: ±$369 453; P = .06), although AlloHSCT-NIPC patients also had higher average per patient costs for outpatient hospital visits (alloHSCT-NIPC: $79 611 [SD: ±103 434] vs controls: $72 464 [SD: ±76 650] P = .49) although mean per patient costs for physician office visits were lower (alloHSCT-NIPC: $6346 [SD: ±11 531] vs controls: $8153 [SD: ±12 483] P = .19). Overall, mean per patient costs for outpatient services were higher for alloHSCT-NIPC patients (alloHSCT-NIPC: $95 476 [SD: ±105 479] vs controls: $89 768 [SD: ±79 073] P = .59). Additionally, these patients had slightly lower prescription medication costs (alloHSCT-NIPC: $19 243 [SD: ±31 079] vs controls: $21 772 [SD: ±43 206] P = .59). These differences may have reflected lengthier hospital stays among NIPC patients when they would not have had outpatient encounters. Among NIPC and control patients observable for at least 2 years following transplantation (NIPC: n = 73; non-NIPC: n = 74), mean annual per patient costs declined in the second post-transplant year, but were nearly 85% greater for NIPC patients ($172 269 SD ±$323 740 vs $92 932; SD ±$170 863; P = .07). This difference reflected higher costs for inpatient admissions ($100 862; SD ±$268 531 vs $50 017; SD ±$153 685; P = .16), outpatient services ($55 207; SD ±$69 012 vs $32 208; SD ±$40 351; P < .05), and prescription medications ($15 671; SD ±$38 759 vs $10 268; SD ±$23 417; P = .31) (Table 5). In follow-up years 3, 4, and 5 costs for NIPC cases were nearly 2 times as high as non-NIPC controls, despite both groups experiencing an overall downward trend in costs (Figure 2A-B; supplemental Table 7).
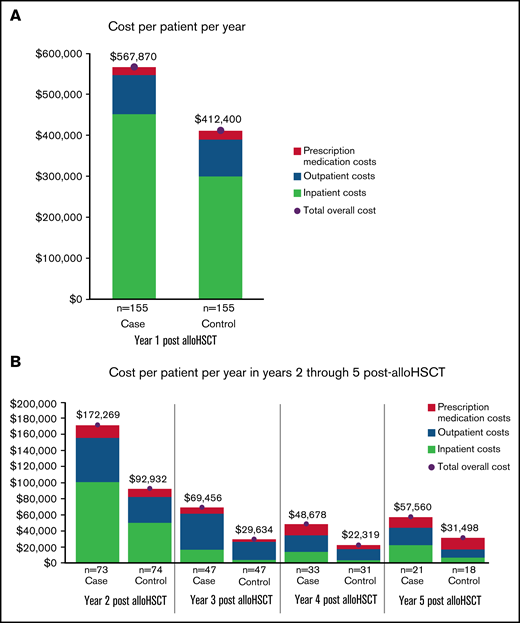
Health care costs for alloHSCT NIPC and matched alloHSCT non-NIPC patients. (A-B) The vertical axis depicts mean annual patient costs stratified by cost sources. The horizontal axis separates the cost by patient cohort. Costs by cohort and sources are listed below the chart: emergency room (ER), prescription medication, outpatient, and inpatient costs.
Health care costs for alloHSCT NIPC and matched alloHSCT non-NIPC patients. (A-B) The vertical axis depicts mean annual patient costs stratified by cost sources. The horizontal axis separates the cost by patient cohort. Costs by cohort and sources are listed below the chart: emergency room (ER), prescription medication, outpatient, and inpatient costs.
Subgroup analysis of likely BOS patients.
A subgroup analysis of likely BOS patients (n = 69) generated results consistent with those from the matched NIPC and non-NIPC patient cohorts. In the year before diagnosis, BOS patients had a mean 2.5 inpatient admissions (SD: ±2.2) per patient, with a mean length of stay of 32.7 days (SD: ±32.6) per admission. For the first year following, inpatient admissions increased to a mean value of 3.5 (SD: ±2.8) and a mean length of stay of 50.0 days (SD: ±59.9) per patient. Although HRU is slightly lower than the overall cohort of alloHSCT NIPC patients, it was still higher than the cohort of alloHSCT non-NIPC patients. In the year before diagnosis, mean annual per patient costs for this subgroup were $233 583; SD ±$275 945. Much of this cost came from inpatient admissions of $140 825 (SD: ±237 810). In the first year following transplantation, mean annual costs per patient were $470 241 (SD: $1 192 807), again largely reflecting inpatient admissions ($374 639; SD: ±1 163 118). Costs per patient decreased in the second year post-transplant among patients who were observable, but remained high (n = 39; mean: $130 257; SD ±$284 383), with lower inpatient admission rates in this year compared with the first post-transplant year. In subsequent follow-up years, costs declined substantially for patients who remained observable (year 3: $73 801 ± $119 332; year 4: $30 367 ± $46 931; year 5: $35 629 ± $40 526). Like the cohort of alloHSCT-NIPC patients from which this subset was drawn, HRU and costs for BOS patients were higher compared with non-NIPC controls in all follow-up years. Their costs were lower than those of the NIPC cases, except for the third year of follow-up, when overall costs were higher compared with the alloHSCT-NIPC cohort, possibly reflecting the small sample size. The number of likely BOS patients diagnosed in the second year after transplantation who were observable a year later was quite small, potentially reflecting mortality or changes in insurance coverage.
Discussion
Principal findings
Patients who develop NIPCs after alloHSCT, including BOS, have significantly higher rates of inpatient admissions and longer lengths of stay and incur substantially higher costs than patients who do not. In our analysis of real-world data, allogeneic HSCT was associated with costs of over $400 000 per patient on average in the first year following transplantation. In our PS-matched analysis, costs for patients who developed NIPC were nearly $160 000 per patient higher in the first post-transplant year compared with those who did not. Additionally, NIPC patients were hospitalized significantly more often (alloHSCT-NIPC: 3.8; SD: ±3.2 vs controls: 2.6; SD: ±2.4), with lengthier hospitalizations (alloHSCT-NIPC 68.7; SD: ±109.7 vs controls: 41.5; SD: ±46.3), compared with non-NIPC controls. These differences in costs and HRU persisted into the second year post-transplant, with costs for NIPC patients approximately 2 times those of non-NIPC patients. In the subset of NIPC patients identified as likely BOS patients, costs were also higher than those of non-NIPC patients. To the best of our knowledge, ours is the first study to quantify the increase in HRU and direct medical costs in patients who develop NIPCs after alloHSCT.
Findings in context
While the burden of NIPC after lung transplantation is well-described,11 the economic burden of NIPCs after alloHSCT has not been studied in detail. Despite advances in care after HSCT, NIPCs are associated with increased rates of death,17, 18 as well as an increased burden of respiratory symptoms, which can affect health-related quality of life. Broder et al. estimate the costs in the 100 days following transplant at $355 000.2 Our estimates of mean costs for alloHSCT patients at 1 year (approximately $420 000 per patient) reflect costs beyond the first 100 days and include patients whose unusually high costs increase the average costs above the median.
NIPCs after alloHSCT are most commonly seen in the first 2 years following transplantation. Collectively, NIPCs contribute significantly to treatment-related morbidity and mortality. However, our study is the first to estimate the marginal increase in HRU costs associated with patients who develop NIPCs. Using data from population-based databases and secondary sources to predict the total economic burden of BOS, Jones et al estimated that over 14 000 patients will require treatment for BOS from 2015-2025, accruing over 82 000 years of lost wages and generating about $3.7 billion in direct and indirect costs.19 They also estimated the 10-year cost of treating patients with BOS to be $1.3 billion, with the economic burden of BOS estimated to exceed $5 billion over a period of 10 years in the United States alone. Our study further quantifies the extent to which BOS diminishes the potential value of HSCT.
BOS is an NIPC of particular interest because it is associated with increased mortality after transplantation, a high burden of respiratory symptoms, poorer outcomes, and a lower quality of life.20,21 Our findings in BOS patients mirror those in the matched patients with NIPCs, showing higher health-related costs in all years, although these costs may reflect patients with more severe and rapidly advancing disease and those with disease that develops more slowly.22 In either case, however, increased immunosuppression, which is associated with a higher risk of infection, may be especially harmful to patients with significant lung disease due to BOS.23 The high increased marginal cost of BOS supports relatively inexpensive strategies such as home spirometry, which can be helpful to diagnose BOS early in its course.19 Furthermore, the increased cost associated with BOS supports the development of novel therapeutics to mitigate pulmonary impairment in treatment-refractory cases. Testing and treatment improvements could benefit patients who develop BOS following lung transplantation as well as alloHSCT, as pulmonary degradation and treatment is the same in patients who develop BOS following both types of transplantation.13
Limitations
Our study patients are most likely to be NIPC patients, but we could not confirm this with a detailed chart review, as we used claims data, which do not include clinical data clinical values. Additionally, there is no ICD-10 diagnosis code specific to BOS, a limitation that highlights the need for a specific diagnosis code for BOS. The ICD diagnosis codes we included for our case definition of NIPC did not include acute respiratory distress syndrome since we could not rule out the possibility of infection.
Further, in the matched cohort analysis, both NIPC and non-NIPC patients may have had nonpulmonary manifestations of graft-versus-host disease (GvHD) that contributed to their costs. While we could not distinguish severe GvHD in these patients, rates of immunosuppressive therapy, which would be indicated for GvHD, were similar in NIPC cases and non-NIPC controls in the year following transplantation, suggesting that GvHD was not the major driver for cost and HRU differences in the first post-transplant year. We limited study patients to those <65 with commercial insurance coverage, and thus our results would not be generalizable to older patients with Medicare coverage or pediatric patients. We required patients to be observable for at least 1 year following transplantation, which likely led to survivorship bias in our analyses.
Indeed, our 12% rate of NIPC is lower than the 20% rate noted in the study by Bergeron et al.18 ,24 It is likely that some alloHSCT recipients may have died with NIPC in the first post-transplant year, which could result in an underestimation in the rate of NIPC in our cohort. Similarly, few patients were observable over the full 5-year study period, and it is possible that those who remained were healthier and potentially less expensive than those who were lost to follow-up.
Outpatient transplantation is associated with lower costs compared with inpatient transplantation. As a result, it is possible that some of the NIPC costs captured in the first post-transplant year reflect differences in transplantation settings, with more NIPC patients receiving their transplant in an inpatient setting. However, we would expect outpatient hospital and office visit rates to be higher for non-NIPC patients in the first post-transplant year, reflecting higher numbers of outpatient encounters for transplant, which we do not observe. The higher hospitalization rates for NIPC patients persist over our study period, suggesting that much of the burden of these patients is associated with NIPC rather than with transplantation.
Conclusion
NIPCs, and in particular BOS, increase the economic burden of an expensive but potentially life-saving procedure. AlloHSCT recipients who develop an NIPC in the United States have higher rates of hospitalization and inpatient costs, compared with alloHSCT recipients with no evidence of NIPC. These higher rates of HRU are accompanied by additional mean per patient costs in the first post-alloHSCT year, and, although costs declined in subsequent years, they were substantially higher for NIPC patients observable in our study. More frequent and consistent lung function testing for patients at risk of developing NIPCs will have meaningful implications for HRU and warrant effective treatments. Studies of NIPCs should consider collecting HRU and cost data prospectively to be able to better determine the attribution of cost and HRU to NIPC vs comorbid conditions.
Authorship
Contribution: A.S., N.C.S., B.E.H., and G.B. designed the research; B.E.H., N.S., and P.L.C. analyzed data; and A.S., S.R., and N.C.S. wrote the paper.
Conflict-of-interest disclosure: PRECISIONheor received funding from Breath Therapeutics, a division of Zambon, for the research reported here. N.C.S., B.E.H., P.L.C., and S.R. are employees of PRECISIONheor. G.B. is an employee of Breath Therapeutics, a Zambon company.
Correspondence: Naomi C. Sacks, Precision Health Economics and Outcomes Research,133 Federal Street, 10th Floor, Boston, MA 02110; e-mail: naomi.sacks2@precisionvh.com.

