

Key Points
The interferon–driven inflammatory response and the PD-1 signaling were the most relevant modulators of the THRLBCL immune response.
THRLBCL cases may be enriched in TCF1+ T cells, a subset of progenitor exhausted T cells associated with good response to immunotherapy.

Abstract
T-cell/histiocyte-rich large B-cell lymphoma (THRLBCL) is a rare and aggressive variant of diffuse large B-cell lymphoma (DLBCL) that usually affects young to middle-aged patients, with disseminated disease at presentation. The tumor microenvironment (TME) plays a key role in THRLBCL due to its peculiar cellular composition (<10% neoplastic B cells interspersed in a cytotoxic T-cell/histiocyte-rich background). A significant percentage of THRLBCL is refractory to rituximab, cyclophosphamide, doxorubicin, vincristine, and prednisone (RCHOP)-based regimens and to chimeric antigen receptor T-cell therapy; thus, the development of a specific therapeutic approach for these patients represents an unmet clinical need. To better understand the interaction of immune cells in THRLBCL TME and identify more promising therapeutic strategies, we compared the immune gene expression profiles of 12 THRLBCL and 10 DLBCL samples, and further corroborated our findings in an extended in silico set. Gene coexpression network analysis identified the predominant role of the programmed cell death protein 1 (PD-1)/programmed cell death ligand 1 (PD-L1) axis in the modulation of the immune response. Furthermore, the PD-1/PD-L1 activation was flanked by the overexpression of 48 genes related to the functional exhaustion of T cells. Globally, THRLBCL TME was highly interferon-inflamed and severely exhausted. The immune gene profiling findings strongly suggest that THRLBCL may be responsive to anti–PD-1 therapy but also allowed us to take a step forward in understanding THRLBCL TME. Of therapeutic relevance, we validated our results by immunohistochemistry, identifying a subset of TCF1+ (T cell–specific transcription factor 1, encoded by the TCF7 gene) progenitor exhausted T cells enriched in patients with THRLBCL. This subset of TCF1+ exhausted T cells correlates with good clinical response to immune checkpoint therapy and may improve prediction of anti–PD-1 response in patients with THRLBCL.
Introduction
T-cell/histiocyte-rich large B-cell lymphoma (THRLBCL), originally considered an uncommon variant of diffuse large B-cell lymphoma (DLBCL), has been recognized by the World Health Organization as a distinct clinicopathologic entity since 2008.1 It is a rare hematologic disease, accounting for <10% of all DLBCLs, predominantly affecting middle-aged men, often in advanced clinical stage, with hepatosplenomegaly and bone marrow involvement. Morphologically, THRLBCL is composed of <10% (sometimes 1%) atypical CD20+ B cells surrounded by a vast tumor microenvironment rich in cytotoxic T cells/histiocytes, critically supporting the malignant condition.2-4 Similarly to DLBCL, THRLBCL is often treated with rituximab, cyclophosphamide, doxorubicin, vincristine, and prednisone (RCHOP) or with other RCHOP-like regimens.5 However, a significant percentage of patients with THRLBCL show aggressive clinical behavior, with a median overall survival of 5 years and refractoriness to current therapies; more importantly, relapsed/refractory (r/r) THRLBCL also appears to be highly resistant to CD19-directed chimeric antigen receptor (CAR) T-cell therapy, which represented a significant turning point for the treatment of r/r DLBCL.6
Thus, the development of a therapeutic approach specific for patients with THRLBCL remains an unmet need. Earlier work of gene expression profiling documented, in THRLBCL, the activation of an extensive but ineffective host immune response, possibly mediated by the stromal component.7-11 In particular, the THRLBCL microenvironment appeared hallmarked by a macrophage-activated status with expression of both proinflammatory and anti-inflammatory factors,7-9 possibly involving T cell–mediated immune escape in concert with upregulation of interferon (IFN)-γ and indoleamine 2,3 dioxygenase (IDO) inflammatory genes.8,10 In addition, a high content of programmed cell death protein 1 (PD-1)+ T cells was identified in THRLBCL stroma, corroborating the hypothesis of a tolerogenic milieu.10,11
More recently, Griffin et al12 recognized a critical role of PD-1 signaling in the immune evasion of THRLBCL. However, the molecular mechanism of THRLBCL immune response remains undefined, as does the role played by immune cells entering into the composition of the tumor microenvironment.
In the current work, to better understand the THRLBCL immune response and to identify therapeutic strategies specifically responding to the molecular features of the THRLBCL microenvironment, we analyzed and compared the immune gene profiling of THRLBCL vs DLBCL. We used a PanCancer Immune profiling assay (NanoString Technologies, Seattle, WA) composed of 730 immune-related genes specifically designed to identify immune cell types and molecular pathways, possibly modulating the tumor immune response.13
Materials and methods
Patients and specimens
Formalin-fixed, paraffin-embedded (FFPE) archival specimens of THRLBCL (n = 12) and DLBCL (n = 12) were selected from 2 prospective randomized phase 3 clinical trials (R-HDS0305 and DLCL04 trials; registered at http://www.clinicaltrials.gov as #NCT00355199 and #NCT00499018, respectively) for gene expression profiling. These cases represented the discovery set.
To confirm our gene expression molecular findings, we used an extended in silico data set (accession number GSE181063), including 31 THRLBCL cases and 473 DLBCL cases analyzed at the transcriptional level. To our knowledge, this is the largest THRLBCL case series publicly available.
Immunohistochemical validation analysis was performed on a subset of cases tested for gene expression profiling (5 THRLBCLs and 5 DLBCLs) and on an independent series of THRLBCLs (n = 15) and DLBCLs (n = 28), representing the immunohistochemical validation set. Cases were histologically reviewed by 3 expert hematopathologists (V.T., S.F., and S.A.P.) and diagnosed according to the 2017 revised World Health Organization classification.1 Both the discovery and the immunohistochemical validation cohorts were composed of newly diagnosed cases; the patients’ clinicopathologic features are reported in supplemental Table 1.
The current study was approved by the institutional review boards and ethics committees of the participating centers and conducted in accordance with the Declaration of Helsinki.
Patients treated with anti–PD-1 immunotherapy
FFPE sections relative to patients (n = 3) affected by r/r THRLBCL enrolled in ongoing clinical trials of pembrolizumab monotherapy for refractory hematologic malignancies (http://clinicaltrials.gov/ #NCT03316573 and #NCT01953692) were kindly provided by Griffin et al.12 Clinical characteristics and response to anti–PD-1 therapy are illustrated in supplemental Table 2.
These cases were analyzed by immunohistochemistry (IHC) to evaluate the expression of TCF1 (T cell–specific transcription factor 1, encoded by the TCF7 gene) in relation to the response to PD-1 blockade.
Gene expression profiling of the discovery set and the in silico extended set
Discovery set.
Total RNA was extracted by using the RNAstorm FFPE extraction kit (Cell Data Sciences, Fremont, CA). All the samples passed the quality control step with 260/280 and 260/230 ratios ≥1.8 and RNA concentration ≥60 ng/µL. Tumor samples were profiled with the PanCancer Immune Profiling panel, including 730 immune-related target genes, 40 housekeeping genes, and additional positive and negative genes. The quality control and normalization of NanoString nCounter data were performed by using R package NanoStringNorm. The raw NanoString counts for each gene were subjected to a technical normalization considering positive and negative probes. A normalization factor was calculated by obtaining the geometric mean of the positive controls used for each sample and applied to the raw counts of the nCounter output data to eliminate variability that was unrelated to the samples. The resulting data were normalized again with the geometric mean of the housekeeping genes. Normalized data were log2-transformed for further analyses. An exploratory unsupervised evaluation of the gene expression data was performed by using principal component analysis: 2 of 12 DLBCL samples were recognized as outliers and excluded from the analysis (data not shown). Genes differentially expressed between 12 THRLBCLs and 10 DLBCLs were identified by applying an empirical Bayes test using the limma R package. Genes with an adjusted P < .05 and a log2 fold change (log2FC) >1 were considered as upregulated/downregulated. The upregulated genes were used to conduct the following enrichment and network analyses.
In silico extended set.
The GSE181063 in silico extended set was composed of 31 THRLBCL cases and 473 DLBCL cases. To overcome this imbalanced distribution of THRLBCL and DLBCL samples, a subsampling approach was applied: DLBCL subsets were randomly selected to conduct as many as 10 000 independent comparisons with THRLBCL cases.
To assess the expression value of selected exhausted related genes (PD-1, PD-L1, LAG3, EOMES, and TCF7), all 10 000 comparisons were used.
To identify the genes differentially expressed in the THRLBCL vs DLBCL cases, 1 of 10 000 comparisons was randomly selected and used to perform differential analysis. Genes with an adjusted P < .05 and a log2FC > |1| were considered as upregulated/downregulated. The upregulated genes were used to conduct the following enrichment and network analyses.
Functional enrichment analysis.
Gene ontology (GO) analysis of genes upregulated in THRLBCL vs DLBCL was performed by using Enrichr, with default parameters,14 in the discovery set and the in silico extended set (accession number GSE181063).
Network analysis.
Protein–protein interaction enrichment analysis was performed by using the Metascape tool with default parameters calculated on the following databases: BioGrid6, InWeb_IM, and OmniPath.15 The resulting network included subsets of proteins with at least one physical interaction. To screen out densely connected modules, the Molecular Complex Detection (http://baderlab.org/Software/MCODE) version 1.31 algorithm was applied with degree cutoff ≥2, node score cutoff ≥0.2, K-core ≥2, and maximum depth ≥100.16 Finally, pathway and process enrichment analyses were applied to each MCODE component by the Metascape bioinformatics tool with the following ontology sources: Kyoto Encyclopedia of Genes and Genomes Pathway, GO Biological Processes, Reactome Gene Sets, Canonical Pathways, and CORUM. Terms were positively selected if reporting a P value < .01, a minimum count ≤3, and an enrichment factor >1.5, according to default parameters.
T-cell exhaustion analysis.
To evaluate the expression of T cell–exhausted related genes in THRLBCL, we compared the 235 genes upregulated in THRLBCL vs DLBCL of the discovery set: the in silico signature GSE9650_NAIVE_VS_EXHAUSTED_CD8_TCELL_DN developed by Wherry et al,17 inverting this gene signature to obtain the genes upregulated in CD8+T cells exhausted vs T cells naive; the genes upregulated in vitro cell line by EOMES, according to Li et al18 (supplemental Table 3); and the list of genes recognized as differentially expressed between progenitor exhausted vs terminally exhausted T cells, by Miller et al19 (supplemental Table 4).
Immunohistochemical assessment of immune response in tumor microenvironment
IHC was performed on 2-µm-thick FFPE whole tumor sections using a Dako AutoStainer Link48 (Dako Agilent, Glostrup, Denmark), after antigen retrieval (PTLink at 92°C for 5 minutes in EnVision FLEX Target Retrieval Solution High pH; Agilent, Santa Clara, CA). Primary antibody sources, clones, dilutions, and detection systems are listed in supplemental Table 5. Slides were counterstained with Gill’s hematoxylin, dehydrated or mounted in Kaiser glycerin, and cover-slipped. Immunohistochemical staining for T-cell markers (CD3, CD4, and CD8), inhibitory molecules (PD-1 and programmed cell death ligand 1 [PD-L1], and lymphocyte activation gene 3 [LAG3]), inflammatory-related factors (IDO and STAT1), and exhaustion-related transcription factors (EOMES and TCF7/TCF1) was independently evaluated by 2 hematopathologists (V.T. and S.F.) and scored as proportions of positive cells among all nucleated cells; discordant cases were reviewed together to reach consensus between the 2 pathologists.
TCF7/TCF1 immunohistochemical staining was also performed on whole tumor sections of 3 patients with r/r THRLBCL treated with pembrolizumab. Biopsy material was collected before anti–PD-1 treatment and was sufficient only for a single immunohistochemical staining.
Microphotographs were taken by using a BX53 light microscope with a DP71 camera (Olympus, Tokyo, Japan). Original magnifications are specified in the figure legends.
Statistical analyses
Statistical analyses were performed with the R statistical software package version 3.6.2 (R Foundation for Statistical Computing, Vienna, Austria). Differences in continuous variables between groups were calculated with the Mann-Whitney U test or two-tailed t test, and differences in categorical variables were assessed by using χ2 and Fisher’s exact tests.
Results
Chemokine and PD-1 signaling may be cooperatively involved in the modulation of THRLBCL immune response
To characterize at the molecular level the THRLBCL microenvironment, we analyzed the immune gene expression profile of 12 THRLBCLs compared with that of 10 DLBCLs using the PanCancer Immune profiling panel. Almost one-third of the immune genes investigated were differentially expressed between the 2 groups (279 of 730; 38.2% log2FC > 1, adjusted P < .05). Most genes (n = 235) were upregulated (235 of 279 [84.2%]), whereas only 44 were downregulated (44 of 279 [15.7%]) in THRLBCL, globally suggesting a stronger activation of the immune response in THRLBCL with respect to DLBCL. In line with literature findings, the 235 immune genes overexpressed in THRLBCL were significantly involved in the inflammatory response and cytokine signaling, as revealed by GO analysis conducted with the Enrichr bioinformatics tool, with default parameters14 (supplemental Figure 1A; supplemental Table 6).
This molecular result was evaluated in an in silico extended set (accession number GSE181063). We first conducted a differential expression analysis and found that 95 immune genes reported in the PanCancer Immune profiling panel were upregulated in THRLBCL vs DLBCL in silico cases (as discussed in "Materials and methods"). These upregulated genes, interrogated in terms of GO, were confirmed to be significantly enriched in the cytokine signaling and inflammatory process (supplemental Figure 1B). This finding was further corroborated by the positive immunostaining of IDO and STAT1 proteins, present with a higher percentage in THRLBCL vs DLBCL cases with a P value ≤.01 (supplemental Figure 1B-C; supplemental Table 7).
To identify the pathways that may cooperatively modulate the THRLBCL immune gene expression profile, we performed in the discovery set gene coexpression network (GCN) analysis of the 235 immune genes overexpressed in THRLBCL vs DLBCL using the Metascape tool.15 The GCN analysis organized genes into “modules,” each containing groups of functionally related genes converging on the same biological pathways. In THRLBCL, a total of 6 gene modules were detected (supplemental Table 8). Of note, the top 3 highest score modules were responsible for the chemokines, IFNs, and PD-1 signaling activation, respectively (Figure 1A).
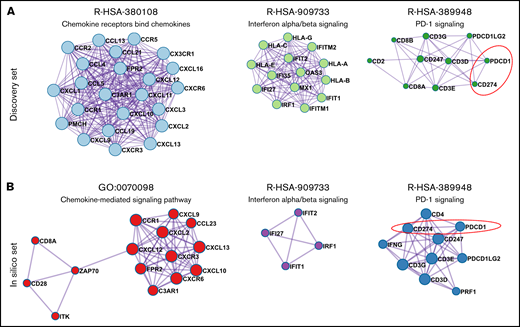
Coexpression network of THRLBCL immune genes. (A) The 3 highest score gene modules identified in the discovery set were interrogated in terms of functional pathway analysis by using the Metascape tool.15 Each gene is colored in light blue, light green, and dark green according to the gene module to which they belong. (B) Three high score gene modules were identified in the in silico set by using Metascape. Each gene is colored in red, purple, and blue according to the different membership module. In panels A and B, the genes are represented by circles, proportional in size to the number of genes of each module. The thickness of edges indicates the similarity score. The red dashed line highlights the axis PD-1/CD274 (PD-L1).
Coexpression network of THRLBCL immune genes. (A) The 3 highest score gene modules identified in the discovery set were interrogated in terms of functional pathway analysis by using the Metascape tool.15 Each gene is colored in light blue, light green, and dark green according to the gene module to which they belong. (B) Three high score gene modules were identified in the in silico set by using Metascape. Each gene is colored in red, purple, and blue according to the different membership module. In panels A and B, the genes are represented by circles, proportional in size to the number of genes of each module. The thickness of edges indicates the similarity score. The red dashed line highlights the axis PD-1/CD274 (PD-L1).
The GCN analysis was also conducted in the in silico extended set. We found that the modules responsible for the chemokines, IFNs, and PD-1 signaling activation were significantly coexpressed in THRLBCL cases, confirming the discovery set results (Figure 1B; supplemental Table 9).
Overall, the IFN-driven inflammatory response and the PD-1 signaling were recognized as the most relevant modulators of the THRLBCL immune response, possibly cooperating with each other.
A set of 48 T cell–exhausted related genes is upregulated in THRLBCL vs DLBCL
The GCN analysis also highlighted the upregulation of the PD-1/PD-L1(PDCD1-CD274) axis (Figure 1), a well-known marker of exhausted T cells and also the most reliable target for immunotherapy.
Given that the severity of exhausted T cells may be due to the expression of multiple immune checkpoint (IC) genes,20 we looked for all the IC genes included in the 235 genes upregulated in THRLBCL vs DLBCL of the discovery set. According to NanoString immune gene cell annotation and literature references,21 apart from PD-1/PD-L1, an additional 28 IC genes were found abnormally overexpressed in THRLBCLs vs DLBCLs, including CTLA-4, LAG3, and HAVCR3/TIM3 (Figure 2A). Next, to discover additional genes possibly involved in the THRLBCL T-cell exhaustion, we also compared the 235 immune genes upregulated in THRLBCL vs DLBCL vs a published signature of genes upregulated in virus-induced exhausted T cells vs naive T cells (accession number GSE9650).17 Fifteen virus-induced exhausted related genes were recognized as upregulated in the THRLBCL vs DLBCL immune gene expression profile. Among them, EOMES, a transcription factor crucial for the development of exhausted T cells, was reported (supplemental Table 3).18 Thus, to identify other genes related to EOMES, we used a list of genes upregulated in vitro by EOMES and found that 11 EOMES-upregulated genes were also overexpressed in our THRLBCL vs DLBCL cases of the discovery set.
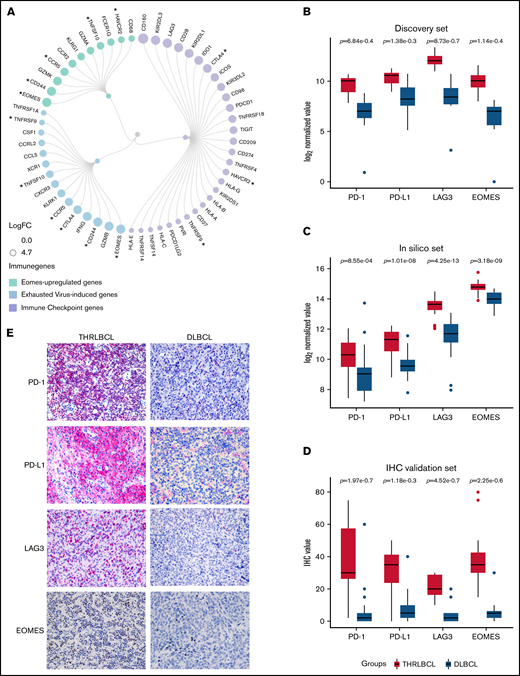
Exhausted related genes upregulated in THRLBCL vs DLBCL. (A) Circular dendrogram of the exhausted related genes upregulated in THRLBCL vs DLBCL cases of the discovery set (created with RAWGraphs). The IC genes are colored in light purple; the virus-induced exhausted related genes, according to the in silico data (accession number GSE9650),17 in light blue; and the EOMES upregulated genes in light green. The gene circle size is proportional to the FC gene expression value. The asterisks indicate the genes shared by 2 categories. (B) Box plot histograms represent the expression value of PD-1, PD-L1, LAG3, and EOMES genes in terms of gene counts (normalized and log2-transformed) in the THRLBCL vs DLBCL samples analyzed in the discovery set by using NanoString immune gene panel. (C) Box plot histograms represent the expression value of PD-1, PD-L1, LAG3, and EOMES genes in terms of gene counts (normalized and log2-transformed) in the THRLBCL vs DLBCL samples of the in silico set. (D) Box plot histograms represent the percentage of cells positive for the immunostaining of PD-1, PD-L1, LAG3, and EOMES proteins in the IHC validation set samples. (E) PD-1, PD-L1, LAG3, and EOMES immunostaining showed higher expression in THRLBCL vs DLBCL cases (Olympus BX53 light microscope, Olympus DP71 camera; original magnification, 40×). Statistical significance was calculated by using the Mann-Whitney U test.
Exhausted related genes upregulated in THRLBCL vs DLBCL. (A) Circular dendrogram of the exhausted related genes upregulated in THRLBCL vs DLBCL cases of the discovery set (created with RAWGraphs). The IC genes are colored in light purple; the virus-induced exhausted related genes, according to the in silico data (accession number GSE9650),17 in light blue; and the EOMES upregulated genes in light green. The gene circle size is proportional to the FC gene expression value. The asterisks indicate the genes shared by 2 categories. (B) Box plot histograms represent the expression value of PD-1, PD-L1, LAG3, and EOMES genes in terms of gene counts (normalized and log2-transformed) in the THRLBCL vs DLBCL samples analyzed in the discovery set by using NanoString immune gene panel. (C) Box plot histograms represent the expression value of PD-1, PD-L1, LAG3, and EOMES genes in terms of gene counts (normalized and log2-transformed) in the THRLBCL vs DLBCL samples of the in silico set. (D) Box plot histograms represent the percentage of cells positive for the immunostaining of PD-1, PD-L1, LAG3, and EOMES proteins in the IHC validation set samples. (E) PD-1, PD-L1, LAG3, and EOMES immunostaining showed higher expression in THRLBCL vs DLBCL cases (Olympus BX53 light microscope, Olympus DP71 camera; original magnification, 40×). Statistical significance was calculated by using the Mann-Whitney U test.
Globally, 29 IC genes, 15 virus-induced exhausted T cell–related genes, and also 11 EOMES-dependent genes (ie, a total of 48 exhausted related genes) were identified as significantly upregulated in THRLBCL vs DLBCL (some genes were shared by 2 categories) (Figure 2A; supplemental Table 10).
To test the robustness of our findings, the expression of PD-1, PD-L1, LAG3, and EOMES exhausted related genes was evaluated in the in silico set. To overcome the imbalanced distribution of THRLBCL and DLBCL samples in silico (31 vs 473, respectively), a subsampling approach was applied: DLBCL subsets were randomly selected, and as many as 10 000 independent comparisons of DLBCL vs THRLBCL cases were conducted, giving a higher robustness of the molecular results. Specifically, in each 1 of 10 000 comparisons, the expression level of the aforementioned immune genes was evaluated. We found that the EOMES, LAG3, and PD-L1 genes were significantly overexpressed in THRLBCL cases vs DLBCL cases in all 10 000 comparisons (100%; P ≤ .05). The PD-1 gene was higher expressed in THRLBCL vs DLBCL cases in all comparisons, with statistical significance in 90.53% of comparisons (P ≤ .05). In silico results were in agreement with the discovery set results, as illustrated in Figure 2B and C.
Finally, we validated the expression of PD-1, PD-L1, LAG3, and EOMES at the protein level in the immunohistochemical validation set: THRLBCL cases compared with DLBCL cases showed a higher percentage of cells positive for the selected immune genes, in line with the gene expression profiling results (Figure 2D-E; supplemental Table 7).
Expression of TCF7/TCF1 may help to identify THRLBCL patients who respond to anti–PD-1 therapy
THRLBCL was shown to have a microenvironment rich in exhausted T cells, positive for PD-1. To explore the molecular sensitivity of THRLBCL to anti–PD-1 therapy, we interrogated our immune gene profiling data by the tumor inflammation signature (TIS) genes developed by Ayers et al.22,23 This TIS was based on the expression of 18 genes (TIGIT, CD27, CD8A, PD-L2, LAG3, PD-L1, CXCR6, CMKLR1, NKG7, CCL5, PSMB10, IDO1, CXCL9, HLA.DQA1, CD276, STAT1, HLA.DRB1, and HLA) predictive of anti–PD-1 immunotherapy benefit. Seventeen of the 18 TIS genes were interrogated by using the NanoString PanCancer Immune profiling panel; 13 genes were upregulated in THRLBCL vs DLBCL, arguing for the presence of a T cell–inflamed phenotype, possibly predictive of a favorable response to anti–PD-1 therapy in our THRLBCL case series with respect to DLBCL (Figure 3A).
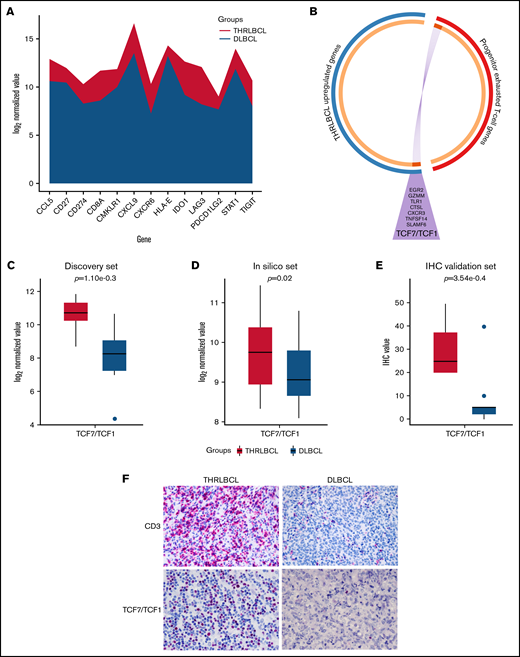
Progenitor exhausted T-cell genes upregulated in THRLBCL. (A) The stacked area chart displays the gene expression value of 13 TIS genes in the THRLBCL (purple) and DLBCL (light blue) cases of the discovery set. (B) Circos plot shows the overlap between the 2 gene lists: the list of genes upregulated in THRLBL vs DLBCL (in blue) and the list of genes upregulated in progenitor exhausted T cells vs terminally exhausted T cells (in red). The 2 gene lists are on the outside (red/blue); the orange circle on the inside represents genes that were unique to each gene list, and the dark orange represents genes shared by the 2 gene lists. Purple lines link the same genes shared by the 2 lists. The names of the shared genes are reported in the purple triangle. Box plot histograms represent the expression value of TCF7/TCF1 gene in terms of log2 normalized gene counts in THRLBCL vs DLBCL samples analyzed by using the NanoString immune gene panel in the discovery set (C) and in the in silico set (D). (E) Box plot histograms represented the percentage of cells positive for TCF1 protein by IHC. (F) CD3 and TCF1 immunostaining showed higher expression in THRLBCL vs DLBCL cases (Olympus BX53 light microscope, Olympus DP71 camera; original magnification, 60×). Statistical significance was calculated by using the Mann-Whitney U test.
Progenitor exhausted T-cell genes upregulated in THRLBCL. (A) The stacked area chart displays the gene expression value of 13 TIS genes in the THRLBCL (purple) and DLBCL (light blue) cases of the discovery set. (B) Circos plot shows the overlap between the 2 gene lists: the list of genes upregulated in THRLBL vs DLBCL (in blue) and the list of genes upregulated in progenitor exhausted T cells vs terminally exhausted T cells (in red). The 2 gene lists are on the outside (red/blue); the orange circle on the inside represents genes that were unique to each gene list, and the dark orange represents genes shared by the 2 gene lists. Purple lines link the same genes shared by the 2 lists. The names of the shared genes are reported in the purple triangle. Box plot histograms represent the expression value of TCF7/TCF1 gene in terms of log2 normalized gene counts in THRLBCL vs DLBCL samples analyzed by using the NanoString immune gene panel in the discovery set (C) and in the in silico set (D). (E) Box plot histograms represented the percentage of cells positive for TCF1 protein by IHC. (F) CD3 and TCF1 immunostaining showed higher expression in THRLBCL vs DLBCL cases (Olympus BX53 light microscope, Olympus DP71 camera; original magnification, 60×). Statistical significance was calculated by using the Mann-Whitney U test.
The expression of the PD-1/PD-L1 axis, along with the definition of the exhausted state of the T-cell microenvironment and the upregulation of TIS genes, certainly suggest a new attractive therapeutic strategy, based on the use of anti–PD-1 therapy for patients with THRLBCL.6,12 However, the therapeutic benefit of IC inhibitors could critically depend on the type of exhausted T cells infiltrated in the tumor microenvironment.19 Exhausted T cells can include a small population of progenitor exhausted T cells and a larger population of terminally exhausted T cells. The progenitor exhausted T cells are a sort of “stem-like” T cell, able to control the tumor progression, respond to the anti–PD-1 immunotherapy, and differentiate in terminally exhausted T cells. The latter ones, instead, are present in higher number and are more cytotoxic than progenitor T cells but, unfortunately, are short-living and resistant to anti–PD-1 therapy.19
To assess the presence of progenitor exhausted T cells in the THRLBCL microenvironment, we interrogated our 235 genes upregulated in THRLBCL cases vs DLBCL cases of the discovery set with a signature of progenitor exhausted T cell genes identified by Miller et al19 (supplemental Table 4). The assessment was made by using the Metascape bioinformatics tool.15 Eight genes specific to the progenitor exhausted state condition were found upregulated in THRLBCL vs DLBCL: SLAMF6, TCF7 (encoding for TCF1), CXCR3, TNFSF14, GZMM, EGR2, TLR1, and CTSL (Figure 3B). The TCF7 and SLAMF6 genes were known to be highly expressed by progenitor exhausted T cells and already tested to select and quantify progenitor exhausted T cells from patients with melanoma.19,24
Thus, to validate the presence of progenitor exhausted T cells in THRLBCL, the expression level of the TCF7 transcript was evaluated in the in silico extended set and compared with the discovery set (Figure 3C-D). The TCF7 gene was overexpressed in all 10 000 comparisons of the THRLBCL vs DLBCL in silico cases, with statistical significance in 39.6% of comparisons (Figure 3D).
We then assessed by IHC the expression of CD3 and TCF1 in the validation set samples: all THRLBCL cases analyzed by IHC were positive for bona fide T-cell TCF1+ (Figure 3E-F).
The expression of TCF7/TCF1 was higher in THRLBCL vs DLBCL at both gene expression and protein levels (Figure 3C-F; supplemental Table 7). However, among the THRLBCL cases in the IHC validation set, we observed a variable percentage of TCF1+ cells (range, 20-50; median, 25) (supplemental Table 7), possibly predictive of a differential response to anti–PD-1 treatment.
Next, we tested the expression of TCF1 antibody on the pretreatment biopsy specimens of 3 patients with r/r THRLBCL enrolled in clinical trials of pembrolizumab monotherapy. After anti–PD-1 treatment, the first (“Patient 1”) and the second (“Patient 3”) patient achieved a complete response (CR) and partial response (PR), respectively; the third patient (“Patient 5”) developed early progressive disease (supplemental Table 2).12
The patients responsive to anti–PD-1 therapy (CR and PR) showed a higher percentage of TCF1+ T cells than the early nonresponder patient (progressive disease), as illustrated in Figure 4 and supplemental Table 2.
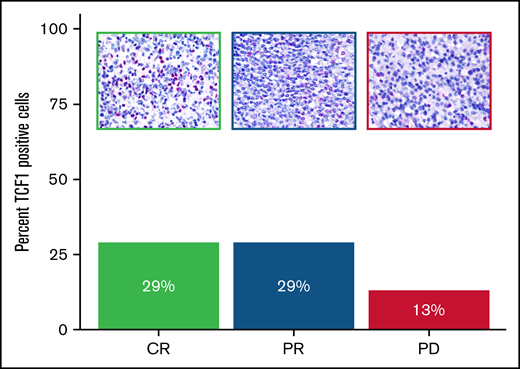
Expression of TCF1 marker in THRLBCL patients treated with pembrolizumab. Bar chart histograms comparing the percentage of cells positive for TCF1 protein by IHC in r/r THRLBCL treated with pembrolizumab. Patients with clinical benefit after pembrolizumab are indicated in green (CR) and blue (PR); the early nonresponder is depicted in purple. Upper panels: representative areas demonstrating the different content of TCF1 immunohistochemical staining (red) in the 3 samples (Olympus BX53 light microscope, Olympus DP71 camera, original magnification 60×).
Expression of TCF1 marker in THRLBCL patients treated with pembrolizumab. Bar chart histograms comparing the percentage of cells positive for TCF1 protein by IHC in r/r THRLBCL treated with pembrolizumab. Patients with clinical benefit after pembrolizumab are indicated in green (CR) and blue (PR); the early nonresponder is depicted in purple. Upper panels: representative areas demonstrating the different content of TCF1 immunohistochemical staining (red) in the 3 samples (Olympus BX53 light microscope, Olympus DP71 camera, original magnification 60×).
Discussion
THRLBCL is an aggressive variant of DLBCL, usually treated with the same standard therapeutic regimen used for DLBCL. However, it is even more evident that THRLBCL can be distinguished from DLBCL by other clinical and histopathologic features; THRLBCL hosts a large tumor microenvironment with high immune infiltrate, globally more extended than DLBCL. Therefore, elucidating the differential immune response specifically engaged by THRLBCL may help to increase our knowledge of THRLBCL biology and identify more effective and targeted therapies.
In this work, we found that the THRLBCL immune gene profile, compared with the DLBCL one, showed a higher level of molecules related to IFN-driven inflammation and T-cell exhaustion. Of clinical interest, THRLBCL cases had a gene expression profile rich in tumor inflammation signature genes, more sensitive to anti–PD-1 therapy than DLBCL. This finding was further reinforced histologically by the presence of TCF1+ progenitor exhausted T cells infiltrating the THRLBCL microenvironment. This subtype of exhausted T cells was associated with a good clinical response to anti–PD-1 treatment in nonhematologic malignancies,24 and its monitoring could help to select THRLBCL patients potentially responsive to an immunotherapeutic approach.
The inflammatory state of the THRLBCL microenvironment has already been described,7-11 and the expression of PD-1/PD-L1 genes in THRLBCL has been recently documented by Griffin et al.12
In the present study, we showed by GCN analysis that activation of the inflammatory pathway and the PD-1 signaling are the master regulators of the THRLBCL immune response and that they are closely interconnected with each other (Figure 1A-B), as found in the discovery set and in the in silico extended set. In many cancers, persistent activation of the inflammatory response may induce activation of PD-1 signaling, gradually leading to T-cell dysfunction.25,26 Also, the inflammatory state of the microenvironment in THRLBCL is associated with a severe T-cell exhaustion. To this regard, a high number of T-cell exhausted related genes were identified as upregulated in THRLBCL vs DLBCL (Figure 2A; supplemental Table 10), thus providing an extended database of exhausted related genes, never described before in this context. Specifically, 48 exhausted related genes were identified as overexpressed in THRLBCL vs DLBCL, including 29 IC genes, potentially useful for new therapeutic approaches based on the single or combined blockade of inhibitory receptors. First, among them, we must mention the PD-1/PD-L1 axis, followed by other promising therapeutic targets (ie, CTLA-4, T-cell immunoglobulin and ITIM domains [s], LAG3) and critical mediators of T-cell exhaustion, such as EOMES, whose upregulation was also confirmed in an extended in silico set (Figure 2B-C). The staining for PD-1, PD-L1, LAG3, and EOMES proteins was significantly higher in THRLBCL vs DLBCL (Figure 2D-E) and easily applicable to future clinical perspectives.
Overall, the high number of IC genes upregulated,20 the severe state of T-cell exhaustion, and, more specifically, the positivity of THRLBCL cases for the PD-1 protein clearly suggest the potential of an immunotherapy-based approach. To this point, Ayers et al22 developed an 18-gene expression signature called TIS able to measure the level of tumor microenvironment inflammation and to predict response to anti–PD-1 treatment. Our THRLBCL cases upregulated, with respect to DLBCL, 13 of 18 TIS genes, further endorsing the suitability of anti–PD-1 therapy in THRLBCL.
However, recent studies showed that the benefit to anti–PD-1 therapy may rely on the presence of TCF1+ progenitor exhausted T cells, a specific type of exhausted T cells able to be reinvigorated by anti–PD-1 therapy and to counteract tumor progression.19,24,25 In patients with melanoma, expression of TCF1 protein by CD8+ T cells has been shown to be associated with a good clinical response to checkpoint therapy.24
In this study, 7 progenitor exhausted T cell–related genes were overexpressed in THRLBCL vs DLBCL, including TCF7/TCF1. At the immunohistochemical level, the percentage of TCF1+ T cells was significantly higher in THRLBCL than in DLBCL (P ≤ .01); however, among the THRLBCL cases, we observed a variable amount of TCF1+ T cells in the IHC validation set (range, 20%-50%; median, 25%) (Figure 3E; supplemental Table 7). The presence and, perhaps more importantly, the extent of this subset of TCF1+ T cells in the THRLBCL microenvironment may help to explain any eventual success of IC therapy and also provide a useful marker to stratify THRLBCL patients in terms of sensitivity to anti–PD-1 therapy.
Griffin et al12 recently found that malignant THRLBCL cells were surrounded by a high number of PD-L1–expressing macrophages and PD-1–positive T cells; on this premise, the authors evaluated the therapeutic response of 5 patients with THRLBCL in 2 ongoing trials of anti–PD-1 monotherapy (#NCT03704714 and #NCT03038672): 3 patients displayed a complete or partial remission, while 2 patients remained refractory. Why did 3 patients respond, and 2 did not? The mechanism of response to anti–PD-1 therapy by THRLBCL patients remains unknown, and the strategy to discern patients eligible for checkpoint therapy despite the PD-1 positivity represents an unmet need.27
In this study, we had the opportunity to investigate the immunohistochemical expression of TCF1 in the tumor biopsy specimens of 3 of the cases enrolled in the series by Griffin et al12 : two corresponded to responders (1 CR and 1 PR, respectively) and one to a nonresponder (progressive disease). The inflammatory milieu of the 2 responders hosted an amount of TCF1+ T cells (29% in both) higher than that in the milieu of the nonresponder (13%) (Figure 4).
Despite the limitations of our study, mainly related to the rareness of the disease and the availability of only a few THRLBCL patients treated with PD-1 blockade, our findings seem to be promising and merit further investigation. In particular, it might be worthy to monitor TCF1 positivity in THRLBCL before and after treatment with IC inhibitors to assess its potential predictive value.
The improvement of THRLBCL therapy remains a clinical challenge that needs to be addressed. THRLBCL patients treated with RCHOP therapy reported a better outcome compared with available data from the pre-rituximab era, similar to findings with DLBCL.28,29 However, the prognosis for patients with DLBCL and THRLBCL remains poor, especially for those with refractory disease.30 CD19-directed CAR T-cell therapy is producing encouraging results in refractory B-cell lymphoma, with a response rate around 80%.31,32 In THRLBCL, however, CD19 CAR T-cell therapy was ineffective.6 Recent work speculated that in PD-L1+ lymphomas, the activation of the PD-1/PD-L1 axis may hinder the efficacy of CD19 CAR T cells by inducing their dysfunction.6,33 Indeed, the combination of IC inhibitors with CAR T cells or, alternatively, the use of CD19-CAR T cells expressing PD-1/CD28 switch receptor, have shown high antitumor function in PD-L1+ lymphoma cells.33-35
To this point, Chong et al36 observed clinical responses to PD-1 blockade in a subset of patients with B-cell lymphomas refractory to CAR T-cell therapy. It is worth noting that responding patients displayed, among other markers, higher expression of TCF1, possibly corroborating our findings and further promoting the predictive role of transcription factor TCF1. In this context, the monitoring of TCF1+ progenitor exhausted T cells might also help to improve the selection of patients responsive to CAR T-cell therapy combined with inhibition of PD-1 signaling.
In summary, this work has provided an extended data set of IC genes expressed in THRLBCL by suggesting potential new predictive markers and/or therapeutic targets.
Acknowledgments
The authors thank Pier Luigi Antoniotti, Sebastiano Spagnolo, Marco Giuffrida, and Virginia Maltoni for their technical assistance.
This work was supported by the AIRC 5x1000 grant (no. 21198) (S.A.P.).
Authorship
Contribution: V.T. conceived the original idea, interpreted the data, and wrote the manuscript; F.M. and G.M. planned and performed the molecular experiments, interpreted the data, and wrote the manuscript; S.M., M.F., and M.D.C. performed the statistical and bioinformatics analysis; V.T., S.F., and S.A.P. conducted the histologic analyses and interpreted the data; C.A., D.L., A. Chiappella, U.V., E.D., A.V., E.S., C.T., G.K.G., and S.J.R. provided patient samples and clinical data; A. Calleri performed the immunophenotyping; A. Cesano contributed to the study design; C.T. critically revised the manuscript; M.R.S. designed the study, conducted the bioinformatics analysis, and wrote the manuscript; S.A.P. supervised the research; and all authors read and contributed to the final version of the manuscript.
Conflict-of-interest disclosure: S.A.P. served on a scientific advisory board for Celgene, NanoString, Roche, and BeiGene. E.D. received research funding from TG Therapeutics, ADC Therapeutics, and Takeda (outside the submitted work); served on a scientific advisory board for Roche, Beigene, AbbVie, Gilead, and Takeda; and served as a consultant for Astra Zeneca. C.T. served on a scientific advisory board for ADC Therapeutics and Incyte. A. Chiappella served on a scientific advisory board for Roche, Takeda, SecuraBIO, Clinigen, and Gilead Sciences; and received lecture fees from AstraZeneca, Celgene-BMS, Gilead Sciences, Novartis, Roche, Takeda, Janssen, and Clinigen (outside the submitted work). U.V. served as a consultant/advisor for Celgene, Janssen, Genmab, Incyte, and Bristol Myers Squibb; served on the speakers bureau for Roche, Celgene, Janssen, Gilead Sciences, Sandoz, and AbbVie; and received research funding from Roche and Celgene (outside the submitted work). A. Cesano is employed by ESSA Pharma. The remaining authors declare no competing financial interests.
Correspondence: Valentina Tabanelli, Division of Haematopathology, IEO European Institute of Oncology IRCCS, Via Ripamonti, 435-20141 Milan, Italy; e-mail: valentina.tabanelli@ieo.it.

