

Key Points
Mast cell differentiation is unlinked from FcεRI upregulation.
IL-3, IL-5, and IL-33 promote disparate effects on mast cell progenitor proliferation, survival, and FcεRI regulation.

Abstract
Mast cell accumulation is a hallmark of a number of diseases, including allergic asthma and systemic mastocytosis. Immunoglobulin E–mediated crosslinking of the FcεRI receptors causes mast cell activation and contributes to disease pathogenesis. The mast cell lineage is one of the least studied among the hematopoietic cell lineages, and controversies remain about whether FcεRI expression appears during the mast cell progenitor stage or during terminal mast cell maturation. Here, we used single-cell transcriptomics analysis to reveal a temporal association between the appearance of FcεRI and the mast cell gene signature in CD34+ hematopoietic progenitors in adult peripheral blood. In agreement with these data, the FcεRI+ hematopoietic progenitors formed morphologically, phenotypically, and functionally mature mast cells in long-term culture assays. Single-cell transcriptomics analysis further revealed the expression patterns of prospective cytokine receptors regulating development of mast cell progenitors. Culture assays showed that interleukin-3 (IL-3) and IL-5 promoted disparate effects on progenitor cell proliferation and survival, respectively, whereas IL-33 caused robust FcεRI downregulation. Taken together, we showed that FcεRI expression appears at the progenitor stage of mast cell differentiation in peripheral blood. We also showed that external stimuli regulate FcεRI expression of mast cell progenitors, providing a possible explanation for the variable FcεRI expression levels during mast cell development.
Introduction
Mast cells contribute to the pathogenesis of various diseases, including allergies, asthma, and mastocytosis.1 One of the mast cells’ main responses follows immunoglobulin E (IgE)–allergen immune complex crosslinking of the high-affinity IgE receptors, FcεRIs, on the cell surface. This event leads to mast cell activation and degranulation, ultimately causing an allergic response. The signaling that follows FcεRI crosslinking has been studied in detail. However, the regulation of FcεRI expression during human mast cell development is unclear and has remained a disputed subject.
The consensus is that mast cell progenitors exhibit low, if any, FcεRI expression.2 This view favors a mechanism in which FcεRI expression is upregulated during terminal mast cell maturation.3 Evidence includes in vitro–based cell culture experiments, which show that FcεRI expression appears after the decrease of the progenitor marker CD34.4,5 Existence of FcεRI− and FcεRI+ primary mast cells in asthmatic lungs also supports the view that FcεRI is a late event in mast cell maturation.6 By contrast, some studies present an opposing view and suggest that FcεRI expression may appear already at the progenitor stage. For example, short-term culture of FcεRI+ hematopoietic progenitors in multi-cytokine conditions produces cells with mast cell–like characteristics.7 However, available studies have not cultured FcεRI+ hematopoietic progenitors in mast cell–promoting conditions for an extended period of time,7,8 which is typical for studying in vitro–derived mast cells.9 Thus, the controversy of whether FcεRI is an early or late event during mast cell differentiation remains unresolved.
The current investigation aimed to chart human hematopoiesis with a focus on mast cell progenitor differentiation. Specifically, the study aimed to decipher the appearance of FcεRI during mast cell development and to identify factors that regulate mast cell progenitors. We performed single-cell transcriptomics analysis of adult peripheral blood progenitors and revealed a differentiation trajectory in which the appearance of a mast cell gene signature was associated with upregulation of FcεRI at the gene and protein level. In agreement with this, sorted and long-term cultured FcεRI+ peripheral blood progenitors formed cells that phenotypically, morphologically, and functionally exhibited features of mast cells. We next examined the gene expression patterns of cytokine receptors and the effects of various cytokines on FcεRI+ primary mast cell progenitors, showing the disparate effects of interleukin-3 (IL-3) and IL-5 on proliferation and survival. Notably, we revealed that IL-33 was able to modulate FcεRI expression on mast cell progenitors. Taken together, FcεRI can be present at the mast cell progenitor stage, but microenvironmental conditions are able to fine-tune FcεRI expression in these cells.
Methods
Ethics statement
The Swedish Ethical Review Authority and the Regional Review Board in Stockholm approved the study, and the subjects provided informed consent to participate in the study.
Cell isolation, culture, and analysis
Cells from healthy donors were extracted from donated buffy coat fractions of peripheral blood, whereas cells from patients with systemic mastocytosis were extracted from peripheral blood. Results given here are derived from analysis of healthy donors unless otherwise stated. Ficoll separation isolated blood mononuclear cells from the buffy coats. c-Kit+ cells were extracted with the CD117 Microbead Kit (Miltenyi Biotec, Bergisch Gladbach, Germany). Cells were cultured in complete StemPro-34 serum-free medium (Gibco/Thermo Fisher Scientific, Waltham, MA) with 2 mM l-glutamine (Cytiva HyClone, Global Life Sciences Solutions USA, Marlborough, MA), 100 U/mL penicillin, and 0.1 mg/mL streptomycin (Cytiva HyClone). The recombinant cytokines IL-3, IL-6, thrombopoietin, IL-33, granulocyte-macrophage colony-stimulating factor (GM-CSF), FMS-like tyrosine kinase 3 ligand (Flt3L) (all from PeproTech, Rocky Hill, NJ), IL-5 (PeproTech and R&D Systems, Minneapolis, MN), erythropoietin (EPO) (Janssen-Cilag AB, Solna, Sweden), and stem cell factor (Swedish Orphan Biovitrum, Stockholm, Sweden) supplemented the medium. Cytokine concentrations are specified in the figures and figure legends.
In selected experiments, cells were starved of stem cell factor overnight before flow cytometry analysis to prevent c-Kit internalization and promote c-Kit upregulation.10 Cytocentrifugation was performed by using Shandon Octospot (Thermo Fisher Scientific) where the cell numbers were limited. Tryptase staining was performed as described by using Z-Gly-Pro-Arg-4-Methoxy-β-naphthylamide substrate.11 Cytocentrifuged cells were stained with May-Grünwald and Giemsa solutions (Sigma-Aldrich/Merck, Munich, Germany). To investigate mast cell activation, cultured cells were incubated with human IgE overnight. The cells were analyzed by flow cytometry following treatment with mouse anti-human IgE (GE-1) (Sigma-Aldrich).
Flow cytometry
Antibodies used for flow cytometry analysis included CD3 (SK7), CD14 (M5E2), CD19 (HIB19), CD15 (W6D3), CD34 (581), CD63 (H5C6), CD117 (A3C6E2 and 104D2), FcεRI (CRA-1), and β2-microglobulin (2M2). TotalSeq-B0953 PE Streptavidin was used to visualize β2-microglobulin/biotin labeling during fluorescence-activated cell sorting (FACS) and single-cell transcriptomics analysis. The viability dyes 4',6-diamidino-2-phenylindole and 7-aminoactinomycin D were used where appropriate (BD [Franklin Lakes, NJ] and Thermo Fisher Scientific). CellTrace Far Red (Thermo Fisher Scientific) served as a marker of proliferation. The Canto II or LSRFortessa flow cytometer was used to analyze cells (BD Biosciences, San Jose, CA). FACS on the FACS Aria Fusion system (BD Biosciences) isolated specific cell subsets. FlowJo v10 software (BD Life Sciences, Ashland, OR) was used to analyze the data.
Single-cell transcriptomics analysis
Lin− c-Kit+ cells were isolated with FACS and processed by using the Chromium Single Cell 3′ Reagents Kit v2 (10X Genomics, Pleasanton, CA). The library was sequenced on the NovaSeq 6000 SP flow cell with the 26-8-0-96 read setup. An antibody hashtag-based approach distinguished the single-cell transcriptomes of Lin− CD34+ c-Kit+ and Lin− CD34+ c-Kit+ FcεRI+ hematopoietic progenitors. Briefly, a sample with c-Kit+ cells enriched by magnetic-activated cell sorting was divided into 2 fractions. One fraction was stained with biotinylated β2-microglobulin antibody, which universally targets all cells, and the other fraction with unlabeled β2-microglobulin antibody. Each cell fraction was then incubated with flow cytometry antibodies plus oligonucleotide-labeled streptavidin-phycoerythrin (PE). Lin− CD34+ c-Kit+ cells without the hashtag (PE−) and Lin− CD34+ c-Kit+ FcεRI+ cells with the hashtag (PE+) underwent FACS. The sorted cells were pooled and processed by using the Chromium Next GEM Single Cell 3′ Reagent Kit v3.1 (dual index) with Feature Barcode technology for Cell Surface Protein (10X Genomics). The gene expression and antibody libraries were sequenced on the NovaSeq 6000 SP flow cell with the 28-10-10-90 read setup. The Cell Ranger pipeline and SCANPY12 were used to process the sequencing data. The first gene expression library was generated from one buffy coat. An independent buffy coat and single-cell RNA-sequencing run were used to generate the second library. Details regarding the bioinformatics analysis are provided in the supplemental Methods.
Statistical analysis
Statistical analysis was performed by using Prism software v9 (GraphPad software, La Jolla, CA). P < .05 was considered significant. The statistical tests used are specified in the figure legends.
Results
Single-cell transcriptomics reveals blood cells expressing mast cell genes and FcεRI subunit genes
The developmental stage at which mast cells upregulate FcεRI expression has yet to be determined. To investigate whether FcεRI may appear at the hematopoietic progenitor stage, we performed single-cell RNA-sequencing analysis of cells isolated from healthy peripheral blood, in which mature mast cells are absent. Sorting Lin− c-Kit+ cells allowed us to profile a spectrum of differentiating hematopoietic progenitor cells using droplet-based single-cell RNA- sequencing. We visualized the 6874 single-cell transcriptomes in 2 dimensions using the Uniform Manifold Approximation and Projection (UMAP) technique (Figure 1A). Plotting established marker genes for various lineages enabled annotation of the main branches and populations of the hematopoietic landscape (Figure 1A; supplemental Figure 1).13-16 We also noted a distinct cluster of cells with a mast cell gene signature (TPSAB1, TPSB2, and HDC), hereon referred to as cluster A (Figure 1A-B). Notably, cells in cluster A expressed the genes FCER1A, MS4A2, and FCER1G that code for the 3 subunits of FcεRI.
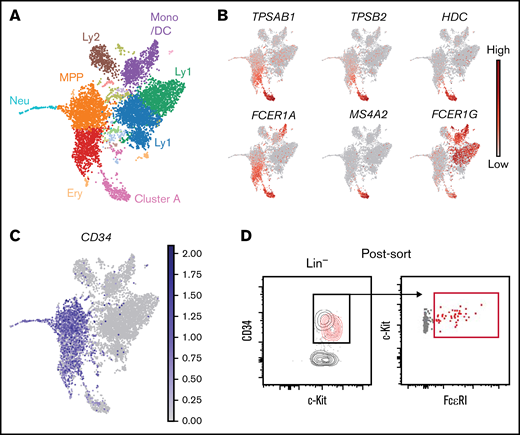
Expression of FcεRI subunit genes in hematopoietic progenitors is associated with a mast cell gene signature. (A) UMAP visualization of the single-cell transcriptomes of 6874 Lin− c-Kit+ peripheral blood cells. The colors indicate Leiden clusters. Expression patterns of lineage genes used to annotate the landscape are provided in supplemental Figure 1. (B) Gene expression levels of mast cell genes and FcεRI subunit genes. (C) Gene expression of CD34. (D) Post-sort flow cytometry analysis of Lin− c-Kit+ cells. The red contour plot shows back-gated FcεRI+ cells. One buffy coat was used to produce the data presented in this figure.
Expression of FcεRI subunit genes in hematopoietic progenitors is associated with a mast cell gene signature. (A) UMAP visualization of the single-cell transcriptomes of 6874 Lin− c-Kit+ peripheral blood cells. The colors indicate Leiden clusters. Expression patterns of lineage genes used to annotate the landscape are provided in supplemental Figure 1. (B) Gene expression levels of mast cell genes and FcεRI subunit genes. (C) Gene expression of CD34. (D) Post-sort flow cytometry analysis of Lin− c-Kit+ cells. The red contour plot shows back-gated FcεRI+ cells. One buffy coat was used to produce the data presented in this figure.
We next devised a plan to generate a second single-cell RNA-sequencing data set that would capture the spectrum of hematopoietic progenitors and cells with the mast cell–like phenotype at high resolution. To determine the isolation strategy of this prospective data set, we first plotted CD34 expression on the Lin− c-Kit+ landscape, visualizing the hematopoietic progenitor cells (Figure 1C). Cluster A cells exhibited residual CD34 expression, which indicated that these cells also had an immature phenotype. Flow cytometric analysis verified the presence of a CD34+ FcεRI+ subpopulation among sorted Lin− c-Kit+ cells (Figure 1D). These cells exhibited lower CD34 protein expression than the bulk of the CD34+ cell population, which agrees with the low CD34 gene expression levels in cluster A. The results suggested that the generation of a Lin− CD34+ c-Kit+ data set would capture a spectrum of hematopoietic progenitor cells and include Lin− CD34lo c-Kit+ FcεRI+ mast cell progenitor–like cells, hereon referred to as population A.
Single-cell transcriptomics reveals an association between FcεRI expression and a mast cell gene signature in hematopoietic progenitors in peripheral blood
Population A is an FcεRI+ subset of the larger Lin− CD34+ c-Kit+ cell fraction (Figure 2A). However, retrospective identification of population A cells within a Lin− CD34+ c-Kit+ single-cell transcriptomics data set is challenging, as population A is defined based on surface protein phenotype. We took advantage of a cell hashing–based method for single-cell RNA-sequencing to generate a single comprehensive data set of peripheral blood progenitors with additionally enriched (spiked-in) barcoded population A cells.17 Briefly, dividing the sample of cells before FACS isolation allowed labeling of a fraction of the cells with PE-oligonucleotide barcodes, which can be detected by using the single-cell RNA-sequencing protocol (Figure 2B). We subsequently sorted PE-oligonucleotide–labeled population A cells (ie, Lin− CD34+ c-Kit+ FcεRI+ cells) and pooled these cells with unlabeled hematopoietic progenitors (supplemental Figure 2). Flow cytometry analysis of the cell pool revealed a bimodal distribution of the PE-oligonucleotide, which was suggestive of successful barcoding, and revealed that 29% of the cells represented spiked-in population A cells (Figure 2C). Single-cell RNA-sequencing with feature barcoding technology allowed simultaneous measurement of gene expression and PE-oligonucleotide barcode levels of the pooled cells. Plotting the entire single-cell transcriptomics data set using UMAP revealed the erythrocyte and neutrophil entry points (Figure 2D), as well as the expected enriched mast cell–like progenitors, population A (Figure 2D-G; supplemental Figures 3-4). Visualization of population A on the hematopoietic landscape highlighted that this population recapitulated the cluster A from Figure 1A and that this population could be divided into 2 clusters, population A1 and A2 (Figure 2D,G). Differential expression testing revealed that population A2 exhibited a more mature phenotype than population A1, including higher levels of tryptase (supplemental Figure 5).
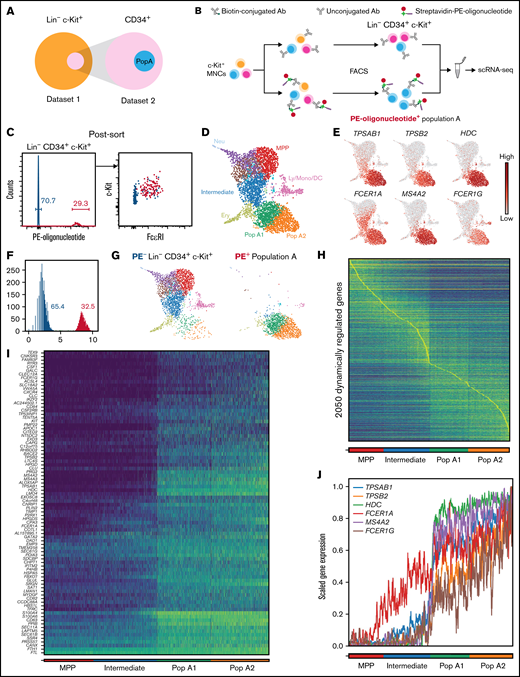
Single-cell transcriptomics reveals a temporal association between FcεRI and the mast cell gene signature. (A) Representation of the cells in the first data set relative to the cells in the prospective second data set. (B) Experimental approach to hashtag a cell subset with a PE-oligonucleotide barcode. (C) Post-sort flow cytometry analysis of pooled cells, constituting Lin− CD34+ c-Kit+ cells without and Lin− CD34+ c-Kit+ FcεRI+ cells with the PE-oligonucleotide hashtag. (D) UMAP visualization of the entire Lin− CD34+ c-Kit+ data set (4063 cells). The colors indicate Leiden clusters. Panels E and G and supplemental Figure 3 provide landscape annotation. Population A (Pop A) consisted of 2 main clusters, Pop A1 and Pop A2. (E) Gene expression levels of mast cell genes and FcεRI subunit genes. (F) Histogram showing the distribution of the PE-oligonucleotide in the single-cell transcriptomics data, resembling the flow cytometry data in panel C. Gray bins represent ambiguous events. (G) Plots showing the PE− Lin− CD34+ c-Kit+ cells and PE+ Lin− CD34+ c-Kit+ FcεRI+ cells (population A). (H) Visualization of highly dynamic genes along the mast cell differentiation trajectory. Cells are ordered according to cluster and pseudotime. (I) Visualization of dynamic genes that positively correlate with rank ordering, also referred to as Pop A signature genes. (J) Plot showing the temporal upregulation of mast cell genes and FcεRI subunit genes. The blue to yellow color gradients in panels H and I specify low to high gene expression. One buffy coat, independent of the buffy coat used for Figure 1, was used to produce the data presented in panels C to J. Ab, antibody; Ery, erythroid; Ly/Mono/DC, lymphocyte/monocyte/dendritic cell; MNCs, mononuclear cells; MPP, multipotent progenitor; Neu, neutrophil; scRNA-seq, single-cell RNA-sequencing.
Single-cell transcriptomics reveals a temporal association between FcεRI and the mast cell gene signature. (A) Representation of the cells in the first data set relative to the cells in the prospective second data set. (B) Experimental approach to hashtag a cell subset with a PE-oligonucleotide barcode. (C) Post-sort flow cytometry analysis of pooled cells, constituting Lin− CD34+ c-Kit+ cells without and Lin− CD34+ c-Kit+ FcεRI+ cells with the PE-oligonucleotide hashtag. (D) UMAP visualization of the entire Lin− CD34+ c-Kit+ data set (4063 cells). The colors indicate Leiden clusters. Panels E and G and supplemental Figure 3 provide landscape annotation. Population A (Pop A) consisted of 2 main clusters, Pop A1 and Pop A2. (E) Gene expression levels of mast cell genes and FcεRI subunit genes. (F) Histogram showing the distribution of the PE-oligonucleotide in the single-cell transcriptomics data, resembling the flow cytometry data in panel C. Gray bins represent ambiguous events. (G) Plots showing the PE− Lin− CD34+ c-Kit+ cells and PE+ Lin− CD34+ c-Kit+ FcεRI+ cells (population A). (H) Visualization of highly dynamic genes along the mast cell differentiation trajectory. Cells are ordered according to cluster and pseudotime. (I) Visualization of dynamic genes that positively correlate with rank ordering, also referred to as Pop A signature genes. (J) Plot showing the temporal upregulation of mast cell genes and FcεRI subunit genes. The blue to yellow color gradients in panels H and I specify low to high gene expression. One buffy coat, independent of the buffy coat used for Figure 1, was used to produce the data presented in panels C to J. Ab, antibody; Ery, erythroid; Ly/Mono/DC, lymphocyte/monocyte/dendritic cell; MNCs, mononuclear cells; MPP, multipotent progenitor; Neu, neutrophil; scRNA-seq, single-cell RNA-sequencing.
To study the temporal association between population A signature genes and FcεRI subunit genes, we reconstructed the differentiation trajectory from multipotent progenitors, through an intermediate cell cluster and population A1, to population A2 cells. The single-cell gene expression profiles allowed temporal ordering of the cells according to their differentiation state along the trajectory. Dynamically regulated genes18 were identified by leveraging cell clustering and diffusion pseudotime inferences (Figure 2H). Correlation analysis between gene expression levels and differentiation stage gave rise to a gene signature associated with population A (Figure 2I). The signature genes of population A included genes involved in the production of proteases (CPA3, TPSAB1, and TPSB2), granule-associated mediators (HDC and SRGN), FcεRI (FCER1A, MS4A2, and FCER1G), cell differentiation and survival (KIT), cell activation (CD63), and prostaglandin-associated enzymes (HPGDS and HPGD). We next investigated the similarities between the population A signature genes and the well-defined (mature) mast cell genes described in Motakis et al.19 Of note, 9 of 14 well-defined mast cell genes were represented within population A signature genes (supplemental Table 1).
We next focused on the temporal upregulation of hallmark mast cell genes and their relation to FcεRI subunit genes during the differentiation from multipotent progenitors to population A cells. Plotting the gene expression along the trajectory revealed that upregulation of the mast cell genes TPSAB1, TPSB2, and HDC sharply increased upon differentiation into early population A cells (Figure 2J). FCER1A, which codes for the α subunit of FcεRI, was expressed in progenitors preceding the population A stage. However, mast cells express all three FcεRI subunits; that is, the α, β, and γ subunits. Notably, the γ subunit is required for surface expression of the FcεRI protein,20,21 and the corresponding gene, FCER1G, is upregulated together with the mast cell genes and specifically in population A along with the actual surface expression of the receptor (Figure 2E,G,J). Taken together, the single-cell transcriptomics analysis shows an association between FcεRI and the appearance of a mast cell gene signature.
Hematopoietic progenitors expressing FcεRI rapidly form mast cells in vitro
The association between the mast cell signature and the FcεRI subunit genes in CD34+ progenitors prompted us to investigate whether population A exhibited mast cell–forming potential. Population A progenitors underwent FACS and culture, using FcεRI− progenitors as a reference. The isolated progenitors were cultured long term in mast cell–promoting conditions (Figure 3A), similar to previous studies.22,23
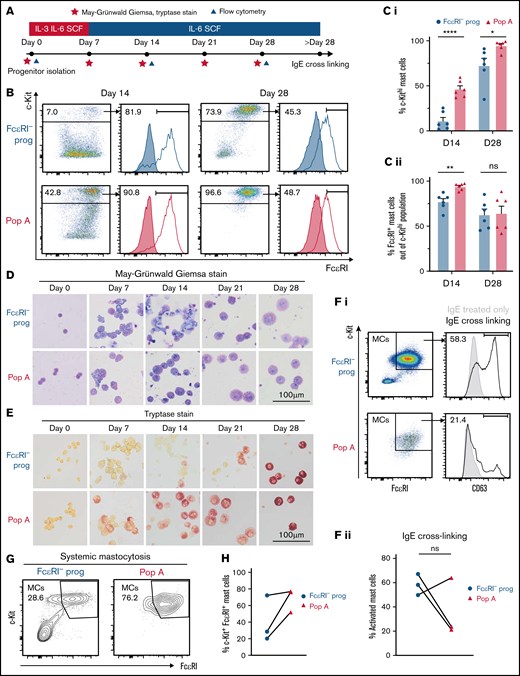
FcεRI+ hematopoietic progenitors exhibit mast cell–forming potential in health and disease. (A) Experimental setup to analyze mast cell differentiation. The study used 10 ng/mL IL-3, 50 ng/mL IL-6, and 100 ng/mL stem cell factor (SCF). (B-C) Flow cytometry analysis of cultured progenitors. Filled histograms show isotype control staining. The results in panel B are quantified in Ci-ii (n = 6). (D) May-Grünwald Giemsa staining. (E) Tryptase staining (day 0, one experiment; days 7-28 from an individual experiment, culture experiment performed 6 times). Microscope: Olympus AX70 with XC10 camera. (Fi) Functional analysis of mast cells derived from hematopoietic progenitors. The CD63 gate that defines mast cell activation was set to ensure that the IgE-only group showed <1% positive events. (Fii) Quantification of activated mast cells in panel Fi (n = 3). Lines link samples from the same donor. (G) Progenitors from patients with systemic mastocytosis were sorted and cultured as indicated in panel A. Cultured FcεRI− progenitors and cultured population A (Pop A) cells from each patient were analyzed by using flow cytometry on the same day (days 28-30, depending on donor). Analysis of aberrant markers was not performed. (H) Quantification of the results in panel G (n = 3). Lines link samples from the same donor. Two-tailed unpaired t tests; *P < .05, **P < .01, ****P < .0001. MCs, mast cells; ns, not significant.
FcεRI+ hematopoietic progenitors exhibit mast cell–forming potential in health and disease. (A) Experimental setup to analyze mast cell differentiation. The study used 10 ng/mL IL-3, 50 ng/mL IL-6, and 100 ng/mL stem cell factor (SCF). (B-C) Flow cytometry analysis of cultured progenitors. Filled histograms show isotype control staining. The results in panel B are quantified in Ci-ii (n = 6). (D) May-Grünwald Giemsa staining. (E) Tryptase staining (day 0, one experiment; days 7-28 from an individual experiment, culture experiment performed 6 times). Microscope: Olympus AX70 with XC10 camera. (Fi) Functional analysis of mast cells derived from hematopoietic progenitors. The CD63 gate that defines mast cell activation was set to ensure that the IgE-only group showed <1% positive events. (Fii) Quantification of activated mast cells in panel Fi (n = 3). Lines link samples from the same donor. (G) Progenitors from patients with systemic mastocytosis were sorted and cultured as indicated in panel A. Cultured FcεRI− progenitors and cultured population A (Pop A) cells from each patient were analyzed by using flow cytometry on the same day (days 28-30, depending on donor). Analysis of aberrant markers was not performed. (H) Quantification of the results in panel G (n = 3). Lines link samples from the same donor. Two-tailed unpaired t tests; *P < .05, **P < .01, ****P < .0001. MCs, mast cells; ns, not significant.
A combination of flow cytometry, cytochemical staining, and enzymatic staining to assess tryptase activity was used to establish the phenotype after long-term culture (Figure 3A). The progenitors, irrespective of initial FcεRI expression, exhibited potential to form c-Kithi mast cells (Figure 3B-C). However, flow cytometry analysis revealed that population A progenitors exhibit a more rapid progression into the c-Kithi mast cells phenotype compared with FcεRI− progenitors. Similarly, morphologic analysis revealed that population A progenitors quickly formed granulated tryptase-expressing mast cells (Figure 3D-E). Crosslinking the FcεRI receptors on the resulting mast cells caused upregulation of the activation marker CD63 on the cell surface (Figure 3F).
It has previously been proposed that mast cells from patients with mastocytosis originate from CD34+ FcεRI− progenitors.5 We isolated population A cells from 3 patients with systemic mastocytosis to investigate whether FcεRI+ hematopoietic progenitors also formed mast cells. Similar to findings in healthy control subjects, population A cells from patients gave rise to mast cells after long-term culture (Figure 3G-H).
Taken together, both population A cells and FcεRI− hematopoietic progenitors exhibit the ability to form functional mast cells. Strikingly, the cell culture assays revealed that population A progenitors obtain a mast cell phenotype more rapidly than FcεRI− progenitors. This is in agreement with the upregulated mast cell gene signature of primary population A progenitors compared with that of FcεRI− progenitors (Figure 2).
IL-3 and IL-5 induce disparate proliferative and survival-promoting effects on mast cell progenitors
The culture assays showed that population A cells constituted mast cell progenitors. Whether cytokines can stimulate or modulate the phenotype of primary mast cell progenitors is largely unexplored. To identify cytokines with the potential to influence mast cell progenitor functions, we plotted the gene expression patterns of selected cytokine receptors that are known to maintain hematopoietic progenitors or promote their differentiation (Figure 4). Mast cell progenitors expressed the IL-3 receptor α (IL3RA) and IL-5 receptor α (IL5RA) chains but no or low expression of the GM-CSF receptor α (CSF2RA) chain. The cytokine receptor common subunit β (CSF2RB), which forms heterodimers with the aforementioned α chains, was also expressed. Expression of the EPO receptor (EPOR) was present in mast cell progenitors, whereas thrombopoietin receptor (MPL) and FLT-3 (FLT3) was low or undetectable. Notably, we also observed specific expression of the IL-33 receptor IL1RL1 in mast cell progenitors.
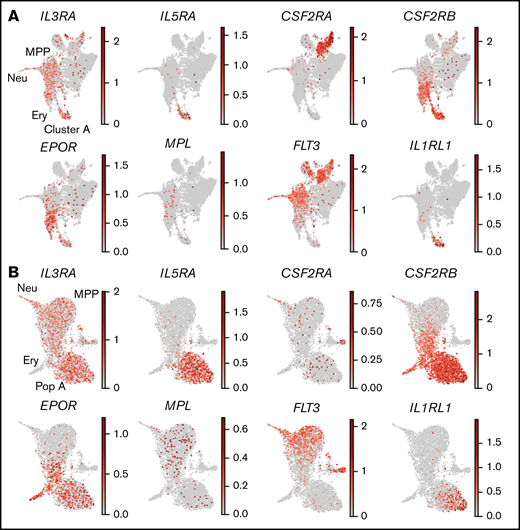
Mast cell progenitors express transcripts of the receptors for IL-3, IL-5, EPO, and IL-33. The graphs show gene expression levels of the indicated cytokine receptors. (A) UMAP visualization of Lin− c-Kit+ cells (data set 1). (B) UMAP visualization of Lin− CD34+ c-Kit+ cells (data set 2). Ery, erythroid; MPP, multipotent progenitor; Neu, neutrophil; Pop A, population A.
Mast cell progenitors express transcripts of the receptors for IL-3, IL-5, EPO, and IL-33. The graphs show gene expression levels of the indicated cytokine receptors. (A) UMAP visualization of Lin− c-Kit+ cells (data set 1). (B) UMAP visualization of Lin− CD34+ c-Kit+ cells (data set 2). Ery, erythroid; MPP, multipotent progenitor; Neu, neutrophil; Pop A, population A.
Next, we explored the effects of the corresponding ligands (ie, IL-3, IL-5, GM-CSF, EPO, thrombopoietin, Flt3L, IL-33) on primary mast cell progenitors. Hematopoietic progenitor cells were isolated by magnetic-activated cell sorting and then stimulated with the individual cytokines. Flow cytometry analysis quantified the frequency of c-Kithi FcεRI+ cells after 5 days in culture with the relevant cytokine (Figure 5A). In some experiments, the hematopoietic progenitors were labeled with CellTrace Far Red to enable analysis of the proliferative response to the cytokine. Treatment with IL-3 resulted in robust maintenance of c-Kithi FcεRI+ cells, and this condition was therefore used as a reference in all experiments. Of the other cytokines analyzed, only IL-5 maintained the c-Kithi FcεRI+ cell population above background levels (Figure 5B). Notably, sorted primary mast cell progenitors exhibited a c-Kithi FcεRI+ phenotype despite culture with IL-3 or IL-5, cytokines that promote basophil and eosinophil generation (supplemental Figure 6).

IL-3 promotes mast cell progenitor proliferation, whereas IL-5 supports mast cell progenitor survival. (A) Gating of pre–mast cells (pre-MCs) after culture of c-Kit+ progenitors for 5 days. (B) Quantification of pre-MCs after culture of c-Kit+ progenitors in various cytokine conditions. Points in each group represent individual buffy coats. Values are normalized to the IL-3 condition of each donor. One-way analysis of variance, Dunnett’s post hoc with no cytokines as control group. (Ci) The proliferative response of mast cell progenitors was analyzed by CellTrace Far Red signal in pre-MCs. The control refers to analysis of all live cells after culture without cytokines, as pre-MCs were virtually absent. (Cii) Quantification of the results in panel Ci (n = 3). (D) Analysis of the proliferative response of mast cell progenitors to various concentrations of IL-5. IL-3 served as positive control. Representative of 2 independent experiments. The study used 10 ng/mL IL-3, 20 ng/mL IL-5, 10 ng/mL GM-CSF, 1 U/mL EPO, 50 ng/mL thrombopoietin (TPO), 50 ng/mL Flt3L, and 22.5 to 100 ng/mL IL-33 unless otherwise specified. ****P < .0001. ns, not significant.
IL-3 promotes mast cell progenitor proliferation, whereas IL-5 supports mast cell progenitor survival. (A) Gating of pre–mast cells (pre-MCs) after culture of c-Kit+ progenitors for 5 days. (B) Quantification of pre-MCs after culture of c-Kit+ progenitors in various cytokine conditions. Points in each group represent individual buffy coats. Values are normalized to the IL-3 condition of each donor. One-way analysis of variance, Dunnett’s post hoc with no cytokines as control group. (Ci) The proliferative response of mast cell progenitors was analyzed by CellTrace Far Red signal in pre-MCs. The control refers to analysis of all live cells after culture without cytokines, as pre-MCs were virtually absent. (Cii) Quantification of the results in panel Ci (n = 3). (D) Analysis of the proliferative response of mast cell progenitors to various concentrations of IL-5. IL-3 served as positive control. Representative of 2 independent experiments. The study used 10 ng/mL IL-3, 20 ng/mL IL-5, 10 ng/mL GM-CSF, 1 U/mL EPO, 50 ng/mL thrombopoietin (TPO), 50 ng/mL Flt3L, and 22.5 to 100 ng/mL IL-33 unless otherwise specified. ****P < .0001. ns, not significant.
CellTrace Far Red staining revealed that IL-3 induced strong proliferation of mast cell progenitors (Figure 5C). By contrast, IL-5 failed to stimulate robust cell proliferation. We titrated the IL-5 concentration to investigate whether increasing concentrations of IL-5 promoted mast cell progenitor proliferation. However, concentrations up to 100 ng/mL IL-5 failed to induce a strong proliferative response (Figure 5D). The proliferation-promoting effect of IL-3 was concentration dependent, with low concentrations inducing little proliferation, as expected (supplemental Figure 7).
Taken together, the results show that IL-3 and IL-5 exhibit disparate proliferative and survival-promoting effects on the mast cell progenitors.
IL-33 downregulates FcεRI expression on mast cell progenitors
Most cytokines investigated failed to maintain a high fraction of c-Kithi FcεRI+ cells after in vitro culture (Figure 5B). However, the cytokines investigated can potentially regulate pathways unrelated to survival and proliferation, which include alteration of the cell surface phenotype. Given the debate on whether mast cell progenitors express FcεRI, we specifically analyzed whether any cytokine shows potential to downregulate FcεRI on primary mast cell progenitors. We cultured hematopoietic progenitors with IL-3 plus one additional cytokine to maintain precursors of mast cells in culture, while simultaneously enabling analysis of individual cytokines’ effects on FcεRI expression. IL-5, GM-CSF, EPO, thrombopoietin, and Flt3L failed to modulate FcεRI expression (Figure 6A). By contrast, IL-33 induced strong downregulation of FcεRI on mast cell progenitors. To explore whether IL-33 exerted a direct effect on mast cell progenitors, we first FACS isolated mast cell progenitors and subjected them to IL-3 alone or in combination with IL-33 (Figure 6B-C). Addition of IL-33 caused robust FcεRI downregulation, consistent with the results in which c-Kit+ cells were stimulated in bulk (Figure 6A,C). Taken together, exposure to IL-33 leads to the downregulation of FcεRI in primary mast cell progenitors.
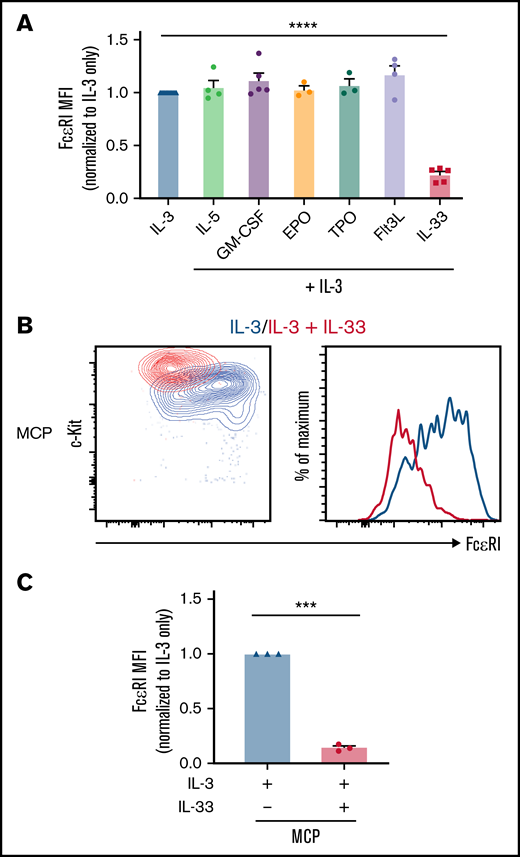
IL-33 downregulates FcεRI expression on mast cell progenitors (MCPs). (A) Quantification of FcεRI expression on pre–mast cells after 5 days in culture with the indicated cytokines. Points in each group represent individual buffy coats. The levels were normalized to the IL-3 condition of each donor. The study used 10 ng/mL IL-3, 20 ng/mL IL-5, 10 ng/mL GM-CSF, 1 U/mL EPO, 50 ng/mL thrombopoietin (TPO), 50 ng/mL Flt3L, and 22.5 to 100 ng/mL IL-33 unless otherwise specified. (B) Flow cytometry analysis of FACS-isolated MCPs cultured with 10 ng/mL IL-3 alone or in combination with 100 ng/mL IL-33 for 5 days. Cultures of FcεRI− progenitors are shown in supplemental Figure 8. (C) Quantification of panel B (n = 3). Two-tailed one-sample t test in panels A and C, hypothetical value 1.0. ***P < .001, ****P < .0001. MFI, median fluorescent intensity.
IL-33 downregulates FcεRI expression on mast cell progenitors (MCPs). (A) Quantification of FcεRI expression on pre–mast cells after 5 days in culture with the indicated cytokines. Points in each group represent individual buffy coats. The levels were normalized to the IL-3 condition of each donor. The study used 10 ng/mL IL-3, 20 ng/mL IL-5, 10 ng/mL GM-CSF, 1 U/mL EPO, 50 ng/mL thrombopoietin (TPO), 50 ng/mL Flt3L, and 22.5 to 100 ng/mL IL-33 unless otherwise specified. (B) Flow cytometry analysis of FACS-isolated MCPs cultured with 10 ng/mL IL-3 alone or in combination with 100 ng/mL IL-33 for 5 days. Cultures of FcεRI− progenitors are shown in supplemental Figure 8. (C) Quantification of panel B (n = 3). Two-tailed one-sample t test in panels A and C, hypothetical value 1.0. ***P < .001, ****P < .0001. MFI, median fluorescent intensity.
Discussion
Here, we show that FcεRI expression appears at the hematopoietic progenitor stage of mast cell differentiation in peripheral blood, challenging the idea that FcεRI upregulation is a late event during mast cell maturation. We also found that IL-33 induces FcεRI downregulation in primary FcεRI+ mast cell progenitors, which unlinks the FcεRI levels from mast cell differentiation.
FcεRI expression has been assumed to increase with mast cell maturation.3 Aberrant mast cells without FcεRI expression are observed in a subset of patients with systemic mastocytosis, contributing to the general view that mast cells originate from FcεRI− progenitors. The inability to detect CD34+ FcεRI+ progenitors in a study of patients with systemic mastocytosis has further strengthened this view.5 We confirm that FcεRI− progenitors in patients exhibit a mast cell–forming capacity. However, we were also able to isolate a population of FcεRI+ progenitors, and these cells gave rise to mast cells. Thus, FcεRI+ progenitors constitute a potential source of mast cells in patients with systemic mastocytosis. The inability to detect FcεRI+ progenitors in a previous report of patients with systemic mastocytosis and normal control subjects is likely attributed to the difference in the method to enrich for hematopoietic progenitors, as Rottem et al5 and the current investigation both used peripheral blood as starting material. We used a c-Kit–based cell selection, as the CD34 levels on mast cell progenitors are lower than those of the main hematopoietic progenitor population. By contrast, the affinity-based CD34 isolation strategy used in Rottem et al is likely to enrich for cells with the highest CD34 levels, which can lead to failure in detecting the mast cell progenitor population.
We show that the bulk of the FcεRI+ progenitors in adult peripheral blood at steady-state conditions exhibit a mast cell gene signature and rapidly form mast cells compared with FcεRI− progenitors. However, these observations do not necessarily mean that FcεRI levels constitute a general marker of mast cell differentiation. For example, mast cells lacking FcεRI are observed at specific anatomical compartments.6 Whether the presence of primary FcεRI− mast cells is a consequence of high local concentrations of IL-33 during cell differentiation remains to be investigated. FcεRI− mast cells are also produced by in vitro differentiation of fetal liver and cord blood progenitor cells, and the commonly used mast cell line HMC-1 lacks FcεRI expression.24-28 Experiments showing that external factors can regulate FcεRI levels in mast cells past the progenitor stage further support the idea that FcεRI expression is not immediately linked with mast cell differentiation.25,29,30 In fact, IL-33 downregulates FcεRI levels in mature mast cells, both at the cell surface and the gene expression level, and simultaneously promotes upregulation of the mast cell signature protease tryptase.30
The culture assay presented here was designed to identify cytokines with major and specific effects on mast cell progenitor survival or phenotype. We cannot exclude the possibility that cytokines that failed to maintain a pre–mast cell population indeed promote mast cell progenitor survival or exhibit regulatory functions. For example, cytokines known to promote survival, proliferation, and differentiation of non–mast cell lineage cells might obscure survival-promoting effects on mast cell progenitors. It is also possible that the cytokines regulate pathways that were not analyzed. For example, EPO inhibits lipopolysaccharide-mediated cytokine secretion of EPO receptor–expressing murine bone marrow–derived mast cells.31 Nevertheless, we showed that IL-3, IL-5, and IL-33 exhibit proliferative, survival-promoting, and FcεRI regulatory functions, respectively, on primary mast cell progenitors.
Survival-promoting functions of cytokines have been investigated on in vitro–derived mature mast cells.32,33 The regulatory effects of cytokines on primary mast cell progenitors, however, are largely unexplored. Ochi et al33 performed thymidine incorporation assays to study the proliferative effects of individual cytokines on cord blood–derived immature mast cells. In line with our results, Ochi et al reported proliferation-promoting effects of IL-3 on in vitro–derived immature mast cells, and IL-5 did not induce proliferation of the immature mast cells. We showed that although IL-5 is insufficient to promote significant mast cell progenitor proliferation, it is able to promote cell survival.
IL-3 and IL-5 share a common β chain for signaling.34 Nevertheless, these cytokines promoted disparate effects on the mast cell progenitors at the initial concentrations tested. Increasing doses of IL-5 failed to induce a proliferative response similar to the capacity of IL-3. A limited number of IL-5 receptors on the cell surface could provide a possible explanation. However, it has yet to be determined whether the α chains of the receptors are involved in cell signaling, which could instruct disparate signaling pathways.
The single-cell transcriptomics data sets presented with this investigation provide the research community with a high-resolution map of hematopoietic progenitor differentiation with focus on the rare mast cell progenitor population. We show how the data can be used to reveal cell lineage bias and factors that regulate mast cell progenitors. Notably, we reveal a temporal association between mast cell lineage differentiation and the upregulation of FcεRI in hematopoietic progenitors in adult peripheral blood. These data provide definitive proof that FcεRI may appear already at the mast cell progenitor stage, before terminal mast cell maturation.
Acknowledgments
The authors acknowledge support from the National Genomics Infrastructure in Stockholm, funded by the Science for Life Laboratory, the Knut and Alice Wallenberg Foundation, and the Swedish Research Council. They are also grateful for support from the SNIC/Uppsala Multidisciplinary Center for Advanced Computational Science for assistance with massively parallel sequencing analysis and access to the UPPMAX computational infrastructure. The authors thank Bertie Göttgens at Wellcome–MRC Cambridge Stem Cell Institute, University of Cambridge, for facilitating the bioinformatics analysis. Recombinant stem cell factor was a generous gift from Swedish Orphan Biovitrum.
The Swedish Research Council (2018-02070 and 2020-01693), the Swedish Cancer Society, the Åke Wiberg Foundation, Karolinska Institutet, Magnus Bergvall’s Foundation, and the Lars Hierta Memorial Foundation supported the study. C.W. was supported by a grant from the China Scholarship Council. This research was funded in part by the Wellcome Trust (203151/Z/16/Z) and the UKRI Medical Research Council (MC_PC_17230).
For the purpose of open access, the author has applied a CC BY public copyright license to any Author Accepted Manuscript version arising from this submission.
Authorship
Contribution: C.W. and O.B. performed experiments; M.E., J.G., and C.S. helped with execution of experiments; C.W. analyzed the cell culture data; D.B. analyzed the single-cell transcriptomics data; J.S.U. diagnosed the patients and organized the collection of the samples; M.S.V. reviewed and contributed to the bioinformatics analysis; N.K.W. helped in coordinating the bioinformatics analysis; J.S.D. and C.W. designed the experiments; G.N. and J.S.D. supervised the study; J.S.D. secured funding; J.S.D., C.W., and D.B. drafted the manuscript; and all authors contributed to the final version of the manuscript.
Conflict-of-interest disclosure: The authors declare no competing financial interests.
The current affiliation for O.B. is Amsterdam UMC, University of Amsterdam, LEXOR, Center for Experimental and Molecular Medicine, Cancer Center Amsterdam, Amsterdam, The Netherlands.
Correspondence: Joakim S. Dahlin, NKS BioClinicum J7:30, Visionsgatan 4, 171 64 Solna, Sweden; e-mail: joakim.dahlin@ki.se.

