

Key Points
The disparity observed between murine HSC populations in their ability to engraft in vivo is due to distinct adhesion molecule expression.
Temporary enhancement of migration-associated molecules on short-term and long-term HSCs allows for prolonged and efficient HSC engraftment.

Abstract
In contrast to the short-term (ST) CD34+ stem cells, studies have suggested that long-term (LT) hematopoietic stem cells (HSCs) found in the CD34− stem cell pool have trouble migrating and engrafting when introduced through IV. To understand why these deficiencies exist, we set out to fully elucidate the adhesion mechanisms used by ST and LT-HSCs to migrate to the bone marrow(BM). Specifically focusing on murine ST-HSCs (Flk2−CD34+) and LT-HSCs (Flk2−CD34−), we observed a distinctive expression pattern of BM homing effectors necessary for the first step, namely sialyl Lewis-X (sLex) (ligand for E-selectin), and the second step, namely CXCR4 chemokine receptor (receptor for SDF-1). sLex expression was higher on Flk2−CD34+ ST-HSCs (>60%) compared with Flk2−CD34− LT-HSCs (<10%), which correlated to binding to E-selectin. Higher concentrations of CXCR4 were observed on Flk2−CD34+ ST-HSCs compared with Flk2−CD34− LT-HSCs. Interestingly, the expression of CD26, a peptidase known to deactivate chemokines (ie, SDF-1), was higher on Flk2−CD34− LT-HSCs. Given that both E-selectin–binding and CXCR4-mediated migration are compromised in Flk2−CD34− LT-HSCs, we aimed to enhance their ability to migrate using recombinant human fucosyltransferase 6 (rhFTVI) and the CD26 inhibitor, Dip A (diprotin A). To this end, we observed that although LT-HSCs expressed low concentrations of sLex, they were able to engraft when transplanted into recipient mice. Moreover, although both CD26 inhibition and fucosylation enhanced migration of both HSC populations in vitro, only pretreatment of LT-HSCs with Dip A enhanced engraftment in vivo after transplantation into recipient mice. Remarkably, fucosylation of Flk2−CD34+ ST-HSCs consistently led to their ability to transplant secondary recipients. These data suggest that using fucosylation and Dip A to overcome the molecular disparity in adhesion mechanisms among ST-HSCs and LT-HSCs differentially influences their abilities to migrate and engraft in vivo and promotes the ability of ST-HSCs to engraft secondary recipient mice, the gold standard for testing functionality of LT-HSCs.
Introduction
Hematopoietic stem cells (HSCs) are part of a heterogeneous population of cells that include short-term HSCs (ST-HSCs), multipotent progenitors, and long-term HSCs (LT-HSCs), in which the ST-HSCs and multipotent progenitors are only able to sustain hematopoiesis for weeks to several months, whereas LT-HSCs can give rise to all the major hematopoietic lineages for over 4 months after their transplantation into recipients.1 However, these rare LT-HSCs are not able to rapidly reconstitute the hematopoietic system partly because of their quiescence hindering their ability to produce mature progeny rapidly.2
A number of studies have aimed to identify markers to further enrich the LT-HSC population from the lineage-negative Sca-1 and c-Kit–positive (LSK) pool of bone marrow (BM) cells in mice. More recent data has further challenged CD34 as the ultimate marker for murine HSCs. Osawa and colleagues2 showed that only the CD34− cell population of LSK BM cells, and not the CD34+ population, could reconstitute murine HSCs over the long-term. Donnelly and colleagues1 found that although both Lin− CD34− cells and Lin− CD34+ cell populations were able to reconstitute BM, the CD34+ fraction gave rise to both short- and long-term engraftment, while the CD34− fraction only gave rise to long-term engraftment. Moreover, the technique of Goodell and colleagues3,4 to focus on the side population of cells that exclude Hoechst 33342 DNA-binding dye in flow cytometric analysis showed that both human and mouse BM cells within the side population were found to express low to undetectable concentrations of CD34.3,4 Collectively, these results established the concept that the most primitive murine HSCs are likely present in the LSK CD34low cell population. Interestingly, more recent research indicates that the expression of additional markers, including cytokine polypeptide deformylase-like tyrosine kinase receptor 3 (Flk2 or Flt3)5 and the SLAM (signaling lymphocyte activation molecule) family markers,6 CD150 and CD48, are differentially expressed across the stem and progenitor cell populations. For example, the LSK−CD150+CD48− cells define the HSC population, LSK−CD150−CD48− define the multipotent progenitors, while LSK−CD150−CD48+ define the ST-HSCs progenitor.7
Overall, these studies demonstrate the existence of a more primitive LT-HSC that can be purified from the mouse BM mononuclear pool. Once these stem cells enter the circulation, they must find their way through an elaborate multistep process controlled by a variety of cell surface adhesion molecules into the BM, where they will engraft and begin to contribute to the blood cell pool of the organism.8 In contrast to the CD34+ stem cells, studies have suggested that LT-HSCs have trouble migrating and engrafting when introduced through IV.2 -4,9 -11 This deficiency may be because of a lack of expression of key adhesion molecules necessary for migration and engraftment.12 Thus, the adhesion mechanisms used by various murine HSC populations to migrate to the BM require further investigation. Indeed, many IV-injected therapeutic stem cells have limited migration capacities to target tissues because of their lack of key homing molecules and, as such, require treatments to improve their cell homing capacities. For example, treatments that lead to enhancing chemokine binding to their receptors on HSCs, including the use of Dip A (diprotin A) to inhibit DPP4 (dipeptidyl peptidase 4),13 PGE2 (prostaglandin E2),14 a short pulse glucocorticoid hormone stimulation to enhance CXCR4 chemokine expression,15 and at the epigenetic level, an inhibitor of HCAC (histone deacetylases), which normally suppresses HSC migration by downregulating the chemokine CXCR4.16 Treatments that enhance the selectin-binding capacities of HSCs have also been used, such as recombinant human fucosyltransferase VI and VII (rhFT).12,17-19 Thus, we investigated the effects of these well-known treatments that have been used in other cell types12,18,20 ,,, -26 to improve and enhance murine HSC migration.
Herein, we present evidence that the murine populations of ST-HSCs (Flk2−CD34+) and LT-HSCs (Flk2−CD34−) exhibit different expressions of homing effectors (sialyl Lewis-X [sLex], E-selectin binding, glycosyltransferase enzymes, and CD26/DPPVI) based on flow cytometry and gene expression analysis. Interestingly, although both CD26 inhibition and cell surface fucosylation remarkably enhanced the expression of homing molecules in both HSC populations in vitro, only pretreatment of Flk2−CD34− HSCs with Dip A significantly enhanced engraftment in vivo after transplantation into recipient mice while fucosylation treatment heightened the engraftment capacity of ST-HSCs to over 3 months. Thus, both treatments (Dip A and rhFTVI) are effective homing and engraftment enhancers for mouse HSC transplantation.
Materials and methods
HSC identification and isolation
Animal experiments were performed in the ARCL (Animal Resource Core Laboratory) of KAUST (King Abdullah University of Science and Technology) using procedures approved by the KAUST Institutional Animal Care and Use Committee. The mice used in this study were purchased from Charles River Laboratories (Calco, Italy) and bred under specific pathogen-free conditions at the ARCL in KAUST. Mice were housed in isolator cages and fed autoclaved food and water. Donor hematopoietic cells were obtained from adult (6- to 12-week-old) female and male wild-type C57BL/6N (CD45.2) donor mice or congenic C57BL/6-Ly5.1 (CD45.1). These C57BL/6 mice share the same genetic background, except they express different alleles of the PTPRC gene (CD45). Whole BM cells were flushed from the femurs and tibias with RPMI supplemented with 5% fetal bovine serum (FBS) and 20 mM EDTA, centrifuged at 10 000 g for 10 minutes at 4°C, and the pellet was filtered through a 70-µm nylon filter (BD Falcon) to obtain a single-cell suspension. Red blood cells were lysed with 1× ammonium chloride for 2 minutes, and the cells were washed twice with Hank’s Balanced Salt Solution (HBSS), incubated with 0.1 mg/mL DNAase in phosphate-buffered saline (PBS) for 10 minutes, and washed with HBSS for sorting and flow-cytometric assays.
HSC enrichment
Mouse BM cells were preenriched (Lin−Sca-1+c-Kit+ [LSK] cells) using biotinylated lineage antibodies against 6 lineage markers: CD5, CD11b, CD45R, anti–7-4, anti–Gr-1 (Ly6G/C), and anti–terr-119 (Miltenyi Biotec) as per the manufacturer's instructions. Briefly, cells were incubated with 2 µg/mL CD16/CD32 for 10 minutes, followed by 50 µL of lineage cocktail biotin for 10 minutes at 4°C. Following centrifugation, pelleted cells were incubated with 100 µL of antibiotin microbeads for 15 minutes at 4°C. Lineage-negative (Lin−) cells were separated via a deplete program using an AutoMacs Pro Separator (Miltenyi Biotec). HSCs were sorted based on preenrichment of Lin− cells, followed by multicolor flow cytometric sorting. Briefly, Sca-1+ and c-kit+ progenitors were firstly enriched, then sorted based on the expression of CD34 and Flk2 by incubating the cells with directly FITC-Sca, PE-c-kit, BV421-CD34, and APC-Flk2 conjugated antibodies at 10 µg/mL (all antibodies details are listed in supplemental Table 1) for 30 minutes at 4°C. Cells were washed twice with fluorescence-activated cell sorting (FACS) buffer (5% FBS, 2 mM EDTA, and HBSS). Lastly, 7-AAD was added to the tube before sorting on BD FACS Aria III or BD influx sorter. Flk2−CD34+ and Flk2−CD34− were used for subsequent experiments.
rhFTVI Treatment and CD26/DPPVI activity assay
The fucosylation treatment was performed as described previously.27 Briefly, both Flk2−CD34+ and Flk2−CD34− HSCs were harvested, washed twice with HBSS, and resuspended at a density of 20 to 40 × 103 cells per mL in FTVI reaction buffer (25 mM 4-(2-hydroxyethyl)-1-piperazineethanesulfonic acid (HEPES)[pH 7.5]; Gibco Invitrogen), 0.1% human serum albumin (Sigma-Aldrich), 0.5 mM guanosine diphosphate-fucose (GDP-fucose) (Sigma), and 5 mM MnCl2 and 1 μg of purified rhFTVI enzyme in HBSS. Cells were incubated at 37°C for 30 minutes. Buffer-only controls without the rhFTVI enzyme were used as a negative control. After the reaction, the cells were washed twice with HBSS and 10 mM EDTA and used immediately for downstream experiments.
For CD26/DPPVI activity, ∼2500 sorted Flk2−CD34+ and Flk2−CD34− HSCs were centrifuged at 300 g for 5 minutes, resuspended in 50 mM Tris/HCl buffer (pH 7.4), placed in a 96-well microplate and incubated with 0.2 mM of the fluorogenic substrate H-Gly-Pro-AMC (7-amino-4-methyl coumarin; Enzo Life Sciences) in a final volume of 0.1 mL in a rotary shaker at 37°C under a 5% CO2 atmosphere for 1 hour. Fluorescence was determined using a spectrofluorometer (SpectraMax M5e Multi-Mode Microplate Reader; excitation 380 nm; emission 460 nm), and CD26 peptidase activity was expressed as nanomoles AMC/min per mL per 2500 cells. Data were normalized by subtracting the value obtained for the 50 mM Tris/HCl buffer fluorogenic substrate (H-Gly-Pro-AMC) control. All samples and controls were performed in triplicate. For CD26/DPPVI inhibition, Flk2−CD34+ and Flk2−CD34− HSCs were suspended in DPBS and treated with 20 mM Dip A (Peptides International) or untreated (DPBS control) for 15 minutes at 37°C, washed twice, and analyzed within 30 minutes.
BM engraftment analysis
Six- to 12-week-old female recipient mice (CD45.1) were irradiated with a BM-lethal dose (9-Gy) in 2 separate doses using an Xstrahl Cabinet Irradiator 12 hours before transplantation. Sorted Flk2−CD34+ and Flk2−CD34− HSCs isolated from the BM of donor mice (CD45.2) were untreated (n = 5 mice) or treated with either Dip A or rhFTVI as described above (5 to 10 mice per group). The cells were then transplanted by tail-vein injection into the recipients, together with helper recipient unfractionated BM cells. The BM and blood were harvested from the recipient mice at 10-, 17- and 30- days after transplantation and then every 2 weeks thereafter up to 3 months after transplantation. Engraftment efficiency was assessed by flow cytometry using the APC-CD45.1 (A20) and Pacific blue-CD45.2 (104) antibodies and expressed as a percentage of the donor cells, hematopoietic cells, and their produced blood cells present in the BM and blood of the recipients. For secondary transplantation, femur and tibia were collected from primary recipients and processed as described in primary transplantation. Flk2−CD34+ and Flk2−CD34− HSCs were injected into each lethally irradiated secondary recipient. BM aspiration from secondary transplanted mice was analyzed for 2 months after transplantation, as described above. For E-selectin blocking in-vivo, the recipient mice were injected with anti–E-selectin function-blocking Ab (clone 9A9) at 100 μg/mL 2 hours before introducing the HSCs through IV, or, where indicated, the blocking antibody was injected twice, at 5 hours and 2 hours, before the HSCs. The control mice were injected with the same concentration of isotype control (rat immunoglobulin G1 [IgG1]) antibody. Engraftment efficiency was assessed as described above.
Statistical analysis
All experiments were carried out in triplicates. Data obtained were plotted and statistically analyzed using the software package GraphPad Prism version 9.0 for Mac. Data are represented as the mean ± standard deviation. Statistical analysis was performed using an unpaired Student t test. P < .05 was considered significant.
Please refer to supplemental Data for extended methods, including flow cytometric analysis, mass spectrometry, quantitative reverse transcription-polymerase chain reaction (PCR), clonogenic progenitor cell assay, and cell migration assay.
Results
The murine LSK HSC pool can be subfractionated into distinct populations using FLK2 and CD34
Murine LT-HSC activity is found within the LSK BM population.2,3 However, LT-HSCs can be further enriched out of the LSK, ST-HSCs, and multipotent progenitors using additional markers.2,9,10 Here, we enriched the LT-HSC population using the markers CD34 and Flk2 (Flt3), which are not expressed during early hematopoietic development.28 To this end, mononuclear cells were isolated from the BM (femur and tibia) of CD45.2 (C57BL/6 wild type), and a Lin− fraction was prepared based on 6 biotin-conjugated lineage markers: CD5, CD11b, CD45R, anti–7-4, anti–Gr-1 (Ly6G/C), and anti–Terr-119 (see Materials and methods). As illustrated in supplemental Figure 1, magnetic cell separation using the Auto-MACS (Mitenyi Biotec) resulted in a clear separation between Lin+ and Lin− cells.
The Lin− fraction was then stained for the cell surface markers Sca-1, c-kit, Flk2, CD34, and 7-AAD. As shown in Figure 1A (left), 57.58% ± 18%, 12.6% ± 1.05%, 41.72% ± 2.75%, and 18.7% ± 2.63% of cells in the Lin− fraction expressed c-kit, Sca-1, CD34, and Flk2, respectively. Moreover, >80% of LSK cells were CD34+, and >60% of LSK cells expressed FLK (Figure 1A, right).

Sorting and characterization of BM-derived murine Flk2−CD34−LT-HSCs and Flk2−CD34+ ST-HSCs. (A) Expression analysis of (left) stem cell markers in the Lin− fraction of the BM of C57BL/6 mice. Following mononuclear cell isolation from the BM and lineage depletion, the cells were analyzed for the stem cell markers, Sca-1, c-Kit, CD34, and Flk2; and (right) of Flk2 and CD34 following gating on LSK using flow cytometric analysis. Each data point represents mean ± SD. (Bi) Lin− BM cells were stained for c-Kit and Sca-1 along with CD34 and Flk2. (Bii) Following the selection of live-singlet cells, c-Kit and Sca-1 double-positive cells were investigated for their expression of CD34 and Flk2 to isolate Flk2−CD34+ HSCs (purple), Flk2−CD34− HSCs (green), and progenitors (orange). Gates denote the sorting strategy used for each of the populations (n = 29 independent experiments). (C) The frequency of each sorted population of Flk2−CD34− LT-HSCs and Flk2− CD34+ ST-HSCs in the whole BM cells (left) and in the Lin− fraction following lineage depletion (right). (D) RNA was isolated from sorted Flk2−CD34− LT-HCs and Flk2−CD34+ ST-HSCs. SYBR green-based real-time qPCR was carried out using primers for CD34 and glyceraldehyde-3-phosphate (GAPDH). Results from qPCR were obtained from n = 3 independent experiments. (Ei) Both HSC populations were stained with CD150 antibody and gated according to fluorescence minus 1 (FMO) to determine CD150 expression using flow cytometric analysis. (Eii) The graph is representative of 1 experiment from n = 3 independent experiments. Results were quantified and analyzed using the unpaired t test (**P = .001) and presented as mean ± SEM.
Sorting and characterization of BM-derived murine Flk2−CD34−LT-HSCs and Flk2−CD34+ ST-HSCs. (A) Expression analysis of (left) stem cell markers in the Lin− fraction of the BM of C57BL/6 mice. Following mononuclear cell isolation from the BM and lineage depletion, the cells were analyzed for the stem cell markers, Sca-1, c-Kit, CD34, and Flk2; and (right) of Flk2 and CD34 following gating on LSK using flow cytometric analysis. Each data point represents mean ± SD. (Bi) Lin− BM cells were stained for c-Kit and Sca-1 along with CD34 and Flk2. (Bii) Following the selection of live-singlet cells, c-Kit and Sca-1 double-positive cells were investigated for their expression of CD34 and Flk2 to isolate Flk2−CD34+ HSCs (purple), Flk2−CD34− HSCs (green), and progenitors (orange). Gates denote the sorting strategy used for each of the populations (n = 29 independent experiments). (C) The frequency of each sorted population of Flk2−CD34− LT-HSCs and Flk2− CD34+ ST-HSCs in the whole BM cells (left) and in the Lin− fraction following lineage depletion (right). (D) RNA was isolated from sorted Flk2−CD34− LT-HCs and Flk2−CD34+ ST-HSCs. SYBR green-based real-time qPCR was carried out using primers for CD34 and glyceraldehyde-3-phosphate (GAPDH). Results from qPCR were obtained from n = 3 independent experiments. (Ei) Both HSC populations were stained with CD150 antibody and gated according to fluorescence minus 1 (FMO) to determine CD150 expression using flow cytometric analysis. (Eii) The graph is representative of 1 experiment from n = 3 independent experiments. Results were quantified and analyzed using the unpaired t test (**P = .001) and presented as mean ± SEM.
LT-HSCs lack CD34 and Flk2 expression2,5,11 ; therefore, these cells can be sorted based on the absence of these markers. Lin− cells were stained as indicated above (FITC-Sca-1, PE-c-kit, BV421-CD34, and APC-Flk2) along with 7-AAD, then sorted. As shown in Figure 1B, the Lin− BM cells from 8- to 12-week-old C57BL/6 (CD45.2) mice were enriched for viable singlets that were double-positive for c-kit and Sca-1; these cells represented about 1.2% to 5.1% of the Lin− fraction. Following sorting for CD34 and Flk2, 3 distinct LSK populations were identified: LSK/CD34−/Flk2− (green), LSK/CD34+/Flk2− (purple), and LSK/CD34+/Flk2+ (orange). The frequency of these HSCs in BM was 0.01278 ± 0.0087% for Flk2−CD34− and 0.03827 ± 0.0265% for Flk2−CD34+ (Figure 1C) (n = 29 independent experiments). In agreement with a previous study,28 LSK-Flk2+ cells almost exclusively coexpressed CD34, while LSK-Flk2− cells contained both CD34+ and CD34− cells. These populations were isolated by FACS at high purities and were confirmed as CD34+ and CD34− by quantitative PCR (qPCR) using CD34 primers (Figure 1D). To verify the differences between these populations, we assessed CD150, a marker recently used to define LT-HSCs7 (Figure 1E). More than 90% of the Flk2−CD34− HSCs expressed CD150, further supporting the long-term activity of this HSC fraction compared with the Flk2−CD34+ fraction (P = .001). Thus, the LT-HSCs are defined as Flk2−CD34− and the ST-HSCs are defined as Flk2−CD34+ for the remainder of our studies.
Flk2−CD34+ and Flk2−CD34− HSCs have distinct homing molecule expression profiles
Mouse LT-HSCs have been identified using a variety of markers in the past decade.2 -4,9 -11 However, the homing capabilities of these cells to the BM have not been fully investigated. Thus, we compared the expression of homing molecules on the surface of Flk2−CD34− LT-HSCs and Flk2−CD34+ ST-HSCs. Selectins bind sLex (or its isomer sLea) epitopes on terminal carbohydrate determinants of glycoproteins or glycolipids.29 sLex is a sialofucosylated tetrasaccharide containing a sialic acid linked to a galactose via an α(2,3) bond and a fucose linked to an N-acetylglucosamine via an α(1,3) bond and can be identified by anti-sLex antibodies such as CSLEX-1, KM93, and HECA-452 (Human Cutaneous Lymphocyte Antigen).30 We first sought to determine whether the LT-HSC Flk2−CD34− and ST-HSC Flk2−CD34+ populations express the sLex epitopes, which are essential for binding to selectins and E-selectin, in particular, as it is constitutively expressed on BM endothelial cells.31 Interestingly, Flk2−CD34− HSCs exhibited weak sLex expression (<∼10%) after staining with HECA-452 while Flk2−CD34+ HSCs expressed significantly higher concentrations of sLex (>∼60%; P < .001) (Figure 2Ai, left). Moreover, the same expression pattern of sLex was confirmed using other anti-sLex antibodies, including CSLEX-1 and KM93, that showed Flk2−CD34+ HSCs exhibited higher concentrations of sLex (∼40% and ∼92%, respectively vs ∼2% CD15s and ∼35% KM93+ for Flk2−CD34− HSCs) (supplemental Figure 2A). Thus, flow cytometry was performed to assess whether the 2 populations differ in terms of E-selectin binding. Interestingly, both Flk2−CD34+ and Flk2−CD34− HSCs bound to the E-selectin-hIg chimera (E-Ig), but Flk2−CD34+ exhibited significantly higher E-selectin binding than Flk2−CD34− HSCs (P = .003) (Figure 2Ai, right). These results are also summarized in Figure 2Aii from n = 5 independent experiments.
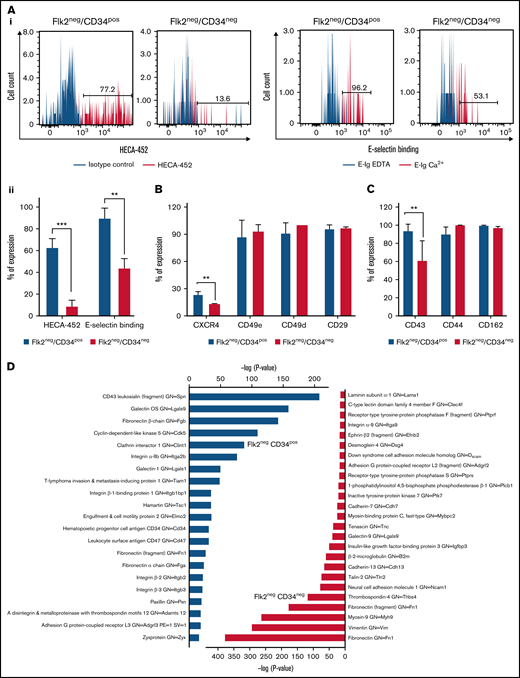
Analysis of homing-related molecules on murine Flk2−CD34− LT-HSCs and Flk2−CD34+ ST-HSCs illustrates a difference in the expression of E-selectin ligands and CXCR4. (A) Flow cytometric analysis was used to determine sLex expression on HSC populations using HECA-452-mAb (gray histogram). Isotype controls (rat IgM) are illustrated in the black histograms. E-selectin binding was also assessed by incubating the cells with E-selectin-hIg chimeric protein followed by anti-human IgG-PE (gray histogram). As a control, 10 mM EDTA was added to abrogate the binding of cells to E-selectin (black histogram). (Ai) Representative histograms are shown from n = 5 independent experiments. A statistical analysis was performed with the unpaired t test (**P = .001 and ***P < .001) as illustrated in (Aii). (B) The expression of the integrins, CD49e, CD49d, and CD29, and the chemokine receptor, CXCR4, on HSC populations was analyzed by flow cytometry. Positive expression was determined as the percent positive cells ± SEM compared with FMO control. Statistical analysis was performed using the unpaired t test (**P = .001). (C) Flow cytometric analysis of E-selectin ligands (CD43, CD44, and PSGL-1) expressed on the 2 subsets of HSCs. Results are expressed as an average percent of expression (above the isotype control) of n = 3 independent experiments. (D) Mass spectrometry data analysis of E-selectin ligands were immunoprecipitated using recombinant E-selectin protein from lysates of Flk2−CD34+ and Flk2−CD34− HSCs, and the purified proteins were identified by mass spectrometry. The identified proteins were analyzed using cell adhesion as a biological process in gene ontology and the data plotted according to the P value for each identified protein.
Analysis of homing-related molecules on murine Flk2−CD34− LT-HSCs and Flk2−CD34+ ST-HSCs illustrates a difference in the expression of E-selectin ligands and CXCR4. (A) Flow cytometric analysis was used to determine sLex expression on HSC populations using HECA-452-mAb (gray histogram). Isotype controls (rat IgM) are illustrated in the black histograms. E-selectin binding was also assessed by incubating the cells with E-selectin-hIg chimeric protein followed by anti-human IgG-PE (gray histogram). As a control, 10 mM EDTA was added to abrogate the binding of cells to E-selectin (black histogram). (Ai) Representative histograms are shown from n = 5 independent experiments. A statistical analysis was performed with the unpaired t test (**P = .001 and ***P < .001) as illustrated in (Aii). (B) The expression of the integrins, CD49e, CD49d, and CD29, and the chemokine receptor, CXCR4, on HSC populations was analyzed by flow cytometry. Positive expression was determined as the percent positive cells ± SEM compared with FMO control. Statistical analysis was performed using the unpaired t test (**P = .001). (C) Flow cytometric analysis of E-selectin ligands (CD43, CD44, and PSGL-1) expressed on the 2 subsets of HSCs. Results are expressed as an average percent of expression (above the isotype control) of n = 3 independent experiments. (D) Mass spectrometry data analysis of E-selectin ligands were immunoprecipitated using recombinant E-selectin protein from lysates of Flk2−CD34+ and Flk2−CD34− HSCs, and the purified proteins were identified by mass spectrometry. The identified proteins were analyzed using cell adhesion as a biological process in gene ontology and the data plotted according to the P value for each identified protein.
Next, we investigated the expression levels of homing molecules involved in subsequent stages of cell migration that follow E-selectin binding, specifically integrins and chemokines. CD49d, CD49e, and CD29 are part of the integrin family that acts as cell adhesion receptors involved in cell–cell and cell–extracellular matrix interactions.32 CXCR4 is the chemokine receptor for SDF-1α and facilitates homing of HSCs to the BM.13 The expression of these surface markers on sorted Flk2−CD34+ and Flk2−CD34− HSCs was assessed by flow cytometry (supplemental Figure 2B), and no significant differences in the expression of these integrins were observed. However, higher concentrations of CXCR4 expression were measured on the surface of Flk2−CD34+ HSCs compared with Flk2−CD34− HSCs (Figure 2B) (P = .002). To identify the relevant glycoprotein E-selectin ligands expressed on Flk2−CD34+ and Flk2−CD34− HSCs, we stained for the common E-selectin ligands CD43, CD44, and PSGL-1 using flow cytometry.19,33 As shown in supplemental Figure 2C, both HSC populations expressed CD44 and PSGL-1. However, CD43 was expressed at significantly lower concentrations on Flk2−CD34− HSCs compared with Flk2−CD34+ (P = .002) (Figure 2C).
Next, we sought to identify the protein E-selectin ligands with potential sLex decorations. We performed a mass spectrometry34 analysis on immunoprecipitations prepared from lysates of both HSC populations using E-Ig chimera protein. Although the flow cytometric analysis showed the expression of the glycoprotein E-selectin ligands, PSGL-1 (CD162), CD43, and CD44 on both HSCs populations (Figure 2B), the mass spectrometry only identified CD43 and CD34 in Flk2−CD34+ HSCs. As shown in Figure 2D, using cell adhesion and related intracellular associated proteins as a biological process in gene ontology, we identified a unique profile of adhesion-related proteins within each HSC population. For example, the major adhesion-related molecules found in Flk2−CD34− HSCs following E-Ig immunoprecipitation included extracellular matrix proteins such as fibronectin, thrombospondin-4, and tenascin-C as well as cell-surface proteins that are known to mediate adherence between cells, such as cadherin-7 and cadherin-13. However, the major adhesion-related molecules found in Flk2−CD34+ HSCs were CD43, CD34, integrins (integrin α-IIb, β3-integrin, and β2-integrin), and galectin-9 and -1 as well as intracellular proteins such as paxillin. In addition, proteins including fibronectin 1, tiam1, adamts12, and elmo2 were also identified and played key roles in cytoskeletal rearrangements and cellular migration.35 All detected proteins (along with glycoproteins) are listed in supplemental Tables 2 and 3.
Overall, these results highlight the main differences between Flk2−CD34+ and Flk2−CD34− HSCs could be the degree of expression of sLex and CXCR4, which may affect the migration of these populations.
Flk2−CD34− and Flk2−CD34+ HSCs have distinct sialyltransferase (ST) and fucosyltransferase gene expression profiles
To further explore the cause of the differences in the expression of sLex between the populations, we evaluated the expression of glycosyltransferase genes involved in creating sLex structures. To better understand the role of STs and fucosyltransferases (FTs), which are necessary for the terminal monosaccharide additions of fucose and sialic acid in sLex biosynthesis,36 we assessed the mRNA expression of ST3GAL1, ST3GAL2, ST3GAL3, ST3GAL4, ST3GAL5, and ST3GAL6 and FT1, FT2, FT4, FT7, FT8, FT9, FT10, and FT11 in Flk2−CD34− and Flk2−CD34+ HSCs using real-time qPCR. The Flk2−CD34− HSCs expressed relatively higher concentrations of ST3GAL transcripts (Figure 3A, left), specifically, ST3GAL2 and ST3GAL6 compared with Flk2−CD34+ HSCs (**P = .001, ***P < .001, respectively). Our analysis illustrated that although FT7, FT8, and FT9 were expressed at similar concentrations in both mouse HSC populations, FT4 was expressed at significantly higher concentrations in Flk2−CD34− HSCs (*P = .03); however, FT4 possesses a very limited capacity to create sLex as previously described.37 Interestingly, FT10 and FT11 tended to be expressed at higher concentrations in Flk2−CD34+ HSCs (Figure 3A, right). It is apparent from the heat map in Figure 3B that Flk2−CD34+ HSCs tended to show higher degrees of expression in FTs compared with the Flk2−CD34− HSCs with the exception of FT4.
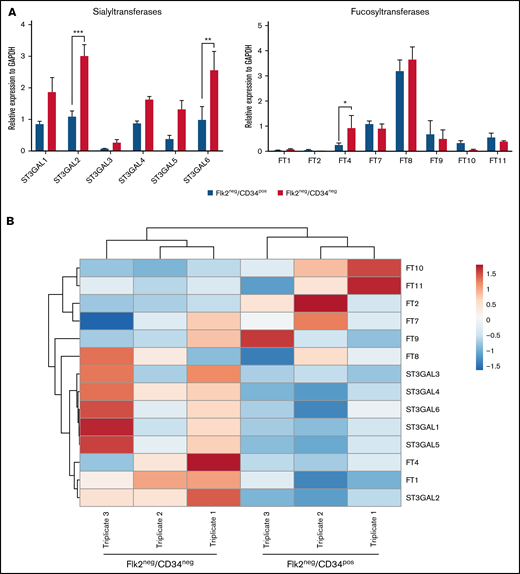
Glycosyltransferases (GTs) important for sLex decorations are differentially expressed between murine Flk2−CD34− LT-HSCs and Flk2−CD34+ ST-HSCs. GT gene expression was assessed using real-time semiquantitative PCR. qPCR was performed as detailed in the Materials and methods section. (A) The level of expression of the murine GT genes, fucosyltransferases (FT), and sialyltransferases (ST) were determined relative to the GADPH housekeeping gene. Each data point represents the mean ± SEM (n = 3 independent experiments) and statistical analysis was performed using the unpaired t test (*P = .033, **P = .002, and ***P < .001). (B) Heatmap generated from qPCR of GT gene expression in the murine HSC populations. Gene expression of the 14 GT genes was determined and hierarchically clustered in a genewise manner according to the correlation distance and average clustering and with the tightest cluster first. ClustViA, a web tool, was used for visualizing the clustering of multivariate data (BETA). The color intensity indicates expression levels where red is the high-expressed and blue is the low-expressed, while gray indicates that it wasn’t detected. Each sample was performed in biological triplicates (n = 3).
Glycosyltransferases (GTs) important for sLex decorations are differentially expressed between murine Flk2−CD34− LT-HSCs and Flk2−CD34+ ST-HSCs. GT gene expression was assessed using real-time semiquantitative PCR. qPCR was performed as detailed in the Materials and methods section. (A) The level of expression of the murine GT genes, fucosyltransferases (FT), and sialyltransferases (ST) were determined relative to the GADPH housekeeping gene. Each data point represents the mean ± SEM (n = 3 independent experiments) and statistical analysis was performed using the unpaired t test (*P = .033, **P = .002, and ***P < .001). (B) Heatmap generated from qPCR of GT gene expression in the murine HSC populations. Gene expression of the 14 GT genes was determined and hierarchically clustered in a genewise manner according to the correlation distance and average clustering and with the tightest cluster first. ClustViA, a web tool, was used for visualizing the clustering of multivariate data (BETA). The color intensity indicates expression levels where red is the high-expressed and blue is the low-expressed, while gray indicates that it wasn’t detected. Each sample was performed in biological triplicates (n = 3).
To test whether other glycosyltransferases involved in O-linked sLex creation were differentially expressed among the HSC populations, we analyzed publically available RNA sequencing data from LT-HSCs (CD150+Flk2−CD34−) and ST-HSCs (CD150+Flk2−CD34−) that were published recently.38 mRNA transcripts per million (TPM) were quantified in 3 biological triplicates for each population, and the average TPM was determined for each enzyme, including GALNT (O-glycan), ST6GALNAC (Tn antigen), C1GALT (core 1), B3GNT (core 1 extension), GCNT (core 2 branching), CHST (keratin sulfate), B4GALT (lactosamine), ST3GAL, ST6GAL (T-antigen), and FT (supplemental Figure 3A). Notably, from the heatmap in supplemental Figure 3B, the LT-HSCs express more ST6GALNAC and ST6GAL transcripts, which are enzymes involved in sialylation of the Tn on O-glycans. This could hinder the extension via core 1 and core 2 and ultimately the formation of the O-linked sLex epitopes.29 Overall, these results further confirm the differential expression of crucial enzymes involved in sLex synthesis in Flk2−CD34− and Flk2−CD34+ HSCs.
Exofucosylation enhances E-selectin ligand activity without reducing the differentiation capacity of Flk2−CD34− and Flk2−CD34+ HSCs in vitro
We found Flk2−CD34− HSCs expressed low concentrations of sLex, and both populations showed a differential expression of FT mRNA, responsible for α(1,3) fucosylation of E-selectin ligands. Therefore, we sought to engineer the expression of sLex glycan structures on the surface of Flk2−CD34− and Flk2−CD34+ HSCs using the (1,3) linkage-specific fucosyltransferase, rhFTVI.27 This enzyme specifically places fucose onto a terminal type 2 lactosamine unit; if that lactosamine is capped with a (2,3)-linked sialic acid, sLex is created. Flow cytometric analysis was performed to quantify sLex expression using the HECA-452 antibody, and as illustrated in Figure 4A, rhFTVI treatment increased HECA-452 reactivity in both populations, indicating sLex structures were created. These results are also summarized in Figure 4B (**P = .002 and ***P < .0001), from n = 4 independent experiments. Moreover, the creation of these sLex epitopes increased HSC binding to E-selectin in both populations (Figure 4C).

rhFTVI treatment induces sLex expression on all Lin− stem populations. (A) Cells sorted for Flk2− CD34− LT-HSCs and Flk2− CD34+ ST-HSCs were treated either with rhFTVI or in buffer alone, as outlined in the Materials and methods section. After treatment, flow cytometric analysis for sLex expression (HECA-452) was performed. Plots are representative of n = 4 independent experiments. (B) The average percentage expression for each condition in (A) is represented. (C) The binding of E-selectin-hIg chimera was measured on sorted Flk2−CD34− LT-HSCs and Flk2−CD34+ ST-HSC populations treated either with rhFTVI or in buffer alone using flow cytometric analysis. (D) Colony-forming capacities of sorted Flk2−CD34− LT-HSCs and Flk2−CD34+ ST-HSCs were determined. Five hundred cells were either treated with rhFTVI or untreated and were cultured in methylcellulose in the presence of cytokines (SCF, IL-3, EPO, and GM-CSF) for 12 to 14 days. The number and composition of the colonies generated were counted and represented in the graph. BFU-E, erythroid burst-forming unit; CFU-GEMM, granulocyte-erythroid-megakaryocyte-macrophages colony-forming unit; CFU-GM, granulocyte-macrophage colony-forming unit.
rhFTVI treatment induces sLex expression on all Lin− stem populations. (A) Cells sorted for Flk2− CD34− LT-HSCs and Flk2− CD34+ ST-HSCs were treated either with rhFTVI or in buffer alone, as outlined in the Materials and methods section. After treatment, flow cytometric analysis for sLex expression (HECA-452) was performed. Plots are representative of n = 4 independent experiments. (B) The average percentage expression for each condition in (A) is represented. (C) The binding of E-selectin-hIg chimera was measured on sorted Flk2−CD34− LT-HSCs and Flk2−CD34+ ST-HSC populations treated either with rhFTVI or in buffer alone using flow cytometric analysis. (D) Colony-forming capacities of sorted Flk2−CD34− LT-HSCs and Flk2−CD34+ ST-HSCs were determined. Five hundred cells were either treated with rhFTVI or untreated and were cultured in methylcellulose in the presence of cytokines (SCF, IL-3, EPO, and GM-CSF) for 12 to 14 days. The number and composition of the colonies generated were counted and represented in the graph. BFU-E, erythroid burst-forming unit; CFU-GEMM, granulocyte-erythroid-megakaryocyte-macrophages colony-forming unit; CFU-GM, granulocyte-macrophage colony-forming unit.
To verify that the fucosylation treatment did not affect the differentiation capability of these HSC populations, clonogenicity assays were performed following treatment with rhFTVI. As shown in Figure 4D, rhFTVI treatment did not significantly influence the clonogenic capacity of either Flk2−CD34− or Flk2−CD34+ HSCs compared with the untreated HSC populations. Of note, the untreated Flk2−CD34− HSCs produced a significantly higher total number of colonies compared with Flk2−CD34+ HSCs, which is consistent with published data.11 Thus, these results indicated that rhFTVI increases the expression of sLex and subsequent binding to E-selectin for both Flk2−CD34− and Flk2−CD34+ HSCs without affecting their differentiation abilities.
Dip A inhibits CD26 activity and increases the migration of both Flk2−CD34− and Flk2−CD34+ HSCs in vitro
CD26 or DPPIV (dipeptidyl peptidase IV) is a homodimeric type II transmembrane glycoprotein expressed on a variety of cells, including HSCs and epithelial cells of different tissues.39,40 CD26 cleaves SDF-1α (stromal cell-derived factor-1α; CXCL12), which is a chemokine expressed on the surface of endothelial cells in the BM. However, cleavage of SDF-1α can impair its binding capacity to CXCR4 and prevent HSC homing.13,41 Therefore, CD26 expression on the surface of murine Flk2−CD34− and Flk2−CD34+ HSCs was examined by flow cytometry. As shown in Figure 5A, Flk2−CD34− HSCs expressed significantly higher concentrations of CD26 on their surface than Flk2−CD34+ HSCs (P = .002) (Figure 5B). This was supported by real-time quantitative reverse transcription results showing that Flk2−CD34− HSCs expressed higher expression concentrations of CD26 than Flk2−CD34+ HSCs (P = .03) (Figure 5C).
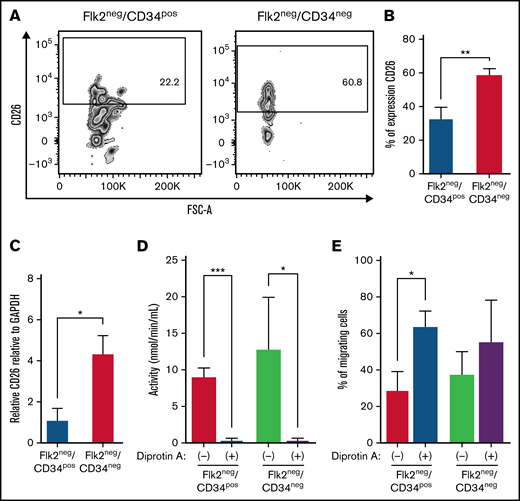
Inhibiting CD26 activity improves the migration of Flk2−CD34− LT-HSCs and Flk2−CD34+ ST-HSCs in vitro. (A) Representative flow cytometric contour plots (n = 3 independent experiments) illustrating CD26 expression on Flk2−CD34− LT-HSCs and Flk2−CD34+ ST-HSCs isolated from the BM of C57BL/6. (B) Data from (A) is presented as percent (%) positive cells ± SEM as compared with FMO control. The statistical analysis was performed with the unpaired t test (**P = .001). (C) RT-PCR was used to determine the expression of CD26 in the Flk2−CD34− LT-HSCs and Flk2−CD34+ ST-HSCs. Results were obtained from n = 3 independent experiments and analyzed using the unpaired t test (*P = .03) and presented as mean ± SEM. (D) The activity of CD26 peptidase in both HSC populations before and after CD26 inhibition with Dip A was assessed from n = 3 independent experiments (*P = .03 and ***P < .001). (E) A transwell migration assay was used to assess the migration of both HSC populations toward SDF-1α with (+) and without (−) the presence of Dip A. Data were normalized by subtracting the percent migration of untreated cells without SDF-1α. Each sample was performed in triplicate, and n = 3 independent experiments were performed.
Inhibiting CD26 activity improves the migration of Flk2−CD34− LT-HSCs and Flk2−CD34+ ST-HSCs in vitro. (A) Representative flow cytometric contour plots (n = 3 independent experiments) illustrating CD26 expression on Flk2−CD34− LT-HSCs and Flk2−CD34+ ST-HSCs isolated from the BM of C57BL/6. (B) Data from (A) is presented as percent (%) positive cells ± SEM as compared with FMO control. The statistical analysis was performed with the unpaired t test (**P = .001). (C) RT-PCR was used to determine the expression of CD26 in the Flk2−CD34− LT-HSCs and Flk2−CD34+ ST-HSCs. Results were obtained from n = 3 independent experiments and analyzed using the unpaired t test (*P = .03) and presented as mean ± SEM. (D) The activity of CD26 peptidase in both HSC populations before and after CD26 inhibition with Dip A was assessed from n = 3 independent experiments (*P = .03 and ***P < .001). (E) A transwell migration assay was used to assess the migration of both HSC populations toward SDF-1α with (+) and without (−) the presence of Dip A. Data were normalized by subtracting the percent migration of untreated cells without SDF-1α. Each sample was performed in triplicate, and n = 3 independent experiments were performed.
To determine if the difference in expression correlated with a difference in activity, CD26/DPPIV enzymatic assays were performed by incubating the Flk2−CD34− and Flk2−CD34+ HSCs with 0.2 mM of the fluorogenic substrate H-Gly-Pro-AMC at 37°C for 1 hour and assessing activity at 0, 30, and 60 minutes using a spectrophotometer. Overall, there was no significant difference in activity between the 2 populations at any time point tested (data not shown). To further investigate the role of CD26/DPPIV, we inhibited its activity using the specific CD26/DPPIV inhibitor Dip A.42 Treatment with 20 mM Dip A for 15 minutes at 37°C significantly decreased CD26/DPPIV activity in both HSC subpopulations (*P = .03 and **P < .001) (Figure 5D).
Both Flk2−CD34− and Flk2−CD34+ HSCs express the chemokine receptor CXCR4 and should migrate toward the chemokine SDF-1α. Thus, a chemotaxis assay42 was used to assess the effect of CD26/DPPIV inhibition on HSC transmigration. Briefly, HSCs cells were either left untreated (Dip A[−]) or treated with Dip A (Dip A[+]), resuspended in serum-free RPMI medium, and loaded into the upper chambers of 5 μm Transwell inserts. RPMI containing 10% FBS and 200 ng/mL SDF-1α was placed in the bottom layer. To inhibit CD26/DPPIV, 20 mM DiP A was added to the bottom layer of the treated wells. As illustrated in Figure 5E, Dip A increased the migration of both Flk2−CD34+ HSCs (29.25% vs 63.54%) and Flk2−CD34− HSCs (37.53% vs 55.20%). Collectively, we found that although Flk2−CD34− and Flk2−CD34+ HSCs express different concentrations of CD26, this did not equate to an observable difference in CD26/DPPIV activity. However, inhibition of CD26/DPPIV abrogated CD26 activity in both populations of HSCs and increased their migration toward SDF-1α.
Inhibition of CD26/DPPIV activity significantly improved the engraftment of Flk2−CD34− HSCs in vivo
To investigate the engraftment potential of Flk2−CD34− and Flk2−CD34+ HSCs in vivo following CD26 inhibition, we used congenic strains of C57BL/6 mice. The wild-type C57BL/6 strain carries the Ptprcb gene and is denoted as CD45.2, and the congenic strain carries the Ptprca and is denoted as CD45.1. BM was isolated from the donor mice (CD45.2), and the HSC populations were sorted as previously described.
To confirm the limit of detection of donor CD45.2 cells in the BM of CD45.1 mice, we performed a limited dilution analysis by flow cytometry using both mouse strains. The recipient and donor cells were mixed at several ratios (CD45.1:CD45.2 [0:100, 50:50, 90:10, 99.9:0.1, 99.99:0.01, 99.995:0.005, and 100:0]), incubated with CD45.1 (clone 104) and CD45.2 (clone A20) antibodies for 30 minutes, and analyzed by flow cytometry. As shown in supplemental Figure 4, the detection limit of CD45.2 BM cells in CD45.1 BM cells was 0.1% by flow cytometric analysis. Thus, in the following in vivo assays, mice were scored as positive if >0.1% of the total murine BM cells were CD45.2+.
Next, the sorted Flk2−CD34+ and Flk2−CD34− HSCs were then either left untreated or treated with 20 mM Dip A before IV injection into the recipient mice, as illustrated in Figure 6A. For transplantation, treated cells were suspended in PBS containing 10 mM of Dip A(+), while untreated cells were suspended in PBS alone and IV-injected into recipient mice. BM aspirates from recipient mice were collected over the short term, at 10, 18, and 30 days. As shown in Figure 6B, we detected a significant increase in engraftment in the mice that received the Dip A-treated Flk2−CD34− HSCs for 18 and 30 days after transplantation (*P = .03) (Figure 6B, right). In contrast, inhibition of CD26 had almost no effect on the engraftment of Flk2−CD34− HSCs compared with the respective untreated cells (Figure 6B, left). Representative flow cytometry plots are illustrated in Figure 6C, and the series of experiments are summarized in Table 1. Note that reciprocal experiments with CD45.1 donor transplanted to CD45.2 recipient mice showed the same results (data not shown).
![CD26 inhibition enhanced engraftment of Flk2−CD34− HSCs. (A) Flk2−CD34− LT-HSCs and Flk2−CD34+ ST-HSCs were isolated from the BM of donor mice (CD45.2), either treated with 5mM Dip A, a CD26 inhibitor, or left untreated and IV-injected into lethally irradiated recipient mice (CD45.1). Ten, 18, and 30 days after cell transplantation, BM aspirates from recipient mice were analyzed by flow cytometry to measure the percentage of donor cells (expressing CD45.2) found in recipient tissues. (B) Results of the engraftment of donor cells treated with Dip A [red] and control [blue] in the BM of recipient mice were determined at each time point for both the ST-HSCs (left panels) and the LT-HSCs (right panels). Data presented are the mean ± SD of >5 mice from each group at the different time points (*P = .02). (C) A representative analysis of donor cell engraftment for both ST-HSCs (left panel) and LT-HSCs (right panel) that were either treated with Dip A (red) or left untreated (blue).](https://ash.silverchair-cdn.com/ash/content_public/journal/bloodadvances/6/15/10.1182_bloodadvances.2022007465/4/m_advancesadv2022007465f6.png?Expires=1769090757&Signature=R-Nz-9KnKGFJ1etMPFck-ePfSk0yRX62Ge7bkhusBUCpPvKZiuTqsdtsEniS6ruKAaORL5a-YTEEjHHBEh23yh2v-zNuvhANqZiRC3Vg74LZpaItXKsABXB0vCpuWExYtrGXvcjDP~DTo58YjuYfCSE-JMFfjB2OC84nTtpBUaSlWMjlomWhee9lJ4~RJclb4dQOoHfH-46xAJBwowuQ81qkmku3DZzlGq7UDyDRuQ1ETEA8hBJNQzH3-dPBam2feBWS1yzIuUJEgkV~Ul9lSN4m7~SqVMt25lDo8UgOUZFVZDsNne9hg5lE2QpKsDyeZupmPvBamljy0FIGgQVUlA__&Key-Pair-Id=APKAIE5G5CRDK6RD3PGA)
CD26 inhibition enhanced engraftment of Flk2−CD34− HSCs. (A) Flk2−CD34− LT-HSCs and Flk2−CD34+ ST-HSCs were isolated from the BM of donor mice (CD45.2), either treated with 5mM Dip A, a CD26 inhibitor, or left untreated and IV-injected into lethally irradiated recipient mice (CD45.1). Ten, 18, and 30 days after cell transplantation, BM aspirates from recipient mice were analyzed by flow cytometry to measure the percentage of donor cells (expressing CD45.2) found in recipient tissues. (B) Results of the engraftment of donor cells treated with Dip A [red] and control [blue] in the BM of recipient mice were determined at each time point for both the ST-HSCs (left panels) and the LT-HSCs (right panels). Data presented are the mean ± SD of >5 mice from each group at the different time points (*P = .02). (C) A representative analysis of donor cell engraftment for both ST-HSCs (left panel) and LT-HSCs (right panel) that were either treated with Dip A (red) or left untreated (blue).
CD26 inhibition enhanced engraftment of Flk2−CD34− HSCs. (A) Flk2−CD34− LT-HSCs and Flk2−CD34+ ST-HSCs were isolated from the BM of donor mice (CD45.2), either treated with 5mM Dip A, a CD26 inhibitor, or left untreated and IV-injected into lethally irradiated recipient mice (CD45.1). Ten, 18, and 30 days after cell transplantation, BM aspirates from recipient mice were analyzed by flow cytometry to measure the percentage of donor cells (expressing CD45.2) found in recipient tissues. (B) Results of the engraftment of donor cells treated with Dip A [red] and control [blue] in the BM of recipient mice were determined at each time point for both the ST-HSCs (left panels) and the LT-HSCs (right panels). Data presented are the mean ± SD of >5 mice from each group at the different time points (*P = .02). (C) A representative analysis of donor cell engraftment for both ST-HSCs (left panel) and LT-HSCs (right panel) that were either treated with Dip A (red) or left untreated (blue).
Percentages of either Dip A-treated or untreated CD45.2 donor cells in CD45.1-recipient mice after transplantation
| Experiment, n | Cell*/treatment | Treatment | Mice, n | Days After Transplantation, % | ||
|---|---|---|---|---|---|---|
| 10 d | 18 d | 30 d | ||||
| 1 | Flk2−CD34+ | PBS | 2 | 5.3, 30 | 24, 50 | 18, 8 |
| Flk2−CD34+ | Dip A | 2 | 40, 19 | 60, 20 | 8, 40 | |
| Flk2−CD34− | PBS | 3 | 15, 19, 20 | 37, 55, 56 | 73, 88, 59 | |
| Flk2−CD34− | Dip A | 2 | 5, 15 | 42, 60 | 69, 68 | |
| 2 | Flk2−CD34+ | PBS | 3 | 2.7, 16, 3.7 | 5, 10.2, 70 | 34, 33.6, 31 |
| Flk2−CD34+ | Dip A | 5 | 1.4, 1.6, 2.7, 0.3, 2.3 | 10.9, 5, 3, 1.5, 11 | 22.7, 42.9, 5, 76, 18.9 | |
| Flk2−CD34− | PBS | 5 | 2.2, 4.3, 3, 1, 2 | 23, 10.3, 17, 70, 15 | 67, 39, 67, 69, 50 | |
| Flk2−CD34− | Dip A | 5 | 4, 3.5, 5, 45, 2 | 44.9, 68.3, 38, 6, 45 | 72, 79, 69, 64, 81 | |
| 3 | Flk2−CD34+ | PBS | 3 | 4, 10, 6 | 7, 11, 50 | 30, 39, 34 |
| Flk2−CD34+ | Dip A | 3 | 2, 1, 3 | 11, 4, 2 | 20, 32, 6 | |
| Flk2−CD34− | PBS | 3 | 3, 5, 4 | 21, 12, 18 | 50, 65, 62 | |
| Flk2−CD34− | Dip A | 3 | 6, 3, 4 | 40, 66, 32 | 70, 65, 75 | |
cell number = ∼800 to 1000.
Overall, these results suggest a strong association between CD26 expression and the engraftment of Flk2−CD34− HSCs. Compared with Flk2−CD34+ HSCs, the Flk2−CD34− HSCs express higher concentrations of CD26 and are more responsive to the Dip A inhibitor, which significantly improved their engraftment ability.
Fucosylation treatment plays a role in the long-term repopulation of Flk2−CD34+ HSCs
To determine the reliance of Flk2−CD34+ and Flk2−CD34− HSCs ability to engraft in the BM of recipient mice on E-selectin, we treated recipient mice with anti-E-selectin function-blocking Ab (clone 9A9) at 100 μg/mL before introducing the HSCs through IV. We assessed the engraftment efficiency at 2, 4, 8, and 12 weeks after transplantation, and as illustrated in supplemental Figure 5, blocking E-selectin significantly inhibited the engraftment efficiency of both Flk2−CD34+ (P = .31) and Flk2−CD34− (P = .04) HSCs with the greatest effect seen at 4 weeks after transplantation.
To study the engraftment potential of the BM-derived murine Flk2−CD34− and Flk2−CD34+ HSCs following enhancement of selectin-mediated binding using rhFTVI treatment, several experiments were performed that focused on both the short-term (<4 weeks) and long-term (>12 weeks) engraftment potential. Briefly, the cells were treated with rhFTVI before IV injection into recipient mice (CD45.1). Hematopoietic and blood cells were collected from the BM of the recipient mice at 5, 13, and 30 days after transplantation for short-term analysis, and 8, 12, and 16 weeks for long-term analysis and analyzed by flow cytometry to quantify the expression of CD45.1 and CD45.2 populations. As illustrated in Figure 7A, 5 days after transplantation, there were no detectable differences in the engraftment among mice that received either treated or untreated cells. However, starting as early as 2 weeks after transplantation, mice that received the rhFTVI-treated HSCs began to show an increase in engraftment efficiency. At 8 weeks after transplantation, a significant increase in engraftment was detected in rhFTVI Flk2−CD34+ HSCs (Figure 7B). Of note, the treated Flk2−CD34+ HSCs sustained and repopulated all the way to 16 weeks, while the untreated Flk2−CD34+ HSCs appeared to reach exhaustion as the percentage of donor cells decreased in recipient mice by 8 weeks after transplantation. These data suggest that rhFTVI treatment of Flk2−CD34+ HSCs prolonged their ability to repopulate primary recipient BM. Representative flow cytometry analysis of the donor cell engraftment in the recipient mice is illustrated in Figure 7C, and the series of experiments are summarized in Table 2.
![Fucosylation of Flk2−CD34− LT-HSCs and Flk2−CD34+ ST-HSCs improves engraftment in primary and secondary recipients differentially. Lethally irradiated Ly5.1 mice were transplanted with ∼500 to 1000 rhFTVI-treated (red) or buffer-treated (blue) Flk2−CD34+ (left panels in (A) and (B) or Flk2−CD34− (right panels in [A] and [B]) HSCs from Ly5.2 donor BM. BM from transplanted recipient mice was then investigated at the indicated (A) short-term periods and (B) longer-term periods for the percentage of donor cell contribution to total BM cells. Each data point represents the mean ± SEM (*P = .033, **P = .002, and ***P < .001). (C) A representative analysis of donor cell engraftment for both Flk2−CD34+ HSCs (left panel) and Flk2−CD34− HSCs (right panel), either buffer-treated (blue) or rhFTVI-treated (red), is shown. (D) Assessment of the contribution of donor cells to the blood lineage cells in the recipient mice following transplantation of buffer-treated and FTVI-treated Flk2−CD34+ and Flk2−CD34− in primary recipient mice. BM was first gated using flow cytometry for the donor cells (CD45.2), and further analysis for blood lineage phenotypes was assessed. For myeloid cells, granulocytes (Gr-1+ and CD11b+) and monocytes (Gr-1− and CD11b+) were assessed, and for lymphoid cells, B-cell (CD19) and T-cell (CD3) subsets were assessed. CD34 was used as a stem cell marker. All data presented are means ± SD of >5 mice from each group. (E) Flk2−CD34+ HSCs were collected from primary transplanted mice and transplanted into irradiated secondary recipients. At the indicated times following transplantation, BM was assessed for the percent of the donor cells in the recipient mouse, and statistical analysis was performed using the unpaired t test (*P = .033).](https://ash.silverchair-cdn.com/ash/content_public/journal/bloodadvances/6/15/10.1182_bloodadvances.2022007465/4/m_advancesadv2022007465f7.png?Expires=1769090757&Signature=k61JRuT4PRFEUtZavedCWoZFn0T~8VD-8-zsEOvXGoHefea8zO2SO4V-HGFTrS~oeWIuSYKsv7iJC9b5FRHHCAURfMnPxZTxvQv1Unr6RwL-mFZ~7RazPyNYCHpgbnQlSY8pWkvuV1PmNFHYXILhs~-0R141H1S-pr2lPy7lVrhLyzKnqD0YuQvUUvGQJ5Up-ulc0O5rAEFXPwSHtDAHvIQn0hlHTfR4jN-xVALP5ToD3RTWpqJUzZyUuX9-FJ8cu1gZH1xT~92WmlWH3UahUDqcUDUaQUFwpJRfQ3lHFoZClB3xnMSEnffV6n1h6tu0tKHPb0gbFFODyROeiuf8Gw__&Key-Pair-Id=APKAIE5G5CRDK6RD3PGA)
Fucosylation of Flk2−CD34− LT-HSCs and Flk2−CD34+ ST-HSCs improves engraftment in primary and secondary recipients differentially. Lethally irradiated Ly5.1 mice were transplanted with ∼500 to 1000 rhFTVI-treated (red) or buffer-treated (blue) Flk2−CD34+ (left panels in (A) and (B) or Flk2−CD34− (right panels in [A] and [B]) HSCs from Ly5.2 donor BM. BM from transplanted recipient mice was then investigated at the indicated (A) short-term periods and (B) longer-term periods for the percentage of donor cell contribution to total BM cells. Each data point represents the mean ± SEM (*P = .033, **P = .002, and ***P < .001). (C) A representative analysis of donor cell engraftment for both Flk2−CD34+ HSCs (left panel) and Flk2−CD34− HSCs (right panel), either buffer-treated (blue) or rhFTVI-treated (red), is shown. (D) Assessment of the contribution of donor cells to the blood lineage cells in the recipient mice following transplantation of buffer-treated and FTVI-treated Flk2−CD34+ and Flk2−CD34− in primary recipient mice. BM was first gated using flow cytometry for the donor cells (CD45.2), and further analysis for blood lineage phenotypes was assessed. For myeloid cells, granulocytes (Gr-1+ and CD11b+) and monocytes (Gr-1− and CD11b+) were assessed, and for lymphoid cells, B-cell (CD19) and T-cell (CD3) subsets were assessed. CD34 was used as a stem cell marker. All data presented are means ± SD of >5 mice from each group. (E) Flk2−CD34+ HSCs were collected from primary transplanted mice and transplanted into irradiated secondary recipients. At the indicated times following transplantation, BM was assessed for the percent of the donor cells in the recipient mouse, and statistical analysis was performed using the unpaired t test (*P = .033).
Fucosylation of Flk2−CD34− LT-HSCs and Flk2−CD34+ ST-HSCs improves engraftment in primary and secondary recipients differentially. Lethally irradiated Ly5.1 mice were transplanted with ∼500 to 1000 rhFTVI-treated (red) or buffer-treated (blue) Flk2−CD34+ (left panels in (A) and (B) or Flk2−CD34− (right panels in [A] and [B]) HSCs from Ly5.2 donor BM. BM from transplanted recipient mice was then investigated at the indicated (A) short-term periods and (B) longer-term periods for the percentage of donor cell contribution to total BM cells. Each data point represents the mean ± SEM (*P = .033, **P = .002, and ***P < .001). (C) A representative analysis of donor cell engraftment for both Flk2−CD34+ HSCs (left panel) and Flk2−CD34− HSCs (right panel), either buffer-treated (blue) or rhFTVI-treated (red), is shown. (D) Assessment of the contribution of donor cells to the blood lineage cells in the recipient mice following transplantation of buffer-treated and FTVI-treated Flk2−CD34+ and Flk2−CD34− in primary recipient mice. BM was first gated using flow cytometry for the donor cells (CD45.2), and further analysis for blood lineage phenotypes was assessed. For myeloid cells, granulocytes (Gr-1+ and CD11b+) and monocytes (Gr-1− and CD11b+) were assessed, and for lymphoid cells, B-cell (CD19) and T-cell (CD3) subsets were assessed. CD34 was used as a stem cell marker. All data presented are means ± SD of >5 mice from each group. (E) Flk2−CD34+ HSCs were collected from primary transplanted mice and transplanted into irradiated secondary recipients. At the indicated times following transplantation, BM was assessed for the percent of the donor cells in the recipient mouse, and statistical analysis was performed using the unpaired t test (*P = .033).
Percentages of CD45.2 donor cells in CD45.1-recipient mice after transplantation of murine HSC cells either treated with rhFTVI or with buffer alone
| Experiment, n | Cell*/treatment | Treatment | Mice, n | Days Post Transplantation, % | ||
|---|---|---|---|---|---|---|
| 10 d | 18 d | 30 d | ||||
| 1 | Flk2−CD34+ | HBSS | 2 | 5.3, 30 | 24, 50 | 18, 8 |
| Flk2−CD34+ | rhFTVI | 3 | 40, 15, 20 | 15.8, 20, 18.7 | 36, 37, 41 | |
| Flk2−CD34− | HBSS | 3 | 15, 19, 20 | 37, 55, 56 | 73, 88, 59 | |
| Flk2−CD34− | rhFTVI | 2 | 2, 20 | 10, 80 | 50, 68 | |
| 2 | Flk2−CD34+ | HBSS | 3 | 2.7, 16, 3.7 | 5, 10.2, 70 | 34, 33.6, 31 |
| Flk2−CD34+ | rhFTVI | 5 | 1, 2.9, 1, 1.3, 1.2 | 4, 10, 17, 3, 19.4 | 29, 31, 29, 23, 44.5 | |
| Flk2−CD34− | HBSS | 5 | 2.2, 4.3, 3, 1, 2 | 23, 10.3, 17, 70, 15 | 67, 39, 67, 69, 50 | |
| Flk2−CD34− | rhFTVI | 5 | 0.3, 3.3, 1.5 | 15, 8, 71 | 33, 27, 50 | |
| 3 | Flk2−CD34+ | HBSS | 9 | 6.3, 14.1, 55, 55, 33.5, 18, 21.6, 15.4, 14 | 11, 28.8, 12.8, 5.3, 6.4, 15, 17.1, 11.6, 4.1 | 3.2, 1, 2.4, 20, 0.9, 3.4, 1.8, 4, 3.8 |
| Flk2−CD34+ | rhFTVI | 8 | 10.1, 9.8, 4.5, 30, 15.3, 22, 4, 20 | 8.3, 35.5, 1, 27, 26.7, 9, 60.4, 20. 35.5 | 42, 10, 25, 1.5, 21.5, 2.2, 15, 16.1 | |
| Flk2−CD34− | HBSS | 8 | 35, 6.1, 10, 3.2, 13.1, 8, 44.6, 16.8 | 35, 67, 60.4, 69, 65, 9, 40, 58 | 65, 86.9, 70.9, 74,5, 75.7, 45.2, 70.4, 68.9 | |
| Flk2−CD34− | rhFTVI | 10 | 51, 1.5, 9.6, 50.9, 65.4, 6.3, 14.1, 55, 33.5, 31.5 | 59, 70, 62.7, 85.2, 67.4, 52, 50, 53.5, 80, 66 | 67.1, 63.1, 62.5, 63.1, 62.5, 74.4, 65.6, 71, 70.3, 62.5, 61.3, 70.2 | |
cell number = ∼800 to 1000.
To determine the types of blood lineage cells that resulted from the engraftment, peripheral blood was stained 8 weeks after transplantation for lineage markers of myeloid (granulocytes [Gr-1+ and CD11b+] and monocytes [Gr-1− and CD11b+]) and lymphoid (CD19 and CD3) lineages. As shown in Figure 7D and supplemental Figure 6, although statistically insignificant, Flk2−CD34+ HSCs resulted in greater numbers of lymphoid cells compared with Flk2−CD34− HSCs, in agreement with the previous study.43 Moreover, the fucosylation treatment of HSCs appeared to increase the numbers of myeloid lineage (granulocytes) cells compared with untreated cells in both HSC populations.
To test the effect that fucosylation treatment had on Flk2−CD34+ HSCs from primary recipients in long-term repopulation studies, secondary transplants were conducted. The HSCs were collected and sorted from the femur and tibia of primary transplanted mice (that had rhFTVI-treated or buffer-treated HSCs) and directly injected (ie, with no additional treatment) into irradiated secondary recipient mice. As shown in Figure 7E, the treated Flk2−CD34+ HSCs exhibited a significantly higher degree of donor repopulation in secondary mice compared with mice that were injected with buffer-treated cells where undetectable concentrations of engraftment were observed. The results of secondary recipient mice are summarized in Table 3. Furthermore, to investigate whether the observed enhancement in engraftment of these Flk2−CD34+ HSCs depends on E-selectin binding, we blocked E-selectin in the recipient mice using the function-blocking Ab (clone 9A9). Mice were treated with 100 μg/mL of the function-blocking Ab (or isotype control antibody) before introducing the ST-HSCs through IV that were either treated with rhFTVI or left untreated. As shown in supplemental Figure 7, the enhanced ability of fucosylated Flk2−CD34+ HSCs to persist in the BM was significantly reduced in the presence of the function-blocking E-selectin antibody at all time points tested. These data suggest that fucosylation alone was not sufficient to promote enhanced engraftment, and this enhancement requires E-selectin binding to the fucosylated Flk2−CD34+ HSCs.
Percentages of primary CD45.2 donor cells engrafted in a secondary recipient mouse after transplantation of murine ST-HSCs CD34+ HSCs cells treated with or without the rhFTVI
| Experiment, n | Cell*/treatment | Treatment | Mice, n | Percentage of Donor Cells in Recipient Mice (w), % | |||
|---|---|---|---|---|---|---|---|
| 2 w | 4 w | 8 w | 12 w | ||||
| 1 | Flk2−CD34+ | HBSS | 5 | 0, 0, 0, 0.2 | 0, 0, 0, 0.4, 0.4 | 0, 0, 0, 0.4, 0.4 | 0, 0, 0, 0, 0 |
| Flk2−CD34+ | rhFTVI | 5 | 6.8, 13.4, 6.3, 2.0, 3.2 | 2.7, 0.6, 1.2, 0.5, 3.0 | 0.5, 0.8, 1.2, 1.4, 11.3 | 2.7, 0, 15, 15.2, 0.2 | |
| 2 | Flk2−CD34+ | HBSS | 10 | 0, 0, 0, 0, 0.2, 0.2, 0, 0, 0, 0, | 0, 0, 0, 0, 0.2, 0.2, 0, 0, 0, 0, | 0, 0, 0, 0.3, 0, 0.2, 0, 0, 0, 0, | |
| Flk2−CD34+ | rhFTVI | 9 | 0.5, 8.0, 1.6, 1.1, 2.3, 0.4, 2.2, 0.2, 1.0 | 0.5, 8.0, 1.6, 1.1, 2.3, 0.4, 2.2, 0.2, 1.0 | 1.3, 0.2, 10, 2.4, 1.6, 6.8, 1, 1.1, 1 | ||
cell number = Experiment 1 was ∼800 to 1000, and Experiment 2 was ∼300 to 800.
Overall, these results provide evidence that fucosylation treatment of the ST-HSC population, Flk2−CD34+ HSCs, enabled these ST-HSCs to repopulate primary recipient mice for prolonged periods (>8 weeks) as well as to repopulate secondary recipient mice, a characteristic mainly reserved for LT-HSCs.43,44
Discussion
It is well established that E-selectin engagement promotes homing of HSCs during BM transplantation.12,19 In this study, we sought to elucidate and highlight the disparity in murine HSC populations, specifically the ST-HSCs CD34+ and LT-HSCs CD34−, in migration by characterizing their adhesion, homing, and engraftment using in vitro functional assays and in vivo hematopoietic transplantation models. Our results revealed that these murine HSC populations varied in their expression of essential homing molecules, their subsequent BM engraftment in vivo, and a very striking difference in their response to enhanced migration technologies.
Notably, all HSC activity has been shown to be contained within the Lin−Sca-1+c-Kit+ HSC compartment. The primitiveness of hematopoietic progenitors can be predicted on the basis of the combination of several surface phenotypes; however, only a fraction of the LSK population is believed to have long-term reconstitution capacity. These cells are crucial for sustaining life-long hematopoiesis and are required to produce mature myeloerythroid cells.2,45 CD34 was used as a marker for primitive HSCs until Osawa and colleagues2 found there are more primitive HSCs in the LSK CD34− fraction than the CD34+. The cell surface receptors Flk2 and CD34 were differentially expressed among functionally distinct progenitors, giving Flk2−CD34+ and Flk2−CD34− HSCs. We found both the Flk2 and CD34 markers were present in the Lin− fraction, as expected in agreement with previous reports.5,11,28 Although the existence of these populations has been demonstrated previously, this is the first study to our knowledge to investigate the adhesion mechanisms used by these 2 HSC populations to migrate in their native form in vitro and in vivo.
Results of flow cytometry showed that Flk2−CD34+ and Flk2−CD34− HSCs exhibited strikingly different expressions of sLex, the ligand for selectins. Although Flk2−CD34− HSCs showed low concentrations of sLex, these cells were able to enter the BM and engraft where E-selectin is constitutively expressed. However, this engraftment was significantly inhibited when E-selectin–blocking antibody was administered, indicating that E-selectin improves engraftment of both Flk2−CD34+ and Flk2−CD34− HSCs, which is in agreement with other studies that showed the effect of HSC hematopoiesis in E-selectin knockout mice.46,47 Double-deficient mice exhibited a high mortality rate when transplanted with limiting numbers of wild-type HSPCs (<107 cells per mouse) because of poor HSC homing and engraftment, which caused hematopoietic failure. Alternatively, the availability of either E- or P-selectin was sufficient to rescue the irradiated mice and culminate in successful hematopoietic reconstitution, indicating redundancy in function for endothelial selectins during HSC homing and engraftment.48 Furthermore, characterization of other factors required for homing and migration steps revealed both populations expressed similar concentrations of integrins, but the CXCR4 chemokine receptor concentrations were higher in Flk2−CD34+. In addition, the E-selectin ligand CD43 was expressed at significantly higher concentrations in Flk2−CD34+ HSCs, while 2 other E-selectin ligands, CD44 and PSGL-1, were expressed at similar concentrations in both populations. To fully investigate the disparity of homing-associated molecules between Flk2−CD34+ and Flk2−CD34− HSCs, we coupled the power of immunoprecipitation using E-Ig to identification using mass spectrometry.33,49 We detected a unique repertoire of ligands in each population but also found ligands that were in common. CD43 and several integrins were significantly identified in lysates of Flk2−CD34+ and they have both been described to contribute to HSC rolling on E-selectin and homing in BM.19,50,51 In contrast, Flk2−CD34− HSCs expressed different adhesion-related molecules. For example, Flk2−CD34− HSCs express vimentin, which plays a role as an intermediate filament critical to lymphocyte adhesion and transmigration.52 Interestingly, upon enforced fucosylation of neural stem cells, a neural cell adhesion molecule 1 variant, coined NCAM-E, was identified to bind E-selectin.24 Furthermore, extracellular matrix proteins including tenascin-C, thrombospondin-4, and fibronectin were also uncovered in the LT-HSC population. In particular, tenascin-C is described to play a critical role in the BM microenvironment.53 Tenascin-C is found in the periosteal region of the BM, filling the intersinusoidal spaces, and has been shown to be produced by adherent stromal cells such as CXCL-12–abundant reticular cells.54 In this context, the tenascin-C anchors HSCs and helps control their proliferation and maintenance.54 Tenascin-C has also been described to support the rolling of hematopoietic cells via unknown receptors.55,56 The current study suggests that E-selectin, either directly or indirectly, could mediate such binding. Our mass spectrometry analysis identified several candidates that might mediate the observed residual binding, and future studies can be conducted to investigate whether these candidates can function as plausible E-selectin ligands.
To further evaluate why such a difference in the sLex expression among HSCs exists, we analyzed the gene expression of the major enzymes involved in its synthesis. Since both fucosylation and sialylation of glycoproteins are essential for binding to selectins,57 we focused on these enzyme families. Our data indicate that the differential staining of sLex (HECA-452 antibody) among Flk2−CD34+ and Flk2−CD34− HSCs may be because of differential expression of glycosyltransferase genes. Our analysis of glycosyltransferases in the murine HSC populations revealed that although STs support the synthesis of sLex, all ST3Gal genes were expressed at higher concentrations in Flk2−CD34− HSCs and only 1 FT (FT4) was expressed at higher concentrations in Flk2−CD34− HSCs, while other FTs involved in sLex synthesis were expressed at low to undetectable concentrations in Flk2−CD34− HSCs. These data suggest that likely α2,3 sialylation is intact in Flk2−CD34− HSCs, but the expression of FT4 alone is not sufficient to express sLex, which is in line with previous studies.37 The expression of the enzymes doesn’t always permit the prediction that a structure (ie, sLex) would be formed since this is related to many factors, including the availability of sugar nucleotides, the relative location of the enzyme within the endoplasmic reticulum/Golgi, and modifications of the glycan products by naturally expressed glycosidases.29,58
Since sLex is critical in directing the first step of migration of stem cells to the BM, we hypothesized that its differential expression between Flk2−CD34− and Flk2−CD34− would affect their cellular migration in vivo. However, these differences in the determinants suggest engraftment of Flk2−CD34− HSCs to BM could be independent of the glycosylation of E-selectin ligands, as these HSCs can repopulate efficiently in their native state. These data are supported by studies that have shown that HL60 cells lacking sLex expression could still bind to E-selectin in in vitro rolling assays,59 suggesting that there may be sLex-independent mechanisms used by cells to bind E-selectin.
To augment the engraftment efficiency, we used cell surface fucosylation treatment. Previous work using rhFTVI to enhance sLex expression on cells that exhibit weak to no binding to E-selectin, such as CD34+ HSPCs,60 human mesenchymal stem cells,12 or neural stem cells,24 significantly improved the binding of cells to E-selectin to upwards of 90 − 95%. Similarly, following treatment with rhFTVI, most Flk2−CD34+ HSCs and Flk2−CD34− HSCs expressed sLex epitopes. Collectively, these results demonstrated the applicability of this ex vivo approach in murine HSCs. Moreover, in vivo analysis of these cells demonstrated that fucosylation treatment of Flk2−CD34+ ST-HSCs substantially improved their repopulation capacity sixfold in primary recipients up to 16 weeks after transplantation and fourfold in secondary transplants up to 12 weeks, in which undetectable engraftment was observed with mice receiving untreated Flk2−CD34+ HSCs. Studies showed the effect of fucosylation treatment alone on cellular proliferation; for example, overexpression of fucosyltransferase IV promoted cell proliferation and growth by controlling cell cycle progression via the MAPK(mitogen-activated protein kinase) and PI3K/Akt signaling pathways.61,62 Another study in A549-FUT4/6 cancer cells highlighted the role of fucosylation on EGFR (epidermal growth factor receptor) activation, especially in its dimerization and phosphorylation.63
Moreover, the inhibition of fucosylation in invasive ductal carcinoma of breast cancer reduced the activation of ERK1/2 and p38-MAPK.64 Further support from our laboratory that fucosylation contributes to alterations in signaling related to proliferation and growth comes from analysis of human mobilized CD34+ peripheral blood (unpublished data). About 70% of this population expresses sLex and binds E-selectin, and by enhancing their expression of sLex and subsequent E-selectin binding through fucosylation treatment, signaling pathways important for survival and cell cycle progression are triggered. This has recently been shown for leukemic stem cells, where those cells with a higher binding to E-selectin resulted in chemoresistance due to heightened survival signaling.65 Data outlined in this paper also illustrates the importance of E-selectin in mediating the enhanced engraftment of fucosylated Flk2-estimated glomerular filtration rate CD34+ HSCs using mice pretreated with function-blocking E-selectin antibodies. Our findings offer a new perspective that could suggest that control of fucosylation of HSCs could regulate cell cycle progression and state as well as decisions such as differentiation but needs further investigation.
Inhibition of CD26/DPPIV activity strongly increased the engraftment of HSCs in several studies.25,26,42 Interestingly, we found both Flk2−CD34+ HSCs and Flk2−CD34− HSCs exhibited similar degrees of CD26/DPPIV activity, despite expressing different concentrations of CD26. Previous studies showed differential CD26/DPPIV activities in cells expressing equal concentrations of CD26,66 and differential CD26 expression in cells with similar CD26/DPPIV activities.26 Notably, inhibition of CD26 with Dip A reduced CD26 activity in both HSC populations in vitro and significantly increased the engraftment of murine Flk2−CD34− HSCs. Thus, in addition to the difference in sLex expression, the CD26/DPPIV inhibition improved the migration of both ST-HSCs and LT-HSCs in vitro regardless of the differences in expression of CD26/DPPIV. This was further observed to enhance the engraftment of both populations in vivo with a pronounced significant difference with the LT-HSCs. Collectively, this study indicates that CD26/DPPIV may represent another main factor that determines the distinct homing and engraftment abilities of murine Flk2−CD34+ HSCs and Flk2−CD34− HSCs.
Conclusions
Overall, the present study offers novel insights into murine HSC-specific population differences in the adhesion effectors essential for cellular migration (see Graphical Abstract). Beyond these striking differences, we propose that CD26 inhibition could play an important role in LT-HSC engraftment efficiency, while fucosylation could significantly enhance the repopulation potential of ST-HSCs. Thus, enhancing the homing capabilities of HSCs could lead to prolonged and efficient HSC engraftment, which is crucial for patients suffering from hematological diseases such as leukemia.
Acknowledgments
The authors thank Simona Spinelli, Stefano Pietro, and Francesco Rottoli from the Animal Resource Core Laboratory (ARCL) facility at King Abdullah University of Science and Technology (KAUST), who were very helpful for animal-related studies and provided excellent training. Recombinant human FTVI was developed in a collaboration with Jae Man Lee and Takahiro Kusakabe during a Competitive Research Grant (OCRF-2014-CRG3-2276) from KAUST. Mass spectrometry was performed in Bioscience Core Laboratory facility at KAUST with the help of Huoming Zhang. The authors would like to thank Umm Habiba for her support in the management of the laboratory and thank the entire Cell Migration and Signaling Laboratory for their support and discussions.
This work was supported by a KAUST Faculty Baseline Research Funding Program to J.S.M.
Authorship
Contribution: A.S.A.-A . designed, performed, and analyzed experiments and wrote the manuscript; Y.L. conducted most of the in vivo work and mice-related works and contributed to discussing and analyzing the data; A.S.A.-A . and Y.L. contributed equally as joint first authors; A.A.-G. designed and performed gene expression work; H.A. characterized and performed the work related to CD26; I.I. performed the immunoprecipitation studies for mass spectrometry; L.E.E. helped in murine HSC sorting; D.B.A. established and characterized the initial experiments for bone marrow stem cells; and J.S.M. conceived, designed, and analyzed this study and wrote the manuscript.
Conflict-of-interest disclosure: The authors declare no competing financial interests.
Correspondence: Jasmeen S. Merzaban, 4700 King Abdullah University of Science and Technology (KAUST), Thuwal, Kingdom of Saudi Arabia, 23955-6900; e-mail: jasmeen.merzaban@kaust.edu.sa.

