

Key Points
Two biomarker algorithms that include only systemic inflammation biomarkers predicted response to steroid treatment but not 6-month NRM.
Two biomarker algorithms that include ≥1 biomarker of GI tissue damage predicted both response to treatment and 6-month NRM.

Abstract
We used a rigorous PRoBE (prospective-specimen collection, retrospective-blinded-evaluation) study design to compare the ability of biomarkers of systemic inflammation and biomarkers of gastrointestinal (GI) tissue damage to predict response to corticosteroid treatment, the incidence of clinically severe disease, 6-month nonrelapse mortality (NRM), and overall survival in patients with acute graft-versus-host disease (GVHD). We prospectively collected serum samples of newly diagnosed GVHD patients (n = 730) from 19 centers, divided them into training (n = 352) and validation (n = 378) cohorts, and measured TNFR1, TIM3, IL6, ST2, and REG3α via enzyme-linked immunosorbent assay. Performances of the 4 strongest algorithms from the training cohort (TNFR1 + TIM3, TNFR1 + ST2, TNFR1 + REG3α, and ST2 + REG3α) were evaluated in the validation cohort. The algorithm that included only biomarkers of systemic inflammation (TNFR1 + TIM3) had a significantly smaller area under the curve (AUC; 0.57) than the AUCs of algorithms that contained ≥1 GI damage biomarker (TNFR1 + ST2, 0.70; TNFR1 + REG3α, 0.73; ST2 + REG3α, 0.79; all P < .001). All 4 algorithms were able to predict short-term outcomes such as response to systemic corticosteroids and severe GVHD, but the inclusion of a GI damage biomarker was needed to predict long-term outcomes such as 6-month NRM and survival. The algorithm that included 2 GI damage biomarkers was the most accurate of the 4 algorithms for all endpoints.
Introduction
Hematopoietic cell transplant (HCT) cures a variety of hematologic disorders and malignancies, but its use is limited by acute graft-versus-host disease (GVHD), the major cause of post-HCT morbidity and nonrelapse mortality (NRM).1 GVHD is caused by systemic immune dysregulation and results in local tissue destruction of the skin, liver, and gastrointestinal (GI) tract.2 Maximum GVHD symptom severity, which can only be determined retrospectively, correlates well with response to treatment, NRM, and survival. The overall severity at diagnosis, however, is a poor predictor of longer-term outcomes.3
The need for an early and accurate risk stratification system that could inform treatment decisions at diagnosis led to the discovery of a number of GVHD serum biomarkers. Some of these biomarkers correlate with immunologic activation and systemic inflammation, such as tumor necrosis factor 1 (TNFR1),4,5 T-cell Ig mucin domain 3 (TIM3),4,6,7 interleukin 6 (IL6),4,8,9 interleukin 2 receptor α (IL2Rα),10,11 and IL8.12,13 Other biomarkers reflect damage by GVHD to target organs, such as elafin, a biomarker for skin GVHD,13,14 cytokeratin-1815 and hepatocyte growth factor (HGF) for liver GVHD,15 and suppressor of tumorigenesis 2 (ST2),16,17 and regenerating islet-derived 3 α (REG3α) for GI GVHD.18,19 Three markers of systemic inflammation (TNFR1, TIM3, and IL6) and the 2 markers of GI damage (ST2 and REG3α) have been validated by different laboratories to predict GVHD outcomes, both individually and in combination.4,6,9,20 ,, -25 TNFR1 is shed by cells upon binding of its proinflammatory ligand, TNFα.5,26 Circulating TIM3 affects the function of several cell lineages, including T cells, dendritic cells, and natural killer cells.7,27 IL6 promotes both B- and T-cell recruitment and activation.8,9,28,29 ST2 is released from several cell types upon damage to GI crypts.17 REG3α, a Paneth cell protein, promotes intestinal stem cell survival and regeneration of GI crypts.19
Combinations of biomarkers can predict long-term outcomes better than individual biomarkers,4,6,20,23 but an unbiased comparison of systemic and GI-specific biomarkers at the time of GVHD diagnosis has not yet been conducted. In this study, we used the rigorous approach of a PROBE (prospective-specimen collection, retrospective-blinded-evaluation) design30 to analyze a large number of serum samples obtained from patients before ascertainment of their GVHD outcomes to evaluate 5 biomarkers at the onset of GVHD, both individually and in combination, to predict NRM 6 months later. We generated the algorithms in a training cohort (n = 352) and then compared the strongest algorithms in an independent and more contemporaneous validation cohort (n = 378) that reflects current transplant practices.
Study design and oversight
First allogeneic HCT recipients from within MAGIC (Mount Sinai Acute GVHD International Consortium) were prospectively monitored for signs and symptoms of GVHD weekly through day 100 and then at a reduced frequency until 2 years after HCT (supplemental Table 1). GVHD severity at diagnosis was determined by MAGIC criteria31 and Minnesota risk classification.32 GVHD treatment and clinical response data were obtained prospectively for all patients, and patients were included in this study if a cryopreserved serum sample within 3 days of GVHD diagnosis was available and their clinical data were complete. Subjects in the training cohort from 1 of 11 centers (n = 352) underwent their first allogeneic HCT between May 2004 and October 2015. Validation cohort patients from 1 of 19 centers (n = 378) underwent HCT between November 2015 and April 2017 (supplemental Table 1). None of the patients in the validation cohort were used to create the previously published MAGIC algorithm.20 All patients, parents, or legal guardians provided informed consent on an institutional review board-approved protocol.
Biomarker determination and algorithm development
We used enzyme-linked immunosorbent assay to measure TNFR1, TIM3, IL6, ST2, and REG3α in serum samples per each manufacturer’s specifications using methodology as previously published16,18 with the following modifications: each well was precoated with 50 µl of capture antibody, washed with 200 µl of wash buffer, and blocked with 150 µl of reagent diluent (R&D Systems, Catalog # DY995) for TNFR1, TIM3, IL6, and ST2, and with Blotto blocking buffer (Fisher 37530) for REG3α. We used the following top standards: 1600 pg/mL for TNFR1, 8000 pg/mL for TIM3, 1200 pg/mL for IL6, and 4000 pg/mL for ST2. Samples were diluted as follows: 1:8 for TIM3/IL6, 1:20 for TNFR1/REG3α, and 1:40 for ST2. All samples and standards were run in triplicate with an incubation time of 1 hour while mixing on a digital microplate shaker set to 500 rpm. This incubation process was repeated after the addition of the detection antibody. We added 50 µl of 3,3′,5,5′-tetramethylbenzidine substrate (Thermo Scientific 34028) and 30 µl of 2N H2SO4 to each well to stop the reaction. Absorbance was measured using SpectraMax M5 from Molecular Devices. The concentrations of all biomarkers were expressed in picograms per mL except REG3α, which was expressed in nanograms per mL. All biomarker values were log-transformed for use in the algorithms.
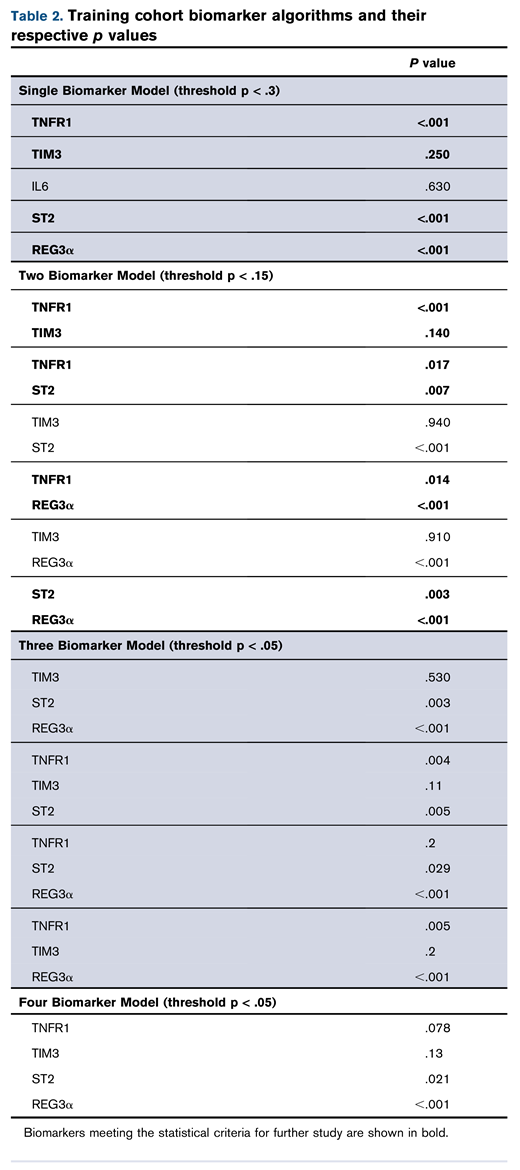
Competing risk regression that considered relapse and second transplant as competing risks was used in the training cohort to create biomarker algorithms to predict 6-month NRM from the time of diagnosis of GVHD. As the complexity of the algorithms increased, we applied stepwise forward regression and increasingly stringent thresholds of statistical significance to exclude biomarkers from further study, either individually or in combination. The significance threshold was P ≤ .3 for algorithms consisting of a single biomarker, P ≤ .15 for each biomarker within a 2 biomarker combination, and P ≤ .05 for each biomarker in a combination of 3 or 4 biomarkers. We also compared algorithms by Akaike’s Information Criterion (AIC) and included any algorithm for further study if its AIC was lower than the less complex parent, regardless of whether the significance threshold criteria were met.
We calculated the predicted probability of 6-month NRM as a value from 0.001 to 0.999 for individual patients in the training cohort for each of the algorithms and identified the threshold that maximized the product of sensitivity and specificity to stratify patients into high and low risk for NRM. In the event that multiple thresholds produced the same value, the threshold that maximized the difference in 6-month NRM between high- and low-risk groups was used for stratification. All algorithms were compared using data from the validation cohort.
NRM was defined as death within 6 months of GVHD onset from any cause other than relapse. Treatment response at day 28 of systemic therapy was defined as previously published33 : a complete response (CR) required resolution of all GVHD symptoms, and a partial response (PR) required improvement in all initially affected organs without worsening in any other organ and without initiation of second-line systemic therapy; all other responses were categorized as nonresponses (NR). Steroid-refractory GVHD was defined as GVHD that either did not respond to systemic steroids or that required additional lines of systemic treatment before day 28.34 Late-onset GVHD was defined as acute GVHD diagnosed after day 100 post-transplant.
Statistical methods
Patient characteristics between training and validation cohorts were compared using χ-squared or Wilcoxon rank-sum tests as appropriate. The area under the receiver operating characteristic curves was compared using DeLong’s test.35 Cumulative incidences of NRM and relapse were calculated using Fine and Gray’s method.36 Differences in cumulative incidences were compared using Gray’s test37 and differences in proportions by χ-squared tests. Overall survival was estimated by the method of Kaplan-Meier, and the differences between groups were compared using the log-rank test. P values were corrected for multiple comparison using Holm’s method.38 All analyses were performed using R statistical package version 4.0.3 (R Core Team 2020).
Results
Patient characteristics
The patient characteristics for the training and validation cohorts are shown in Table 1. Changes in transplant practices between the earlier training cohort (2004-2015) and the validation cohort (2015-2017) were reflected in increased percentages of patients in the validation cohort >60 years of age, increases in myelodysplastic or myeloproliferative syndrome as an indication for transplant, and increased use of reduced-intensity conditioning regimens, haploidentical donors, anti-thymocyte globulin, and posttransplant cyclophosphamide for GVHD prophylaxis. Despite the changes in clinical practices, there were no statistically significant differences in GVHD severity or target organ involvement at diagnosis and the proportion of cases treated with systemic corticosteroids between the 2 cohorts. However, the validation cohort experienced significantly more late-onset GVHD (9.3% vs 2.6%; P < .001), less grade III/IV GVHD at its peak severity (31.0% vs 38.4%; P = .043), and less 6-month NRM (13.8% vs 20.2%; P = .021).
Patient and transplant characteristics
| Training (n = 352) | Validation (n = 378) | P value | |
|---|---|---|---|
| Median Age, yr (range) | 53 (0-75) | 53.5 (0-74) | .520 |
| Age (yr), n (%) | .003 | ||
| <18 | 39 (11.1) | 56 (14.8) | — |
| 18-60 | 235 (66.8) | 206 (54.5) | — |
| >60 | 78 (22.1) | 116 (30.7) | — |
| Indication for HCT, n (%) | <.001 | ||
| Acute leukemia | 192 (54.5) | 196 (51.9) | — |
| MDS/MPS | 69 (19.6) | 111 (29.4) | — |
| Lymphoma | 44 (12.6) | 32 (8.5) | — |
| Nonmalignant | 12 (3.4) | 21 (5.5) | — |
| Other malignant | 35 (9.9) | 18 (4.7) | — |
| Conditioning intensity, n (%) | .003 | ||
| Myeloablative | 245 (69.6) | 222 (58.7) | — |
| Reduced intensity/nonmyeloablative | 107 (30.4) | 156 (41.3) | — |
| Donor type, n (%) | <.001 | ||
| Related | 99 (28.1) | 95 (25.1) | — |
| Unrelated | 245 (69.6) | 246 (65.1) | — |
| Haploidentical | 8 (2.3) | 37 (9.8) | — |
| HLA match, n (%) | <.001 | ||
| Matched | 257 (73.0) | 271 (71.7) | — |
| Mismatched | 87 (24.7) | 70 (18.5) | — |
| Haploidentical | 8 (2.3) | 37 (9.8) | — |
| GVHD serotherapy, n (%) | <.001 | ||
| ATG | 102 (29.0) | 159 (42.1) | — |
| No ATG | 250 (71.0) | 219 (57.9) | — |
| GVHD prophylaxis, n (%) | <.001 | ||
| CNI/MTX ± other | 204 (57.9) | 206 (54.5) | — |
| CNI/MMF ± other | 127 (36.1) | 87 (23.0) | — |
| Tacrolimus + sirolimus | 1 (0.3) | 10 (2.6) | — |
| Cyclophosphamide based | 17 (4.8) | 56 (14.8) | — |
| T-cell depletion | 1 (0.3) | 15 (4.0) | — |
| Other | 2 (0.6) | 4 (1.1) | — |
| Stem cell source, n (%) | .256 | ||
| Marrow | 52 (14.8) | 67 (17.7) | — |
| Peripheral blood | 267 (75.8) | 286 (75.7) | — |
| Cord | 33 (9.4) | 25 (6.6) | — |
| Diagnosis GVHD: median day (range) | 26 (7-273) | 28 (5-196) | <.001 |
| Late-onset GVHD, n (%) | 9 (2.6) | 35 (9.3) | <.001 |
| Diagnosis GVHD grade, n (%) | .920 | ||
| Grade I* | 150 (42.6) | 162 (42.8) | — |
| Grade II | 138 (39.2) | 147 (38.9) | — |
| Grade III | 54 (15.4) | 55 (14.6) | — |
| Grade IV | 10 (2.8) | 14 (3.7) | — |
| Minnesota risk at Dx, n (%) | .611 | ||
| Standard | 296 (84.1) | 324 (85.7) | — |
| High | 56 (15.9) | 54 (14.3) | — |
| Target organ involvement at Dx, n (%) | .285 | ||
| Skin only | 198 (56.3) | 202 (53.4) | — |
| Liver only | 2 (0.6) | 4 (1.1) | — |
| UGI only | 23 (6.5) | 36 (9.5) | — |
| LGI ± other target organ | 113 (32.1) | 110 (29.1) | — |
| Other combinations | 16 (4.5) | 26 (6.9) | — |
| Maximum GVHD Grade II-IV, n (%) | 277 (78.7) | 277 (73.3) | .105 |
| Maximum GVHD Grade III-IV, n (%) | 135 (38.4) | 117 (31) | .043 |
| 6-month NRM (%) | 20.2 | 13.8 | .021 |
| Maximum GVHD grade, n (%) | .138 | ||
| Grade I* | 75 (21.3) | 102 (27.0) | — |
| Grade II | 142 (40.4) | 159 (42.1) | — |
| Grade III | 73 (20.7) | 65 (17.2) | — |
| Grade IV | 62 (17.6) | 52 (13.8) | — |
| Treated with systemic corticosteroids, n (%) | 311 (88.4) | 323 (85.4) | .293 |
ATG, anti-thymocyte globulin; CNI, calcineurin inhibitor; Dx, diagnosis; LGI, lower GI; MDS, myelodysplastic syndrome; MMF, mycophenolate mofetil; MPS, myeloproliferative syndrome; MTX, methotrexate; UGI, upper GI.
Includes 1 patient with biopsy-proven liver GVHD and total bilirubin <2 mg/dl.
Algorithm creation and selection from the training cohort
We first created algorithms to predict 6-month NRM for 5 individual biomarkers (TNFR1, TIM3, IL6, ST2, and REG3α). All of these algorithms met the predetermined statistical criteria (P < .3) except for IL6 (Table 2). We next created all possible 2, 3, and 4 biomarker combinations of TNFR1, TIM3, ST2, and REG3α. Four of the six 2 biomarker algorithms (TNFR1 + TIM3, TNFR1 + ST2, TNFR1 + REG3α, and ST2 + REG3α) met the statistical criteria for further study (P < .15 for each biomarker), but none of the 3 or 4 biomarker algorithms did so (P < .05 for each biomarker) (Table 2). Their exclusion from further analysis was confirmed by their AIC (supplemental Table 2). We then established thresholds for risk stratification for the best 4 algorithms: TNFR1 + TIM3, TNFR1 + ST2, TNFR1 + REG3α, and ST2 + REG3α (supplemental Tables 3-6). Interestingly, only 1 of these algorithms did not include a GI-specific biomarker.
Algorithm comparison in the validation cohort
We next used the area under the curve (AUC) of the receiver operator characteristic curves to compare the predictive power of the 4 best algorithms in the validation cohort. The AUCs for the systemic inflammation biomarkers (TIM3, TNFR1, and IL6) were significantly lower than the AUCs for the GI-specific biomarkers ST2 and REG3α (P < .001) (supplemental Table 7). The AUC for the combination of the 2 systemic biomarkers TNFR1 + TIM3 (0.57) was significantly lower than all the other 2 biomarker combinations: TNFR1 + ST2 (0.70; P < .001), TNFR1 + REG3α (0.73; P < .001), or ST2 + REG3α (0.79; P < .001) (Figure 1). We applied the thresholds that maximized the product of sensitivity and specificity from the training cohort to divide the validation cohort into high- and low-risk strata. The sensitivity, specificity, positive predictive value (PPV), and negative predictive value (NPV) for each algorithm are shown in Table 3. The sensitivity, specificity, PPV, and NPV corresponding to a fixed specificity or sensitivity closest to 80% are shown in supplemental Tables 8 and 9. Specificity and PPV were highest for the algorithms that included ST2, and sensitivity and NPV were highest for the algorithms that included REG3α. As a result, the algorithm that contained only systemic biomarkers (ie, TNFR1 + TIM3) performed the worst, whereas the algorithm that combined both markers of GI damage (ie, ST2 + REG3α) performed the best with the highest PPV, NPV, and combination of sensitivity and specificity.
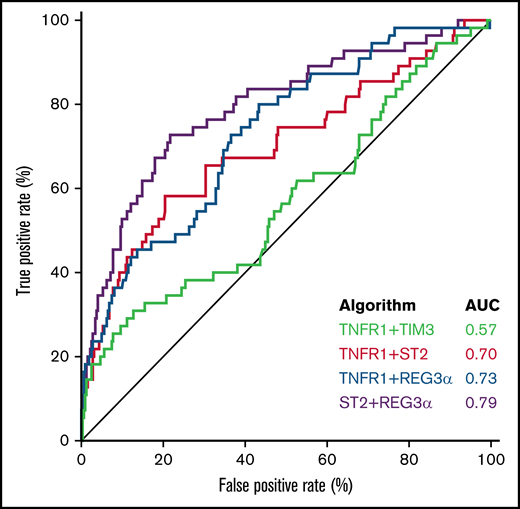
Receiver operator characteristic curves of 2 biomarker algorithms to predict 6-month NRM. The AUC for TNFR1 + TIM3 (0.57) was significantly lower than all the others: ST2 + TNFR1 (0.70; P < .001); REG3α + TNFR1 (0.73; P < .001); or ST2 + REG3α (0.79; P < .001). All algorithms were generated in the training cohort and then tested in the validation cohort.
Receiver operator characteristic curves of 2 biomarker algorithms to predict 6-month NRM. The AUC for TNFR1 + TIM3 (0.57) was significantly lower than all the others: ST2 + TNFR1 (0.70; P < .001); REG3α + TNFR1 (0.73; P < .001); or ST2 + REG3α (0.79; P < .001). All algorithms were generated in the training cohort and then tested in the validation cohort.
Algorithm performance characteristics in the validation cohort
| Sensitivity (%) | Specificity (%) | PPV (%) | NPV (%) | Threshold | |
|---|---|---|---|---|---|
| TNFR1 + TIM3 | 44.2 | 61.3 | 15.4 | 87.3 | 0.21 |
| TNFR1 + ST2 | 57.7 | 79.8 | 31.3 | 92.2 | 0.22 |
| TNFR1 + REG3α | 84.6 | 47.9 | 20.6 | 95.1 | 0.16 |
| ST2 + REG3α | 75.0 | 76.1 | 33.3 | 95.0 | 0.21 |
We then compared the response to treatment, NRM, and survival for the high- and low-risk groups generated by each algorithm. Patients with high-risk GVHD according to the algorithm TNFR1 + TIM3 were significantly less likely to respond to corticosteroid treatment by day 28 of treatment (59% vs 73%; P = .024), but they experienced the same NRM (15% vs 14%; P = .99) and survival (77% vs 83%; P = .237) as their low-risk counterparts (Figure 2A). In contrast, patients with high-risk GVHD as defined by the ST2 + REG3α algorithm were not only much less likely to respond to systemic steroids (51% vs 76%; P < .001), but were much more likely to experience NRM within 6 months (34% vs 6%; P < .001), and were much less likely to survive (60% vs 90%; P < .001) (Figure 2B). Algorithms that included 1 systemic biomarker (TNFR1) and either GI damage biomarker also produced risk strata with large differences in treatment response, 6-month NRM, and overall survival (Figure 2C-D), although the differences were not quite as large as those observed for ST2 + REG3α. These patterns remained unchanged for 12 months following the diagnosis of GVHD (supplemental Figure 1). Given the greater incidence of late-onset acute GVHD in the validation cohort, we also examined the performance of the ST2 + REG3α algorithm in this subset (n = 35). Patients with late-onset acute GVHD were divided nearly equally into high- (n = 17) and low-risk (n = 18) groups with similarly large differences in NRM again observed (42% vs 6%; P = .013).
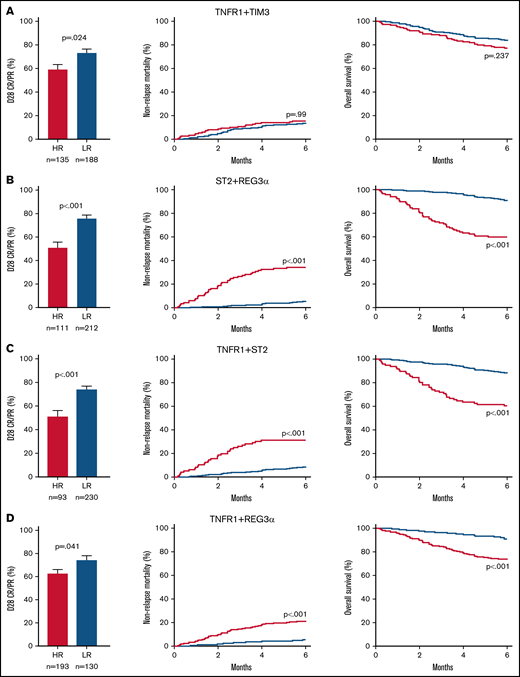
Long-term outcomes for risk groups in the validation cohort defined by 2 biomarker algorithms. We identified high-risk (HR; red) and low-risk (LR; blue) groups for patients in the validation cohort (n = 378) using optimal thresholds that we defined in the training cohort: (A) TNFR1 + TIM3, (B) ST2 + REG3α, (C) TNFR1 + ST2, and (D) TNFR1 + REG3α. Left panel: the proportion of steroid-treated patients with a CR or PR at day 28. Middle panel: cumulative incidence of 6-month NRM. Right panel: overall survival in the first 6 months.
Long-term outcomes for risk groups in the validation cohort defined by 2 biomarker algorithms. We identified high-risk (HR; red) and low-risk (LR; blue) groups for patients in the validation cohort (n = 378) using optimal thresholds that we defined in the training cohort: (A) TNFR1 + TIM3, (B) ST2 + REG3α, (C) TNFR1 + ST2, and (D) TNFR1 + REG3α. Left panel: the proportion of steroid-treated patients with a CR or PR at day 28. Middle panel: cumulative incidence of 6-month NRM. Right panel: overall survival in the first 6 months.
Analyses of other important outcomes (maximum grade III/IV GVHD and steroid-resistant GVHD) showed that all 4 algorithms produced highly statistically significant differences between risk groups, with smaller differences observed for the risk strata created by TNFR1+TIM3 (supplemental Figure 2). Importantly, there were no differences in relapse rates between high- and low-risk groups with any algorithm (supplemental Figure 3). Because posttransplant cyclophosphamide-based prophylaxis is increasingly used in clinical practice,39,40 we analyzed the 4 algorithms in this subset of validation cohort patients (n = 56). The algorithm of TIM3 + TNFR1 did not differentiate risk for NRM, while both algorithms containing ST2 did (supplemental Figure 4).
More than half of the patients in the validation cohort presented with clinical symptoms limited to the skin, so we next examined the performance of the ST2 + REG3α algorithm that reflects GI damage according to the symptoms present at diagnosis (Figure 3A-B; supplemental Table 10). These biomarkers divided patients presenting with lower GI GVHD symptoms (n = 110) into 2 similarly sized risk groups with a 12-fold difference in NRM (48% vs 4%; P < .001). But these biomarkers also identified a small group of patients with only skin symptoms at diagnosis (n = 202) as high risk with a threefold increase in NRM (17% vs 5%; P = .008).
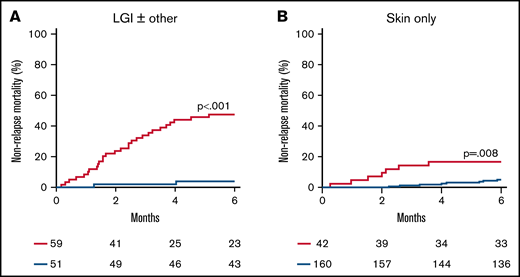
Cumulative incidence of 6-month NRM for risk groups defined by the ST2 + REG3α algorithm by presenting symptoms. We identified high-risk (HR; red) and low-risk (LR; blue) groups for patients who presented with (A) lower GI symptoms (n = 110) and (B) skin rash only (n = 202).
Cumulative incidence of 6-month NRM for risk groups defined by the ST2 + REG3α algorithm by presenting symptoms. We identified high-risk (HR; red) and low-risk (LR; blue) groups for patients who presented with (A) lower GI symptoms (n = 110) and (B) skin rash only (n = 202).
Discussion
The diagnosis of GVHD reflects the culmination of both systemic immune dysregulation and local tissue destruction and presents a clinical dilemma: symptom severity does not accurately predict response to treatment or long-term outcomes, so how aggressive should treatment be? One possible solution is to use accurate predictive biomarkers at the time of diagnosis to reduce the guesswork in making early treatment decisions. Biomarker research continues to evolve, but the best combination of markers of systemic inflammation and/or tissue damage has yet to be established. We used the rigorous standards of a PRoBE study design, including prospective sample collection, blinded ascertainment of patient outcomes, large sample sizes, and independent training and validation cohorts,30 to perform such an evaluation, focusing on 3 biomarkers of systemic inflammation (TNFR1, TIM3, IL6) and 2 biomarkers of GI damage (ST2 and REG3α).4,6,20
In this study, we found that an algorithm containing only biomarkers of systemic inflammation (TNFR1 + TIM3) identified patients at high risk for failure of systemic treatment by day 28 but was unable to predict NRM or survival 6 months later. In contrast, the algorithm that contained only biomarkers of GI damage (ST2 + REG3α) performed the best for both short and long-term outcomes. Algorithms that combined a biomarker of systemic inflammation (TNFR1) with either biomarker of GI damage (ST2 or REG3α) were also able to identify patients at high risk for poor long-term GVHD outcomes, although with less accuracy than the 2 GI biomarker algorithm. The ST2 + REG3α algorithm thus appears able to detect subclinical GI crypt damage in patients presenting only with skin symptoms (Figure 3), supporting its utility as a “liquid biopsy” of the GI tract. These results further support the hypothesis that GI tract inflammation and damage are key to the pathophysiology of acute GVHD and consistent with the widely accepted notion that GI GVHD is the primary driver of severe GVHD outcomes.32,41
The use of large patient cohorts from multiple centers around the world, the homogenization of GVHD grading and staging, a less biased approach to algorithm development, the use of independent training and validation cohorts, and validation in a contemporaneous cohort that better reflects current transplant practices all lend confidence to the robustness of these findings. Thus, this study has important implications, especially in the design of clinical trials of primary GVHD treatment. Algorithms that accurately risk-stratify patients can help all patients diagnosed with GVHD, regardless of clinical presentation. For example, patients identified as high risk for treatment failure and death may benefit from the addition of other agents, such as ruxolitinib or other promising drugs, to high-dose corticosteroid therapy upfront before resistance to treatment is manifested. This is especially important for patients with lower GI symptoms for whom the PPV of the ST2 + REG3α algorithm is nearly 50%. Trials currently testing such an approach include the addition of natalizumab, an inhibitor of T-cell trafficking to the GI tract (NCT02133924), or extracorporeal photopheresis (NCT04291261) to high-dose systemic corticosteroids as primary treatment. Conversely, such algorithms can help large numbers of patients at low risk for treatment failure and death. The NPV of the ST2 + REG3α algorithm is >95% for all patients, regardless of their clinical presentation. The vast majority of patients with skin-only disease are at low risk, and in fact, half of the patients with lower GI symptoms are also at low risk (Figure 3); these patients are almost certainly overtreated by the current standard of care. Studies currently testing such approaches include a trial of a JAK1 inhibitor (itacitinib) without systemic corticosteroid therapy (NCT03846479) and an expedited taper of systemic steroid treatments in pediatric patients (NCT05090384).
This study also has several limitations. First, our dataset did not permit analysis of some important long-term outcomes, such as the incidence or severity of chronic GVHD. Second, the validation cohort was not large enough to analyze subsets of particular interest, such as the recipients of HLA mismatched grafts. Third, the thresholds that we selected to separate high- and low-risk populations may not be relevant to some circumstances, such as when either the sensitivity or specificity should be maximized. Fourth, we excluded biomarkers with weaker prognostic evidence, such as IL2Rα, IL8, cytokeratin 18, HGF, and CXCL9.12,13,15,42 Elafin, a biomarker specific to skin GVHD, was excluded because it does not add value to the ST2 + REG3α algorithm.43 Amphiregulin, a marker of endothelial damage, has shown particular promise as a prognostic biomarker and may warrant inclusion in future studies.44-46 Fifth, our analysis did not include cellular subsets, which have recently been shown to predict the development of severe GVHD.42 Future algorithm development could also potentially include such predictors. Last, we recognize that elevated ST2 levels can be seen in other conditions that damage endothelial and mesenchymal tissue, such as cardiac disease,47,48 but in the context of GVHD, the major source of ST2 in the serum is the GI tract.17
In conclusion, clinical research trials in GVHD commonly use the response to treatment at day 28 as a primary endpoint because it can function as a surrogate for longer-term outcomes such as NRM or survival.33,49 However, early response is an imperfect measure of treatment effectiveness as other events such as loss of response or treatment-related complications can occur later and result in GVHD-related mortality. Powerful GVHD biomarker algorithms can quantify disease severity and predict long-term outcomes better than changes in clinical symptoms alone or combinations of both measures.22 These algorithms may prove useful in developing precision medicine for GVHD patients.
Acknowledgments
The authors thank the patients, their families, and the research staff for their participation, as well as Sigrun Gleich for coordinating the MAGIC database in Germany and Gilbert Eng for computer programming and database support.
This work was supported by the National Institutes of Health, National Cancer Institute (grant PO1CA03942), the Pediatric Cancer Foundation, and the German Jose Carreras Leukemia Foundation (grants DJCLS 01 GVHD 2016 and DJCLS 01 GVHD 2020).
Authorship
Contribution: A.E., U.Ö., J.L.M.F., and J.E.L. conceived and designed the study; A.E., N.S., J.S., F.A., J.B., C.C., Y.-B.C., H.C., Z.D., I.G., E. Hexner, W.J.H., E. Holler, U.K., C.L.K., S.K., M.A.M., P.M., A.P., M.A.P., M.Q., R.R., W.R., T.S., D.W., M.W., R.Y., and J.E.L. collected and reviewed the clinical data; S.G., G.M., and S.K. performed the laboratory analysis; N.S., J.-Y.L., G.V.H., and U.Ö. performed the statistical analysis; and A.E., J.L.M.F., and J.E.L. wrote the report.
The current affiliation for U.Ö. is Eli Lilly and Company, Indianapolis, IN.
Conflict-of-interest disclosure: U.Ö., J.L.M.F., and J.E.L. are co-inventors of a GVHD biomarkers patent and receive royalties from its licensure.
Correspondence: John Levine, The Tisch Cancer Institute, Icahn School of Medicine at Mount Sinai, 1 Gustave L. Levy Pl, Box 1410, New York, NY 10029; e-mail: john.levine@mssm.edu.

