

Key Points
Selective advantage induced by clonal hematopoiesis-associated mutation in Dnmt3a is specific to the HSC compartment.
Npm1 mutation alters chromatin accessibility in a cell-context and Dnmt3a mutation-dependent manner.

Abstract
In adult acute myeloid leukemia (AML), the acquisition of driver somatic mutations may be preceded by a benign state termed clonal hematopoiesis (CH). To develop therapeutic strategies to prevent leukemia development from CH, it is important to understand the mechanisms by which CH-driving and AML-driving mutations cooperate. Here, we use mice with inducible mutant alleles common in human CH (DNMT3AR882; mouse Dnmt3aR878H) and AML (NPM1c; mouse Npm1cA). We find that Dnmt3aR878H/+ hematopoietic stem cells (HSCs), but not multipotent progenitor cell (MPP) subsets, have reduced cytokine expression and proinflammatory transcriptional signatures and a functional competitive advantage over their wild-type counterparts. Dnmt3aR878H/+ HSCs are the most potent cell type transformed by Npm1cA, generating myeloid malignancies in which few additional cooperating somatic mutation events were detected. At a molecular level, Npm1cA, in cooperation with Dnmt3aR878H, acutely increased the accessibility of a distinct set of promoters in HSCs compared with MPP cells. These promoters were enriched for cell cycling, PI3K/AKT/mTOR signaling, stem cell signatures, and targets of transcription factors, including NFAT and the chromatin binding factor HMGB1, which have been implicated in human AML. These results demonstrate cooperativity between preexisting Dnmt3aR878H and Npm1cA at the chromatin level, where specific loci altered in accessibility by Npm1cA are dependent on cell context as well as Dnmt3a mutation status. These findings have implications for biological understanding and therapeutic intervention in the transformation from CH to AML.
Introduction
Recurrent somatic mutations originally identified in de novo adult acute myeloid leukemia (AML), including a missense mutation in the DNA methyltransferase DNMT3A (DNMT3AR882H/C),1 have been subsequently found in the benign state of aging-associated clonal hematopoiesis (CH/CHIP/ARCH).2-4 While CH has been reported to confer a ∼10-fold increased risk of development of hematologic malignancy,2,3,5 most individuals with CH will not develop AML. Thus, the predictive power of CH in assessing risk for hematologic malignancy is low. To develop better risk stratification and potentially new therapeutic approaches to prevent or intercept the development of AML, we need to understand the context in which and mechanisms by which CH can be transformed into AML.
Mutations in nucleophosmin (NPM1) are well documented as transformation events in de novo AML.6 The cell of origin giving rise to NPM1-mutant AML has long been a matter of debate. NPM1 mutations in AML samples can be found in multiple pools of stem and progenitor-like cells defined by CD34+ CD38− or CD34− CD38+ immunophenotypes, and these variably propagate disease in xenotransplant models.7,8 Examining the normal HSC compartment within NPM1-mutant AML patients has shown that HSCs occasionally9 but not always10 harbor coincident NPM1 mutations present in AML blasts. Taken together, previous studies suggest that there is not a single uniform cell type-of-origin for NPM1-mutant AML. However, inherent complexity and heterogeneity in human AML patient samples present a barrier to prospectively dissecting the mechanisms that dictate cell of origin.
Current proposed models of DNMT3A-mutant CH and progression to DNMT3A;NPM1-mutant AML posit that initiating DNMT3A mutations occur in an HSC and result in the generation of an expanded pool of HSCs and downstream progenitors within which NPM1 mutations are acquired and drive progression to AML.10 Here, we take advantage of our recently developed, orthogonally inducible murine models of DNMT3AR882H (murine Dnmt3aR878H/+) and NPM1c (murine Npm1cA/+)11 to prospectively examine cell of origin in a controlled model organism system.
Methods
Animals
C57BL/6J (000664), B6.SJL-PtprcaPepcb/BoyJ (“CD45.1”) (002014), Dnmt3afl-R878H/+ (032289), Mx1-Cre (003556), Npm1frt-cA/+ (033164), and Rosa26FlpoER (018906) mice were bred within The Jackson Laboratory (JAX). CD45.1/CD45.2 mice were F1 progeny of a C57BL/6J × CD45.1 cross. For Mx1-Cre induction, mice received 15 mg/kg pIpC (InvivoGen) by intraperitoneal injection every other day (5 times total). For FlpoER induction, mice received 125 mg/kg tamoxifen by oral gavage once daily (3× total). The JAX animal care and use committee approved all experiments.
Primary cell isolation and hematopoietic stem/progenitor cell phenotyping
Bone marrow (BM) mononuclear cells from femurs, tibiae, and iliac crests were isolated by Ficoll-Paque (GE Healthcare) and stained with fluorochrome-conjugated antibodies from eBioscience, BD Biosciences, or BioLegend: CD45.1 (clone A20), CD45.2 (clone 104), c-Kit (clone 2B8), Sca-1 (clone 108129), CD150 (clone TC15-12F12.2), CD48 (clone HM48-1), FLT3 (Clone A2F10), CD34 (clone RAM34), FcγR (clone 2.4G2), mature lineage (Lin) marker mix (B220 [clone RA3-6B2], CD11b [clone M1/70], CD4 [clone RM4-5], CD8a [clone 53-6.7], Ter-119 [clone TER-119], Gr-1 [clone RB6-8C5]), and the viability stain propidium iodide. Stained cells were sorted using a FACSAria, or analyzed on a LSR II or Symphony (BD) using the following profiles: HSC (Lin− Sca-1+ c-Kit+ Flt3− CD150+ CD48−), MPP (Lin− Sca-1+ c-Kit+ Flt3− CD150− CD48−), MPPG/M (Lin− Sca-1+ c-Kit+ Flt3− CD150− CD48+), MPPLy (Lin− Sca-1+ c-Kit+ Flt3+ CD48+), GMP (Lin− Sca-1− c-Kit+ CD34+ FcγRhi), and MEP (Lin− Sca-1− c-Kit+ CD34− FcγRlo).
4′-hydroxytamoxifen (4-OHT) dose response
HSC and GMP populations were isolated from Npm1frt-cA/+; Rosa26FlpoER or control Npm1+/+;Rosa26FlpoER mice. For cell viability, 10 000 Npm1+/+ GMPs were plated with 0, 10, or 20 μM 4-OHT (Sigma) in Iscove's Modified Dulbecco's Medium (IMDM) plus 100 ng/mL SCF, 100 ng/mL interleukin-6 (IL-6), and 100 ng/mL IL-3 in IMDM + 10% fetal bovine serum (FBS). After 2 hours or 24 hours, the full contents of each well were harvested and counted with trypan blue viability stain. For allele recombination, 1000 Npm1frt-cA/+ HSCs were plated with 10 or 20 μM 4-OHT in StemSpan (StemCell Technologies) plus 100 ng/mL SCF, 200 ng/mL TPO, 100 ng/mL IGF2, and 100 ng/mL FGF. In parallel, 10 000 Npm1frt-cA/+ GMPs were plated with 10 or 20 μM 4-OHT in the media described above. After 2 hours or 24 hours, DNA extraction was performed using a DNeasy Blood & Tissue Kit (Qiagen) and Npm1 allele recombination polymerase chain reaction (PCR) as previously described.11
In vivo transplantation
For competitive transplant, 200 HSCs, 200 MPP cells, or 400 MPPG/M cells were sorted from Dnmt3aR878H/+;Mx1-Cre and CD45.1/CD45.2 mice, pooled at a 1:1 ratio, and IV-injected into recipient CD45.1 mice after 1000 rads irradiation (split dose, 3 hours apart). For secondary transplant, 2 × 10⁶ BM cells from primary recipients were IV-injected into individual CD45.1 recipient mice after 1200 rads irradiation (split dose). For noncompetitive transplant, 1000 HSCs, 5000 MPPG/M cells, 5000 MEP cells, and 7000 to 10 000 GMP cells were sorted into separate wells containing 10 μM 4-OHT. For HSC, MPPG/M, and MEP cells, culture media contained 100 ng/mL SCF, 200 ng/mL TPO, 100 ng/mL IGF2, and 100 ng/mL FGF in StemSpan. For GMP cells, culture media contained 100 ng/mL SCF, 100 ng/mL IL-6, and 100 ng/mL IL-3 in IMDM + 10% FBS. After 24 hours, the contents of each well were IV injected into recipient CD45.1 mice after 1000 rads irradiation (split dose). In all transplants, peripheral blood (PB) samples were assessed by flow cytometry using a cocktail of CD45.1, CD45.2, B220, CD3e (clone 145-2C11), Ly6g (clone 1A8), and Ly6c (clone HK1.4) antibodies. At the end of the transplant, BM samples were assessed using the antibody cocktail described above for hematopoietic stem/ progenitor cells.
Analysis of moribund mice
Mice with declining health status were sacrificed, and PB, spleen, liver, and BM were harvested. Complete blood counts were obtained from PB, and blood smears stained with Wright’s Giemsa. Cytospin preparations of whole BM mononuclear cells were stained with May-Grunwald Giemsa stain. Liver and spleen samples were fixed for 24 hours in 10% buffered formalin phosphate, embedded in paraffin, and sections stained with H&E. Images were captured on a Nikon Eclipse Ci upright microscope with SPOT imaging software (v.5.6). Histological assessment and diagnosis were performed independently by 2 individuals in a blinded manner.
RNA sequencing (RNA-Seq)
Two thousand HSCs, MPP, MPPG/M, and MPPLy cells were fluorescence-activated cell sorting (FACS) sorted from independent biological replicate Dnmt3afl-R878H/+;Mx1-Cre or Dnmt3a+/+;Mx1-Cre mice directly into RLT buffer (Qiagen) and flash frozen. Total RNA was isolated using the RNAeasy Micro Kit (Qiagen) and assessed using a Nanodrop 2000 spectrophotometer (Thermo Scientific) and RNA 6000 Pico LabChip assay (Agilent Technologies). Libraries were prepared using the Ovation RNA-seq System V2 (NuGen) and Hyper Prep Kit (Kapa Biosystems). Library quality and concentration were evaluated using D5000 ScreenTape assay (Agilent) and quantitative PCR (Kapa Biosystems). Libraries were pooled and sequenced 75 bp single end on the NextSeq (Illumina) using NextSeq High Output Kit v2 reagents at a sequencing depth of >30 million reads per sample. Trimmed alignment files were processed using RNA-Seq by Expectation Maximization (RSEM) (v1.2.12). Alignment was completed using Bowtie 2 (v2.2.0). Expected read counts per gene produced by RSEM were rounded to integer values, filtered to include only genes that have at least 2 samples within a sample group having a cpm >1, and were passed to edgeR (v3.14.0) for differential expression analysis. The generalized linear model likelihood ratio test was used for differential expression in pairwise comparisons between sample groups which produced exact P values per test. The Benjamini and Hochberg’s algorithm (P value adjustment) was used to control the false discovery rate (FDR). Features with FDR-adjusted P value < .05 were declared significantly differentially expressed.
Assay for transposase-accessible chromatin with high-throughput sequencing (ATAC-Seq)
HSCs and MPPG/M cells were sorted and transposed for ATAC library preparation adapted from Buenrostro and colleagues.12 Briefly, nuclei were prepared, DNA was transposed and purified, followed by PCR amplification. ATAC-seq libraries were evaluated for quality and concentration using the High Sensitivity DNA Assay (Agilent Technologies) and KAPA Library Quantification Kit (Roche Sequencing and Life Science), respectively, according to the manufacturers’ instructions. Libraries were pooled and sequenced 75 bp paired-end on the HiSeq 4000 (Illumina) using HiSeq 3000/4000 SBS Kit reagents (Illumina). FASTQ files per each sample were initially analyzed with easy-to-use systematic pipeline for ATAC-seq data analysis (esATAC) v1.12.0 under R v3.6.0 using the mm10 reference genome. Read counts were extracted from peak call and alignment data using DiffBind v2.12.0. edgeR v3.26.4 was used to calculate differential binding of the trimmed mean of the M-values–normalized counts. If a region did not have at least 1 sample with cpm >1, the region was omitted from the pairwise comparison’s differential analysis. The negative binomial conditional common likelihood was maximized to estimate a common dispersion value across all features/regions. Exact tests were used to elucidate statistical differences between the 2 sample groups of negative binomially distributed counts producing P values per test. The Benjamini and Hochberg’s algorithm (P value adjustment) was used to control the FDR. Features with an FDR-adjusted P value < .05 were declared statistically significant. Differential binding results were annotated using HOMER v4.10.
M-impact
Genomic DNA underwent targeted capture and deep sequencing within the Memorial Sloan Kettering Cancer Center (MSKCC) Integrated Genomics Operation Core using the MSK M_IMPACT (mouse Integrated Mutation Profiling of Actionable Cancer Targets) assay. Mouse genomic DNA was used for library construction with molecular barcoding of each sample before capture and sequencing. Pooled libraries were sequenced paired-end 125 bp reads on an Illumina HiSeq with 500× coverage. Sequencing analysis was performed by the MSKCC Bioinformatics Core. FASTQ files were mapped to the mouse reference genome mm10 using Burrows-Wheeler Aligner v0.7.12. The resulting files were sorted, grouped, and PCR duplicates identified by MarkDuplicates in PICARD Tools (v1.124). BAM files were processed through GATK (genomic analysis toolkit) toolkit (v3.2) to perform variant calling in tumor-vs-normal paired mode. Variant allele frequency was determined by calculating the fraction of variant reads for a specific count out of the total reads at that location.
Statistical analysis
Statistical analysis was performed by unpaired Student t test or two-way ANOVA followed by uncorrected Fisher’s least significant difference. Statistics for survival curves were performed by log-rank Mantel-Cox test. All statistical tests were performed using Prism 8 software (GraphPad).
Results
Dnmt3aR878H/+ preserves molecular self-renewal programs selectively in HSCs
First, we asked which cell type(s) within the adult hematopoietic stem and progenitor cell compartment would incur transcriptional alterations due to Dnmt3aR878H expression. We administered polyI:C to induce Mx-Cre recombinase in control or Dnmt3afl-R878H/+ mice, and 6 weeks later, prospectively isolated HSCs, MPP, MPPG/M, and MPP4Ly cells for RNA-seq, based on a recently established consensus cell surface phenotyping scheme for MPP isolation13 (Figure 1A). All 4 of these populations were isolated from the same individual mice (n = 3 to 4 biological replicates). We validated the enrichment of these cell populations by verifying transcript expression of key cell surface markers used for prospective isolation, such as enrichment of Slamf1 (CD150) and Ctnnal1 (α-catulin) in HSCs, depletion of Cd34 (CD34) in MPPs, enrichment of Cd48 in MPPG/M and MPP4Ly cells, and enrichment of Flt3 in MPP4Ly cells (supplemental Figure 1A). To provide greater insight into the differences between Dnmt3aR878H/+ and Mx-Cre control HSCs, we incorporated a previously generated dataset of HSCs from non–polyI:C-treated, wild-type young C57BL/6 mice.14 Using principal component analysis, we found that Dnmt3aR878H/+ HSCs cluster in a position spatially proximal to wild-type HSCs, whereas the Mx-Cre control HSCs clustered distally to these groups (Figure 1B). In addition, we observed highly similar expression patterns between Dnmt3aR878H/+ and Mx-Cre control MPP, MPPG/M, and MPP4Ly cell types. We identified 412 significantly differentially expressed genes in Dnmt3aR878H/+ vs Mx-Cre control HSCs, the majority of which were more highly expressed in Mx-Cre controls (Figure 1C). These included myeloid differentiation genes such as Elane and Mpo, which were most highly expressed in the MPPG/M compartment (supplemental Figure 1B) and exhibited increased expression in Mx-Cre control vs wild-type HSCs, but not in Dnmt3aR878H/+ HSCs (supplemental Figure 1C). In addition, Cd53 was expressed at a similar level across the stem and progenitor cell subsets but was specifically increased in Mx-Cre control vs wild-type HSCs (supplemental Figure 1B,C). We observed that Prg2, which was recently shown by Katherine King’s group to be resistant to interferon induction in Dnmt3a−/− HSCs using a chronic mycobacterial infection model,15 was specifically increased in Mx-Cre control vs wild-type HSCs but not in Dnmt3aR878H/+ HSCs (supplemental Figure 1B-C).
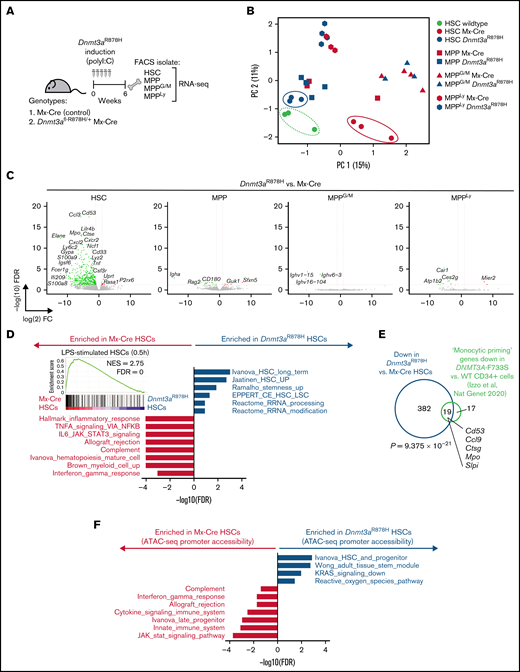
Dnmt3aR878H/+ reduces proinflammatory transcriptional programs, specifically in HSCs. (A) Experimental design. (B) Principal component analysis of RNA-seq data from Dnmt3aR878H/+ and Mx-Cre control cell types as well as C57BL/6 HSCs (n = 3 to 4 biological replicate mice per condition). (C) Volcano plots of differential gene expression in Dnmt3aR878H/+ vs Mx-Cre control cell types. Significant differential expression (FDR <0.05) is indicated by colored dots; green dots (left side of each plot) represent genes lower in expression in Dnmt3aR878H/+ vs control cells, and red dots (right side of each plot) represent genes higher in expression in Dnmt3aR878H/+ vs control cells. (D) Gene signatures significantly enriched in Mx-Cre control (gray) or Dnmt3aR878H/+ (navy) HSCs. (inset) Enrichment of a lipopolysaccharide-stimulated HSC signature16 in control vs Dnmt3aR878H/+ HSCs. (E) Venn diagram of overlapping downregulated genes in mouse Dnmt3aR878H/+ vs control HSCs with downregulated “Monocytic Priming” genes in human DNMT3A-F733S vs wild-type CD34+ cells.41 P value calculated using a hypergeometric test. (F) Gene signatures significantly enriched in accessible promoters of Mx-Cre control (gray) or Dnmt3aR878H/+ (navy) HSCs.
Dnmt3aR878H/+ reduces proinflammatory transcriptional programs, specifically in HSCs. (A) Experimental design. (B) Principal component analysis of RNA-seq data from Dnmt3aR878H/+ and Mx-Cre control cell types as well as C57BL/6 HSCs (n = 3 to 4 biological replicate mice per condition). (C) Volcano plots of differential gene expression in Dnmt3aR878H/+ vs Mx-Cre control cell types. Significant differential expression (FDR <0.05) is indicated by colored dots; green dots (left side of each plot) represent genes lower in expression in Dnmt3aR878H/+ vs control cells, and red dots (right side of each plot) represent genes higher in expression in Dnmt3aR878H/+ vs control cells. (D) Gene signatures significantly enriched in Mx-Cre control (gray) or Dnmt3aR878H/+ (navy) HSCs. (inset) Enrichment of a lipopolysaccharide-stimulated HSC signature16 in control vs Dnmt3aR878H/+ HSCs. (E) Venn diagram of overlapping downregulated genes in mouse Dnmt3aR878H/+ vs control HSCs with downregulated “Monocytic Priming” genes in human DNMT3A-F733S vs wild-type CD34+ cells.41 P value calculated using a hypergeometric test. (F) Gene signatures significantly enriched in accessible promoters of Mx-Cre control (gray) or Dnmt3aR878H/+ (navy) HSCs.
Using gene set enrichment analysis of Mx-Cre control vs Dnmt3aR878H/+ HSCs, we found that control HSCs were enriched for myeloid differentiation, cytokine signaling, and innate immune response signatures, whereas Dnmt3aR878H/+ HSCs were enriched for stem cell and self-renewal–associated signatures (Figure 1D). Furthermore, we found that a published LPS-treated HSC gene signature16 was enriched in control vs Dnmt3aR878H/+ HSCs (Figure 1D, inset). This finding is consistent with the observation that Dnmt3a−/− HSCs have reduced transcriptional response to interferon stimulation and that polyI:C treatment provides an additional selective pressure favoring expansion of Dnmt3a−/− HSCs.15 In addition, we compared our differentially expressed gene list to a “monocytic priming” gene signature identified as a decreased expression in human DNMT3A-R773S vs wild-type CD34+ hematopoietic stem and progenitor cells in a DNMT3A-mutant CH carrier (Izzo and colleagues, Nat Genet 2020). We found a significant overlap between these gene sets (P = 9.375 × 10⁻²¹ by hypergeometric test) (Figure 1E), supporting the relevance of transcriptional alterations in our model to human DNMT3A-mutant CH. Together, our data suggest that (1) very few genes are differentially expressed as an immediate-early consequence of Dnmt3aR878H in MPP, MPPG/M, and MPP4Ly cells, and (2) Dnmt3aR878H HSCs have reduced transcriptional alterations in response to polyI:C treatment and/or Mx-Cre expression compared with control HSCs.
To further refine the molecular mechanisms driving these transcriptional differences in Dnmt3aR878H/+ HSCs, we performed ATAC-seq on MxCre control and Dnmt3aR878H/+ HSCs that had been induced by polyI:C at 8 weeks before harvest (detailed schematic shown in Figure 4A). Focusing on promoter accessibility changes in control vs Dnmt3aR878H/+ HSCs, we found similar enrichment to our transcriptional pathway analysis in Figure 1D, including enrichment of cytokine signaling, innate immune system, and JAK/STAT signaling signatures in promoters with increased accessibility in control HSCs, whereas promoters with increased accessibility in Dnmt3aR878H/+ HSCs were enriched in stem cell and self-renewal–associated signatures (Figure 1F). Our data support that changes in promoter accessibility caused by the Dnmt3aR878H mutation are aligned at a pathway level with transcriptional patterns specific to Dnmt3aR878H/+ HSCs.
Dnmt3aR878H/+ confers a sustained functional advantage, specifically in HSCs
We next tested the functional consequences of Dnmt3aR878H in subsets of hematopoietic stem and progenitor cells by competing them against their wild-type counterparts in vivo. We transplanted purified polyI:C-treated Dnmt3aR878H/+ HSCs, MPP, and MPPG/M cells in a 1:1 ratio with wild-type HSCs, MPP, or MPPG/M cells into lethally irradiated recipients (Figure 2A). In the PB of primary transplant recipients, we observed decreased engraftment of Dnmt3aR878H/+ HSCs and MPP cells compared with their wild-type counterparts and no difference in engraftment of Dnmt3aR878H/+ MPPG/M cells (Figure 2B; supplemental Figure 2A). However, at the end of the transplant period, we found that Dnmt3aR878H/+ HSCs had higher engraftment of the BM compared with wild-type HSCs (Figure 2C). This was specific to HSCs, as transplanted Dnmt3aR878H/+ MPP and MPPG/M cells did not have a selective advantage over their wild-type counterparts in the BM. To evaluate the self-renewal and stem cell function of Dnmt3aR878H/+ HSCs, we performed secondary transplantation and found that Dnmt3aR878H/+ HSCs sustained higher engraftment in secondary transplant recipients assessed both in the PB and BM compared with wild-type HSCs (Figure 2D-E; supplemental Figure 2B). This is consistent with previous reports that Dnmt3a−/− HSCs gain a selective advantage over wild-type HSCs by enhancing self-renewal at the expense of differentiation.17 Our data demonstrate that Dnmt3aR878H/+ provides a sustained selective advantage specific to HSCs.
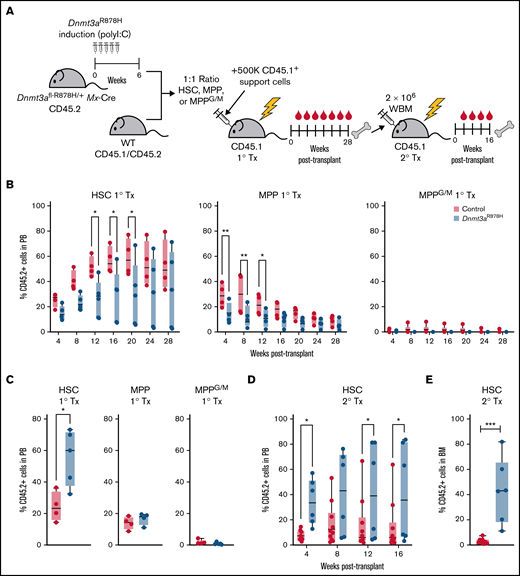
Dnmt3aR878H/+ confers a fitness advantage selectively in HSCs. (A) Experimental design. (B) Frequency of donor-derived cells in PB of mice transplanted with wild type and Dnmt3aR878H/+ HSCs, MPP, or MPPG/M cells (n = 4 to 5 per condition). (C) Frequency of donor-derived cells in BM of primary transplant recipients at 28 weeks. (D) Frequency of donor-derived cells in PB of secondary transplant recipient mice (n = 5 to 8 per condition). (E) Frequency of donor-derived cells in BM of secondary transplant recipient mice. Dots represent individual mice, bars show minimum to maximum. *P < .05, **P < .01, and ***P < .001 by 2-way ANOVA or unpaired t test.
Dnmt3aR878H/+ confers a fitness advantage selectively in HSCs. (A) Experimental design. (B) Frequency of donor-derived cells in PB of mice transplanted with wild type and Dnmt3aR878H/+ HSCs, MPP, or MPPG/M cells (n = 4 to 5 per condition). (C) Frequency of donor-derived cells in BM of primary transplant recipients at 28 weeks. (D) Frequency of donor-derived cells in PB of secondary transplant recipient mice (n = 5 to 8 per condition). (E) Frequency of donor-derived cells in BM of secondary transplant recipient mice. Dots represent individual mice, bars show minimum to maximum. *P < .05, **P < .01, and ***P < .001 by 2-way ANOVA or unpaired t test.
Dnmt3aR878H/+ HSCs are the most potent cell of origin transformed by Npm1c mutation
In murine models, the Npm1c mutation has been found to be a leukemia-driving allele in part through conferring self-renewal capacity onto myeloid progenitor cell populations.18,19 We next asked which stem or progenitor cell subsets with preexisting Dnmt3a mutation could be transformed by Npm1cA. To induce Npm1cA in a precise, cell context-specific manner, we isolated HSCs, MPPG/M cells, and 2 committed progenitor cell populations (megakaryocyte-erythroid progenitors [MEPs] and GMPs) from individual Dnmt3aR878H/+ mice treated with 4-OHT over 24 hours ex vivo to activate the Npm1 mutation, then transplanted cells back into individual recipient animals along with a radioprotective dose of BM support cells and followed until moribund (Figure 3A). We experimentally determined the dose and timing of 4-OHT to preserve cell viability (supplemental Figure 3A) while maximizing the recombination efficiency of the Npm1 allele (supplemental Figure 3B). These experiments were initiated from starting cell numbers that we routinely isolate from individual mice and are proportional to the abundance of these populations in the BM; 1000 HSCs (n = 5), 5000 MPPG/M cells (n = 3), 5000 MEP cells (n = 6) and 7000 to 10 000 GMP cells (n = 5). We found that mice receiving Dnmt3aR878H/+;Npm1cA HSCs had fully penetrant disease development and statistically shorter overall survival than mice receiving MEP or GMP cells (Figure 3B). Mice transplanted with MPPG/M cells had a disease penetrance and survival that appeared intermediate between HSCs and MEP/GMP cells, although due to the low number of animals in this group, this cannot be rigorously statistically evaluated. All moribund mice were diagnosed with either myelodysplasia (MDS), myeloproliferative disorder (MPD), or acute myeloid leukemia (AML) based on complete blood counts, spleen weight, and blinded histological assessment of blood, BM, liver, and spleen (Figure 3C). We did not detect trends in disease states associated with different cell types, although our study was not statistically powered to assess differences at this level. In independent experiments evaluating Npm1cA as a single mutation (supplemental Figure 3C), we found that mice receiving Npm1cA–mutant-only MPPG/M had fully penetrant disease development and statistically shorter overall survival compared with mice receiving HSC, MEP, or GMP cells (supplemental Figure 3D), and moribund mice developed a spectrum of MDS, mixed MDS/MPD, MPD, and AML phenotypes (supplemental Figure 3E). In independent experiments evaluating disease development in mice transplanted with Dnmt3aR878H/+–mutant-only whole BM (supplemental Figure 3F), we found only 1 in 5 recipients developed a mild MDS-like phenotype (supplemental Figure 3G,H).
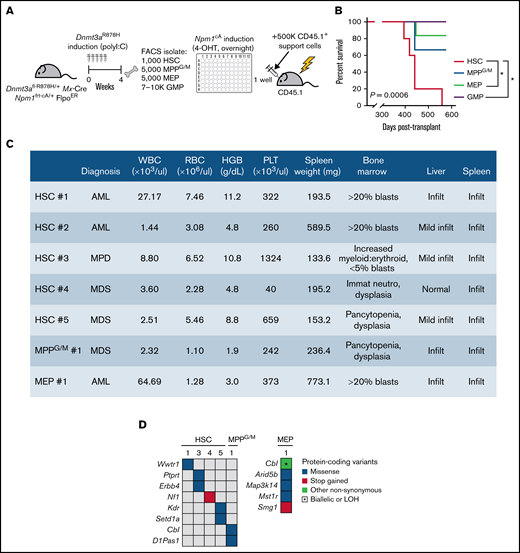
Dnmt3aR878H/+ HSCs are the most potent cell of origin transformed by Npm1cA. (A) Experimental design. (B) Overall survival of mice transplanted with Dnmt3a;Npm1-mutant HSCs (n = 5), MPPG/M (n = 3), MEP (n = 6), or GMP cells (n = 5). *P < .05 by Kaplan-Meier. (C) Blood, BM, spleen, and liver data collected from individual moribund mice used for blinded diagnoses of hematologic malignancies. (D) Somatic mutations detected in individual BM samples using M-IMPACT targeted sequencing.
Dnmt3aR878H/+ HSCs are the most potent cell of origin transformed by Npm1cA. (A) Experimental design. (B) Overall survival of mice transplanted with Dnmt3a;Npm1-mutant HSCs (n = 5), MPPG/M (n = 3), MEP (n = 6), or GMP cells (n = 5). *P < .05 by Kaplan-Meier. (C) Blood, BM, spleen, and liver data collected from individual moribund mice used for blinded diagnoses of hematologic malignancies. (D) Somatic mutations detected in individual BM samples using M-IMPACT targeted sequencing.
Our previous work identified human AML-relevant cooperating mutations as being spontaneously accrued in our Dnmt3aR878H/+; Npm1cA model.11 We performed targeted sequencing of Dnmt3aR878H/+;Npm1cA myeloid malignancies to evaluate whether cooperating somatic mutations were differentially accrued depending on cell of origin. We observed that the myeloid malignancy generated from Dnmt3aR878H/+;Npm1cA MEP cells had a greater number of cooperating somatic mutations than the malignancies generated from HSC and MPPG/M cells (Figure 3D). The only recurrent mutation identified was in the AML-associated allele Cbl,20 and this was only found in the context of disease initiated by MPPG/M or MEP cells. Together, our data support that within the pool of stem and progenitor cells in Dnmt3aR878H/+ mice, initiation of Npm1cA in HSCs results in the most potent development of hematologic malignancy. Furthermore, our data suggest that increased genomic instability and accrual of a greater number of cooperating somatic mutations is not an underlying explanation for why Dnmt3aR878H/+ HSCs were the cell type most potently transformed by Npm1cA.
Npm1c causes distinct chromatin accessibility changes in Dnmt3aR878H/+ HSCs
To interrogate molecular alterations induced by Npm1cA in Dnmt3aR878H/+ HSCs, we assessed the chromatin landscape using ATAC-seq, following our previous observation that pathway enrichment was consistent among accessible promoter regions and transcriptional patterns in Dnmt3aR878H/+ HSCs (Figure 1D,F). Control, Npm1frt-cA/+, Dnmt3afl-R878H/+, or Dnmt3afl-R878H/+;Npm1frt-cA/+ BM were transplanted into lethally irradiated recipients (Figure 4A). At 4 weeks after transplant, all mice received poly(I:C) to induce Dnmt3aR878H, followed 4 weeks later by tamoxifen to induce Npm1cA. At 4 weeks after tamoxifen, all mice were harvested, and donor-derived HSC and MPPG/M cells were isolated by FACS for ATAC-seq. Using principal component analysis of a cumulative set of the top differentially accessible promoter regions in HSCs and MPPG/M cells, we discovered that HSCs of different genotypes were better separated by accessible promoters than the MPPG/M populations (Figure 4B), suggesting that alterations in chromatin accessibility caused by these mutations are cell context-specific. To assess changes in promoter accessibility caused by Npm1cA on the background of a preexisting Dnmt3aR878H mutation, we compared Dnmt3aR878H/+;Npm1cA/+ vs Dnmt3aR878H/+ HSC and MPPG/M cells. We observed that HSCs had a greater number of promoters with increased accessibility than MPPG/M cells, and there was very little overlap between the cell types (Figure 4C). Conversely, MPPG/M cells had a larger number of promoters with decreased accessibility compared with HSCs, and there was also very little overlap between the cell types. Of note, several Hox genes (including Hoxa9) and Meis1 were found to have increased promoter accessibility in Dnmt3aR878H/+;Npm1cA/+ vs Dnmt3aR878H/+ HSCs (supplemental Figure 4A), consistent with induction of these transcripts by Npm1c.19,21,22 In contrast, Dnmt3aR878H/+;Npm1cA/+ MPPG/M cells only had a modest increase in expression of 1 Hox gene (Hoxa10). These results support that cell context can impact chromatin alterations induced by Npm1cA on a Dnmt3aR878H background.
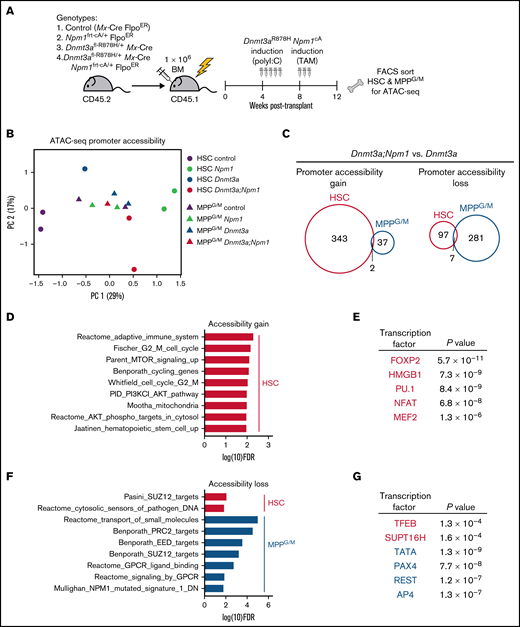
Dnmt3aR878H/+ chromatin state is altered by cooperating Npm1cA mutation in a cell-type-specific manner. (A) Experimental design. (B) Principal component analysis of ATAC-seq data from HSC and MPPG/M cells with genotypes Mx-Cre, Dnmt3aR878H/+, Npm1cA/+, and Dnmt3aR878H/+;Npm1cA/+. Principal components were calculated based on the top 900 differentially accessible promoter peaks across all conditions, ranked by FDR. Data were collected from 2 to 3 pooled mice for each replicate (1 to 2 per condition). (C) Venn diagrams representing overlapping promoter accessibility gain (left) or loss (right) between Dnmt3aR878H/+; Npm1cA/+ vs Dnmt3aR878H/+ HSCs and MPPG/M cells. (D) Pathway enrichment of the 343 promoters with increased accessibility in Dnmt3aR878H/+;Npm1cA/+ vs Dnmt3aR878H/+ HSCs. The low number of accessible promoter gains in MPPG/M cells (39 promoters) precluded pathway enrichment analysis. (E) Transcription factor binding site enrichment in promoters with increased accessibility. (F) Pathway enrichment of the 97 promoters with decreased accessibility in Dnmt3aR878H/+;Npm1cA/+ vs Dnmt3aR878H/+ HSCs, and the 281 promoters with decreased accessibility in Dnmt3aR878H/+;Npm1cA/+ vs Dnmt3aR878H/+ MPPG/M cells. (G) Transcription factor binding site enrichment in promoters with decreased accessibility.
Dnmt3aR878H/+ chromatin state is altered by cooperating Npm1cA mutation in a cell-type-specific manner. (A) Experimental design. (B) Principal component analysis of ATAC-seq data from HSC and MPPG/M cells with genotypes Mx-Cre, Dnmt3aR878H/+, Npm1cA/+, and Dnmt3aR878H/+;Npm1cA/+. Principal components were calculated based on the top 900 differentially accessible promoter peaks across all conditions, ranked by FDR. Data were collected from 2 to 3 pooled mice for each replicate (1 to 2 per condition). (C) Venn diagrams representing overlapping promoter accessibility gain (left) or loss (right) between Dnmt3aR878H/+; Npm1cA/+ vs Dnmt3aR878H/+ HSCs and MPPG/M cells. (D) Pathway enrichment of the 343 promoters with increased accessibility in Dnmt3aR878H/+;Npm1cA/+ vs Dnmt3aR878H/+ HSCs. The low number of accessible promoter gains in MPPG/M cells (39 promoters) precluded pathway enrichment analysis. (E) Transcription factor binding site enrichment in promoters with increased accessibility. (F) Pathway enrichment of the 97 promoters with decreased accessibility in Dnmt3aR878H/+;Npm1cA/+ vs Dnmt3aR878H/+ HSCs, and the 281 promoters with decreased accessibility in Dnmt3aR878H/+;Npm1cA/+ vs Dnmt3aR878H/+ MPPG/M cells. (G) Transcription factor binding site enrichment in promoters with decreased accessibility.
To gain further insight into the biological implications of altered promoter accessibility, we used pathway enrichment and transcription factor motif predictions from the molecular signatures database. Dnmt3aR878H/+;Npm1cA/+ HSCs gained accessibility to promoters enriched in cell cycling, PI3K/Akt/mTOR signaling, and metabolic and stem cell pathways (Figure 4D), and were enriched in binding sites for transcription factors such as FOXP2,23 NFAT,24 MEF2,25 and the chromatin binding factor HMGB1,26 which have been implicated in human AML (Figure 4E). These were distinct from promoter accessibility gains, pathway, and transcription factor binding site enrichment in Npm1c HSCs without a preexisting Dnmt3a mutation (supplemental Figure 4C,D). With respect to reduced promoter accessibility in Dnmt3aR8778H/+;Npm1cA/+ cells, these regions were enriched in targets of the polycomb repressive complex PRC2 (Figure 4F) and binding sites for the tumor suppressor TFEB27 (Figure 4G). Promoters with reduced accessibility in Dnmt3aR878H/+;Npm1cA/+ cells were also enriched for a gene set downregulated in expression in human NPM1-mutant AML,28 supporting human relevance of chromatin accessibility changes observed in our mouse model. Taken together, our results suggest that unique chromatin changes are induced by Npm1cA in the context of Dnmt3aR878H/+ HSCs, which are correlated with Dnmt3aR878H/+ HSCs being the cell type most potently transformed by Npm1cA, and that activation of HSC cycling and PI3K/Akt/mTOR signaling may be early preleukemic mechanisms.
Discussion
While much of the literature describing functional data in mouse models of DNMT3A-mutant CH have used Dnmt3a conditional knockout mice,15,17,29,30 human AML is largely comprised of monoallelic somatic DNMT3A mutations, with R882H being the most prevalent hotspot mutation.31,32 Biochemically, partial loss-of-function,33,34 dominant-negative,35,36 and gain-of-function effects37 on DNA methylation have all been associated with DNMT3AR882 mutation. Furthermore, Russler-Germain and colleagues have demonstrated differences in DNA hypomethylation patterns between DNMT3AR882-mutant and non-R882 DNMT3A-mutant AML patient samples,36 suggesting that DNMT3AR882 is not simply a loss-of-function allele. Thus, as a foundation for our study, it was important to evaluate whether our Dnmt3aR878H knock-in allele would induce functional and molecular alterations consistent with or distinct from knockout of Dnmt3a. In addition, direct evaluation of the cell-context-specificity of Dnmt3a knockout or Dnmt3a mutant alleles performed by induction in multiple populations of hematopoietic stem and progenitor cells isolated from the same mice, in parallel, has not been previously described to our knowledge. Thus, our work adds robust evidence to the literature that Dnmt3aR878H preserves molecular self-renewal programs, confers a fitness advantage selectively in HSCs, and results in molecular signatures consistent with those observed in human DNMT3A-mutant HSCs.
Our data provide insight into the contexts in which Dnmt3aR878H provides a fitness advantage to HSCs, and in which Dnmt3aR878H provides a clonal advantage to mature, circulating hematopoietic cell populations. We find that Dnmt3aR878H/+ HSCs have reduced contribution to mature PB cells upon primary transplant, consistent with an impaired differentiation phenotype reported in Dnmt3a−/− cells.17,30 While we have not evaluated whether this decrease could be due in part to impaired homing to the BM, Dnmt3a−/− HSCs have previously been reported to have unaltered BM homing capacity.38 After secondary transplant, we find that Dnmt3aR878H/+ cells substantially contribute to mature BM and PB cells and outcompete their wild-type counterparts. Of note, this is distinct from the Dnmt3a knockout phenotype in which HSC differentiation becomes further compromised with successive transplant passages.30 While the mechanism(s) by which Dnmt3aR878H/+ HSCs overcome impaired differentiation to contribute to mature BM and PB is still actively under investigation, our data suggest that stressors such as irradiation or aging, or selection bottlenecks due to transplantation, offer sensitized conditions to deeply interrogate these mechanisms.
In their seminal study in 2014, Liran Shlush and John Dick and colleagues proposed a model wherein the cell of origin for DNMT3A-mutant AML is an HSC.10 In this model, the initiating DNMT3A mutation results in an expanded pool of HSCs and downstream progenitors within which NPM1 or other mutations are acquired to drive progression to AML. Their findings pointed to GMPs and/or multilymphoid progenitors as the likely populations which acquired an NPM1 mutation. Murine models with orthogonal induction of the Dnmt3a and Npm1-mutant alleles and prospective isolation of cell surface-marker-defined stem and progenitor populations have allowed us to interrogate this model. We show that HSCs are the cell of origin of the initiating Dnmt3aR878H mutation. In addition, they are the most potent initiating cell type for myeloid malignancies arising from the subsequent acquisition of the Npm1c mutation, with the caveat, yet necessity, of an overnight ex vivo culture system to induce the Npm1c mutation in a cell-type-specific manner. This is consistent with distinct chromatin accessibility alterations induced by the Npm1c mutation in Dnmt3a-mutant HSCs compared with downstream progeny, which suggests that activation of HSC cycling and PI3K/Akt/mTOR signaling are early, preleukemic mechanisms.
Our previous work found that during the leukemogenic progression of Dnmt3a;Npm1-mutant MDS/MPD to AML, HSC and MPP populations became depleted while myeloid-restricted progenitors such as GMPs became expanded.11 Taken together with our new findings, we posit that while Dnmt3a-mutant HSCs have the greatest potential as an initiating cell for Npm1c-mediated transformation, the transformation process results in a myeloid-restricted progenitor becoming the leukemia propagating or “leukemia stem cell” population. Consistent with this concept, we observed that Dnmt3a;Npm1-mutant GMPs did not give rise to myeloid malignancies, in contrast to a recent study demonstrating that Npm1-mutant long-term engrafting GMPs, with or without a cooccurring Dnmt3a mutation, possess sufficient potency to initiate AML.19 As our study transplanted 10-fold fewer numbers of GMPs into recipient animals, we may not have observed this potential due to this being a rare subset of GMPs. Engineered systems to induce mutations in a precise, cell-type-specific manner without the need for prospective isolation will be a critical technological advancement for future in vivo cell-of-origin studies. Our results suggest there may be an opportunity for therapeutic intervention to specifically target Dnmt3a-mutant HSCs before, or concomitant with, acquisition of additional mutations such as Npm1c. One challenge will be to identify a therapeutic target against Dnmt3a-mutant HSCs that spares wild-type HSCs. Our work supports that the sustained expression of genes regulating self-renewal may provide a therapeutic target for transient intervention, as Dnmt3a-mutant HSCs retain stemness and self-renewal gene signatures more prominently than that of control HSCs.
In de novo adult AML, NPM1 is most frequently mutated with DNMT3A,39 and the majority of DNMT3A mutations are found in R882, replicated by the murine R878 model used in our study. Recent analysis aimed to elucidate the prognostic impact of cooccurring DNMT3A and NPM1 mutations in AML has found that DNMT3A mutation status does not have an overall prognostic impact40 ; however, DNMT3Amut was associated with significantly higher measurable residual disease (MRD) compared with DNMT3Awt, and DNMT3Amut patients exhibited a trend toward a greater risk of molecular relapse. Based on our results, we speculate that the cell of origin incurring and sustaining the NPM1 cooperating mutation will have an impact on disease prognosis and may be a relevant consideration when evaluating MRD.
Acknowledgments
The authors thank JAX scientific services for experimental support and all members of the Trowbridge laboratory for experimental support, helpful discussion, and critical comments.
This work was supported by the National Institutes of Health (NIH), National Institute of Diabetes and Digestive and Kidney Diseases grant R01DK118072 (J.J.T.), NIH, National Institute on Aging grants R01AG069010 (J.J.T.) and U01AG077925 (J.J.T. and R.L.L.), and an Ellison Medical Foundation New Scholar Award in Aging (J.J.T.). J.J.T. is a Scholar of The Leukemia & Lymphoma Society. J.M.S. received support from NIH, National Institute of Child Health and Human Development grant T32HD007065 and NIH, National Institute on Aging grant T32AG062409. L.A.M. is supported by NIH, National Cancer Institute grant K99CA252005. This work was partially supported by The Jackson Laboratory Cancer Center Support grant P30CA034196, Memorial Sloan-Kettering Cancer Center Support Grant P30CA008748, and The Jackson Laboratory Nathan Shock Center for Excellence in the Basic Biology of Aging grant P30AG038070.
Authorship
Contribution: J.M.S., E.E., M.A.L., and L.A.M. performed experiments; J.M.S., E.E., M.A.L., L.A.M., T.S., and M.J.R. analyzed data; J.M.S., E.E., T.S., and J.J.T. made figures; J.M.S., E.E., M.A.L., R.L.L., and J.J.T. designed experiments; J.M.S., E.E., J.J.M., and J.J.T. wrote the paper; and M.J.R. and R.L.L. edited the paper.
Conflict-of-interest disclosure: J.J.T. receives research support from H3 Biomedicine. L.A.M. has received honoraria from and is a member of the speakers’ bureau for Mission Bio. R.L.L. is on the supervisory board of Qiagen and is a scientific advisor to Imago, Mission Bio, Zentalis, Ajax, Auron, Prelude, C4 Therapeutics, and Isoplexis; has consulted for Novartis, Incyte, Janssen, Astellas, and Morphosys; receives research support from and consulted for Celgene and Roche; and has received honoraria from Roche, Lilly, and Amgen for invited lectures and from Gilead for grant reviews. The remaining authors declare no competing financial interests.
Correspondence: Jennifer J. Trowbridge, The Jackson Laboratory, 600 Main St, Bar Harbor, ME 04609; e-mail: jennifer.trowbridge@jax.org.

