

Key Points
ox-mtDNA is released from cells after lytic, pyroptotic cell death and is readily quantifiable in cell supernatants and patient plasma.
PB plasma glucose–adjusted ox-mtDNA concentration is a sensitive and specific biomarker for MDS and medullary cell death.

Abstract
Myelodysplastic syndromes (MDS) are heterogeneous hematopoietic stem cell malignancies that can phenotypically resemble other hematologic disorders. Thus, tools that may add to current diagnostic practices could aid in disease discrimination. Constitutive innate immune activation is a pathogenetic driver of ineffective hematopoiesis in MDS through Nod-like receptor protein 3 (NLRP3)–inflammasome-induced pyroptotic cell death. Oxidized mitochondrial DNA (ox-mtDNA) is released upon cytolysis, acts as a danger signal, and triggers inflammasome oligomerization via DNA sensors. By using immortalized bone marrow cells from murine models of common MDS somatic gene mutations and MDS primary samples, we demonstrate that ox-mtDNA is released upon pyroptosis. ox-mtDNA was significantly increased in MDS peripheral blood (PB) plasma compared with the plasma of healthy donors, and it was significantly higher in lower-risk MDS vs higher-risk MDS, consistent with the greater pyroptotic cell fraction in lower-risk patients. Furthermore, ox-mtDNA was significantly higher in MDS PB plasma compared with all other hematologic malignancies studied, with the exception of chronic lymphocytic leukemia (CLL). Receiver operating characteristic/area under the curve (ROC/AUC) analysis demonstrated that ox-mtDNA is a sensitive and specific biomarker for patients with MDS compared with healthy donors (AUC, 0.964), other hematologic malignancies excluding CLL (AUC, 0.893), and reactive conditions (AUC, 0.940). ox-mtDNA positively and significantly correlated with levels of known alarmins S100A9, S100A8, and apoptosis-associated speck-like protein containing caspase recruitment domain (CARD) specks, which provide an index of medullary pyroptosis. Collectively, these data indicate that quantifiable ox-mtDNA released into the extracellular space upon inflammasome activation serves as a biomarker for MDS and the magnitude of pyroptotic cell death.
Introduction
Myelodysplastic syndromes (MDS) are hematopoietic stem cell malignancies characterized by peripheral blood (PB) cytopenias and cytologic dysplasia.1,2 MDS is distinct from other myeloid malignancies. Chronic inflammation observed in the MDS bone marrow (BM) microenvironment is driven by Nod-like receptor protein 3 (NLRP3) inflammasome assembly and subsequent pyroptotic cell death of hematopoietic stem and progenitor cells (HSPCs), which results in refractory cytopenias.3 NLRP3 inflammasome activation is licensed by intrinsic danger-associated molecular patterns (DAMPs) such as those resulting from somatic gene mutations (SGMs) and reactive oxygen species (ROS), as well as extrinsic DAMPs such as S100A9 and S100A8 that activate toll-like receptor (TLR) signaling.4 Inflammasome assembly occurs when caspase-1 binds to NLRP3 through an adapter molecule—apoptosis-associated speck-like protein containing a CARD [caspase recruitment domain] (ASC)—triggering caspase-1 autocleavage. Active caspase-1 subunits subsequently cleave pro-interleukin-1β (IL-1β), pro-IL-18, and the pore-forming protein gasdermin D, triggering caspase-1–mediated cell death or pyroptosis. When pyroptosis begins, cells release their intracellular contents, including DAMPs and lactate dehydrogenase (LDH), into the extracellular matrix, which triggers a feed-forward mechanism that propagates inflammasome and innate immune activation in neighboring cells.5
MDS often phenotypically resembles other hematologic disorders such as chronic myelomonocytic leukemia (CMML); therefore, diagnostic tools that may be used to help differentiate MDS from overlapping syndromes is of clinical importance.1 Mitochondrial DNA (mtDNA) that is prone to oxidation by ROS is implicated as a key mediator of systemic sterile inflammatory states.6-14 Furthermore, during inflammasome assembly, the mitochondrial membrane depolarizes releasing mtDNA into the cytosol, and upon pyroptotic cell death, the oxidized mtDNA (ox-mtDNA) is released with other intracellular DAMPs into the extracellular matrix. DAMP release potentiates innate immune activation in proximate cells either through the engagement of DNA sensors or by direct interaction with NLRP3.6,13,15-17 Importantly, elevated levels of cell-free DNA have been reported in several chronic systemic inflammatory disorders.18,19 Here, we investigated whether ox-mtDNA serves as a candidate disease biomarker of medullary pyroptosis in MDS.
Methods
Primary samples
PB and BM plasma from patients and controls (Table 1) were acquired between January 1, 2005, and January 12, 2017, through protocols approved by the institutional review board or equivalent regulatory committees for each institution that provided specimens from patients with MDS, hematologic malignancies, and reactive conditions and from healthy controls. MDS patients were stratified according to the International Prognostic Scoring System (IPSS) with lower-risk (LR) patients having an IPSS ≤1 and higher-risk (HR) patients having an IPSS ≥1.5.
Patient demographics for MDS discovery and validation cohorts and controls
| Demographic characteristic | Discovery | Validation | ||
|---|---|---|---|---|
| MDS (n = 176) | Controls (n = 29) | MDS (n = 113) | Controls (n = 30) | |
| Age, y | ||||
| Mean | 72.4 | 65.0 | 71.8 | 75 |
| Median | 73 | 64 | 73 | 73 |
| Standard deviation | 8.45 | 4.9 | 7.2 | 5.56 |
| Sex | ||||
| Male | 99 (56.6) | 0 | 61 (54) | 3 (10) |
| Female | 43 (24.6) | 29 (100) | 23 (20.3) | 27 (90) |
| Unknown | 34 (18.9) | 0 | 29 (25.7) | 0 |
| Risk category | ||||
| HR | 14 (8) | NA | 47 (41.6) | NA |
| LR | 162 (92) | NA | 66 (58.4) | NA |
| WHO | ||||
| Single-lineage dysplasia | 9 (5.1) | NA | 4 (3.5) | NA |
| Single-lineage dysplasia, ringed sideroblasts | 30 (17.1) | NA | 36 (31.9) | NA |
| Multilineage dysplasia | 36 (20.4) | NA | 12 (10.6) | NA |
| Multilineage dysplasia, ringed sideroblasts | 14 (8) | NA | 10 (8.8) | NA |
| Excess blasts | 23 (13.1) | NA | 19 (16.8) | NA |
| Not otherwise specified | 58 (33) | NA | 30 (26.6) | NA |
| Unclassified | 6 (3.4) | NA | 2 (1.8) | NA |
Data are presented as n (%) unless otherwise specified.
NA, not available; WHO, World Health Organization.
Cells
Myeloid leukemia cell lines THP1 (TIB-202) and U937 (CRL-1593.2) were obtained from American Type Culture Collection, and MDS-transformed SKM1 cells (ACC 547) were obtained from the Leibniz Institute DSMZ–German Collection of Human & Animal Cell Lines—Microorganisms and Cell Cultures. The human cell lines were cultured in RPMI 1640 (Thermo Fisher Scientific, Waltham, MA) supplemented with 10% fetal bovine serum (FBS) (Corning Inc. Corning, NY) and 1% penicillin-streptomycin (Life Technologies, Grand Island, NY). To generate a renewable source of murine SGM models with inflammasome activation, we immortalized BM mononuclear cells (BM-MNC) from Tet2−/−, Srsf2P95H, and wild-type (WT) control mice with an estrogen-regulated Hoxb8 transgene.20 Immortalized cells were cultured in RPMI 1640 with 10% FBS, 1% penicillin-streptomycin, 0.5 µM β-estradiol (Sigma-Aldrich, St. Louis, MO), and 50 ng/mL recombinant murine stem cell factor (PeproTech Inc, Rocky Hill, NJ).
Rho0 cells were generated according to previously described methods.21 Briefly, U937 and SKM1 cells were cultured in RPMI 1640 with 10% FBS, 1% penicillin-streptomycin, 100 ng/mL ethidium bromide (EtBr, Sigma-Aldrich), 100 mM sodium pyruvate (Thermo Fisher Scientific), and 50 μg/mL uridine (Sigma-Aldrich). The absence of mtDNA was confirmed by polymerase chain reaction (PCR) using mitochondrial-specific primers and by immunofluorescence (IF) using 10 mM 5-bromo-2′-deoxyuridine (BrdU) staining (Abcam, Cambridge, United Kingdom) to assess incorporation after cell treatment with 7 μM aphidicolin (APH) for 2 hours (Sigma-Aldrich). THP1 cells demonstrated particular sensitivity to EtBr, resulting in almost complete cell death; thus, they were not useful for further experiments.
CRISPR
CRISPR gene-knockout THP1 cells were created by CRIPSR/Cas9 gene editing using guide RNA to ASC (F-GCTAACGTGCTGCGCGACAT, R-GCTAACGTGCTGCGCGACAT), caspase-1 (F-GCTTTAAACCACACCACACCA, R-TGGTGTGGTGTGGTTTAAAGC), NLRP3 (F-GACAATTCTCTGGGGGACCCA, R-TGGGTCCCCCAGAGAATTGTC), or scrambled control (F-GACGGAGGCTAAGCGTCGCA, R-TGCGACGCTTAGCCTCCGTC) into a green fluorescent protein (GFP)– (caspase-1, NLRP3, scrambled) or red fluorescent protein (RFP) (ASC)–expressing pL-CRISPR.SFFV plasmid (pL-CRISPR.SFFV.GFP, pL-CRIPSR.SFFV.tRFP), which was a gift from Benjamin Ebert (Addgene plasmid #57827; http://n2t.net/addgene:57827; RRID:Addgene_57827; Addgene plasmid #57826; http://n2t.net/addgene:57826; RRID:Addgene_57826).22 Forward and reverse guide oligonucleotides were purchased from Integrated DNA Technologies (Coralville, IA). CACC on forward and AAAC on reverse oligonucleotides were added 5′ for plasmid ligation. Guide-containing plasmids were transformed into Stbl3-competent cells. CRISPR plasmids were packaged into lentiviruses and transduced as previously described.3 After 3 days, GFP/RFP+ cells were sorted and expanded.
Inflammasome stimulation
To stimulate inflammasome assembly, cells were treated for 24 hours with 5 mM adenosine triphosphate (Sigma-Aldrich) and 0.1 µg/mL lipopolysaccharide (Sigma-Aldrich), and then treated with 5 µM nigericin (Sigma-Aldrich) (the combination of treatments denoted as LAN) for 1 hour or with 1.5 µg/mL recombinant human S100A9 (rhS100A9) for 24 hours. Inflammasome activity and pyroptosis were assessed using the Caspase-Glo 1 Inflammasome Assay, and LDH release was assessed using the LDH-Glo Cytotoxicity Assay on a GloMax Discover Microplate Reader (Promega Corporation, Madison, WI) according to manufacturer’s protocols. In addition, cells were harvested for western blotting and flow cytometry, and supernatants were frozen at −80°C until use.
Enzyme-linked immunosorbent assay (ELISA)
Oxidized DNA (ox-DNA) in PB plasma, BM plasma, and cell supernatants was quantified by using the DNA/RNA Oxidative Damage (High Sensitivity) ELISA Kit (Cayman Chemical Company, Ann Arbor, MI). This ELISA is not specific for mtDNA, and additional methods were used to determine the mitochondrial origin of the ox-DNA. Plasma glucose concentration analyzed to account for possible changes arising from hyperglycemia-induced inflammasome activation was measured by the Glucose Colorimetric Assay Kit (Cayman Chemical Company). S100A8 and S100A9 levels were measured using CircuLex S100A8/MRP8 and CircuLex S100A9/MRP14 ELISA kits (MBL International Corporation, Woburn, MA).
Statistical analysis
Student t test was used to assess significance in the MDS murine SGM models and inflammasome activated cell lines. Paired patient samples (PB and BM) were compared by using two-tailed paired Student t test. The two-tailed Student t test of log10-transformed, glucose-normalized PB plasma ox-mtDNA was used to compare patients and controls. The Kruskal-Wallis test was used to compare diseases with fewer than 10 patients. Correlations (corrected for glucose) between log10-transformed ox-mtDNA and log10-transformed percentage of ASC specks, log10-transformed S100A8, and log10-transformed S100A9 protein concentrations were analyzed by using the Pearson test. Biomarker efficiency was analyzed using receiver operating characteristic (ROC) and area under the curve (AUC) as effective measures of accuracy for MDS vs controls or by k-fold cross-validation when comparing MDS patients with non-MDS patients. World Health Organization criteria were used for classification, and mutation analyses were performed by using the Kruskal-Wallis test. Statistical analysis was performed by using R version 3.5.0 or GraphPad Prism version 8.3.1. Additional methods can be found in the supplemental Materials.
Results
Inflammasome activation generates ox-DNA
TLR-dependent priming signals initiate the synthesis and oxidation of mtDNA, which is necessary for stabilizing NLRP3 in a primed state.6,23 To determine whether SGMs with inflammasome activity direct the release of ox-DNA, we investigated the common MDS driver epigenetic modifying (Tet2−/−) and spliceosome (Srsf2P95H) gene mutations in Hoxb8 immortalized murine HSPCs derived from mutant and corresponding WT mice (supplemental Figure 1).24-27 Immortalized murine SGM models display 2 to 4.5 times greater caspase-1 activity compared with WT cells, which indicates inflammasome activation and is consistent with our previous findings in primary MDS specimens (Tet2−/− vs WT, P = 1.6 × 10⁻⁵; Srsf2P95H vs WT, P = 7.9 × 10⁻³) (Figure 1A).3 Upon inflammasome assembly, cells undergo mitochondrial membrane depolarization and release mitochondrial contents into the cytosol.13,15 By using an antibody that recognizes ox-DNA/RNA, we quantified cytosolic ox-DNA by flow cytometry, which demonstrated an approximately twofold higher level of ox-DNA in Tet2−/− vs WT cells (P = 5.1 × 10⁻³) and Srsf2P95H vs WT cells (P = 4.8 × 10⁻²) (Figure 1B) which was confirmed by IF (Tet2−/− vs WT, P = 5.0 × 10⁻⁴; Srsf2P95H vs WT, P = 4.6 × 10⁻²) (Figure 1C; supplemental Figure 2A-B). We next investigated whether ox-DNA is released into the extracellular space cells upon pyroptotic cell lysis by quantitating levels of ox-DNA in supernatants of Tet2−/− and Srsf2P95H vs WT cells. ox-DNA concentrations were significantly higher in supernatants from Tet2−/− vs WT cells (P = 1.9 × 10⁻²) and Srsf2P95H vs WT cells (P = 1.5 × 10⁻³) (Figure 1D; supplemental Figure 2C). To demonstrate that these findings were not specific to cultured SGM immortalized murine cell lines, we isolated BM-MNC from MDS patients and age-matched normal controls and assessed ox-DNA levels by IF. We found significantly greater cytosolic ox-DNA in MDS patients compared with healthy donors (P = 3.3 × 10⁻³) (Figure 1E; supplemental Figure 2D). MDS cells maintain a higher proliferative index compared with normal cells because of inflammasome-directed activation of β-catenin. We found significantly elevated levels of Ki67 staining in MDS BM cells compared with those of normal donors (P = 3.5 × 10⁻²) that correlated positively with the levels of ox-DNA (r = 0.983; P = 5.7 × 10⁻³) (supplemental Figure 3A-B). These data indicate that cytosolic ox-DNA accumulates in MDS and immortalized murine HSPCs harboring SGMs of varied functional classes and is released into the extracellular space where it may serve as an inflammasome catalyst in neighboring cells.
![Inflammasome activation results in the generation of ox-DNA. (A) Immortalized murine SGM model cell lines (Srsf2P95H and Tet2−/−) display increased activity of caspase-1 assessed by Caspase-1 Glo assay in mutant compared with WT cells (mean ± standard deviation [SD] of 3 independent experiments). (B) Representative image of increased intracellular ox-DNA assessed by flow cytometry (mean fluorescent intensity [MFI] ± SD of 3 independent experiments) in immortalized murine SGM model cell lines (Srsf2P95H and Tet2−/−) compared with WT controls. (C) Confocal IF of immortalized murine SGM models stained for ox-DNA (4′,6-diamidino-2-phenylindole [DAPI]; ox-DNA/RNA; original magnification ×2520). Micrographs are representative figures. MFI of cells was quantified (minimum 200 cells per sample, 3 samples per group; MFI ± SD). (D) Cell-free ox-DNA was assessed by ELISA in media supernatants of immortalized SGM cell lines (mean ± SD of 3 independent experiments). (E) Confocal IF of cytosolic ox-mtDNA in MDS BM-MNC samples compared with normal BM-MNC (DAPI, ox-mtDNA fluorescein isothiocyanate [FITC]; original magnification ×2520). Representative micrographs. MFI of cells was quantified (minimum 200 cells per sample, 3 samples per group; MFI ± SD). FL1-H, fluorescence parameter 1 high.](https://ash.silverchair-cdn.com/ash/content_public/journal/bloodadvances/5/8/10.1182_bloodadvances.2020003475/1/m_advancesadv2020003475f1.png?Expires=1769599537&Signature=Q3eW42Us0c-X8JikP797Ztxam~TL5Ekf47ML2A9plxnef2a8~NDV7GuiCCwmJ3zvjD8913uI49OB9K9MW-YMbNSJHOi~8KEh9RXH9AA1EGf6fiabGZ-B8BGH8z~O5YYCAf7D4gAxhXiV4MkKgqp4WSlpVEys4-oOBNY1W6Rlr0G-bpfUUjeoIOMpYvfRwYiBTfspuvb9nqPHyskCIHXxhD5CSAsCXFatyDHfK8AZtEgvii0XwMrk~HkC9wqNsBSByXGpUE2S9-LPUEc7ya-71uNv155Zc2yEXuenA-U0M1x57dcmrEkdNi-17wjE1VfV1IOt5jkhph6Br2votczT2w__&Key-Pair-Id=APKAIE5G5CRDK6RD3PGA)
Inflammasome activation results in the generation of ox-DNA. (A) Immortalized murine SGM model cell lines (Srsf2P95H and Tet2−/−) display increased activity of caspase-1 assessed by Caspase-1 Glo assay in mutant compared with WT cells (mean ± standard deviation [SD] of 3 independent experiments). (B) Representative image of increased intracellular ox-DNA assessed by flow cytometry (mean fluorescent intensity [MFI] ± SD of 3 independent experiments) in immortalized murine SGM model cell lines (Srsf2P95H and Tet2−/−) compared with WT controls. (C) Confocal IF of immortalized murine SGM models stained for ox-DNA (4′,6-diamidino-2-phenylindole [DAPI]; ox-DNA/RNA; original magnification ×2520). Micrographs are representative figures. MFI of cells was quantified (minimum 200 cells per sample, 3 samples per group; MFI ± SD). (D) Cell-free ox-DNA was assessed by ELISA in media supernatants of immortalized SGM cell lines (mean ± SD of 3 independent experiments). (E) Confocal IF of cytosolic ox-mtDNA in MDS BM-MNC samples compared with normal BM-MNC (DAPI, ox-mtDNA fluorescein isothiocyanate [FITC]; original magnification ×2520). Representative micrographs. MFI of cells was quantified (minimum 200 cells per sample, 3 samples per group; MFI ± SD). FL1-H, fluorescence parameter 1 high.
Inflammasome activation results in the generation of ox-DNA. (A) Immortalized murine SGM model cell lines (Srsf2P95H and Tet2−/−) display increased activity of caspase-1 assessed by Caspase-1 Glo assay in mutant compared with WT cells (mean ± standard deviation [SD] of 3 independent experiments). (B) Representative image of increased intracellular ox-DNA assessed by flow cytometry (mean fluorescent intensity [MFI] ± SD of 3 independent experiments) in immortalized murine SGM model cell lines (Srsf2P95H and Tet2−/−) compared with WT controls. (C) Confocal IF of immortalized murine SGM models stained for ox-DNA (4′,6-diamidino-2-phenylindole [DAPI]; ox-DNA/RNA; original magnification ×2520). Micrographs are representative figures. MFI of cells was quantified (minimum 200 cells per sample, 3 samples per group; MFI ± SD). (D) Cell-free ox-DNA was assessed by ELISA in media supernatants of immortalized SGM cell lines (mean ± SD of 3 independent experiments). (E) Confocal IF of cytosolic ox-mtDNA in MDS BM-MNC samples compared with normal BM-MNC (DAPI, ox-mtDNA fluorescein isothiocyanate [FITC]; original magnification ×2520). Representative micrographs. MFI of cells was quantified (minimum 200 cells per sample, 3 samples per group; MFI ± SD). FL1-H, fluorescence parameter 1 high.
We next interrogated ox-DNA release after external inflammasome activation and execution of pyroptosis. The canonical pyroptotic TLR4 signaling pathway was activated in THP1, SKM1, and U937 cells by incubation with lipopolysaccharide, adenosine triphosphate, and nigericin (collectively referred to as LAN).28 After inflammasome activation, we observed a significant increase in extracellular ox-DNA by ELISA (THP1, P = 1.0 × 10⁻²; SKM1, P = 9.0 × 10⁻⁷; U937, P = 4.0 × 10⁻⁴; Figure 2A) that was accompanied by an elevation in intracellular cytosolic ox-DNA as evidenced by confocal IF (THP1, P = 3.2 × 10⁻²; SKM1, P = 1.3 × 10⁻²; U937, P = 2.7 × 10⁻²; Figure 2B). To assess whether ox-DNA release was dependent upon a fully functional inflammasome complex, we used CRISPR/Cas 9 genetic editing to knock down ASC, pro-caspase-1, and NLRP3. Upon treatment with LAN, control cells transfected with the scrambled guides showed a 2.5-fold increase in ox-DNA, whereas media from CRISPR-edited cells had no significant change in ox-DNA (scrambled, P = 1.9 × 10⁻²; ASC, P = .206; caspase-1, P = .842; NLRP3 [upper band] P = .896) (Figure 2C; supplemental Figure 4).
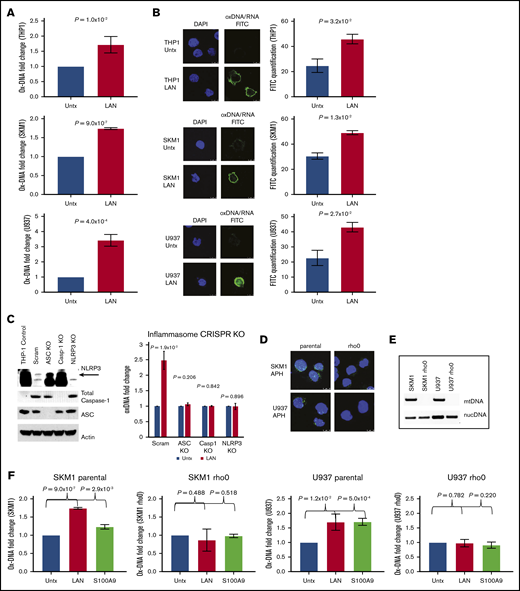
ox-DNA is released upon inflammasome activation. (A) Cell-free ox-DNA levels were analyzed by ELISA in THP1, SKM1, and U937 cells treated with lipopolysaccharide (LPS), adenosine triphosphate (ATP), and nigericin (collectively referred to as LAN), demonstrating increased ox-DNA in stimulated vs untreated (Untx) controls (mean ± SD of 3 independent experiments). (B) Confocal IF showing increased cytosolic ox-DNA in LAN-stimulated cells compared with untreated controls (DAPI; ox-DNA/RNA; magnification ×2520). Images are representative micrographs. (C) Western blot of CRISPR knockout (KO) cells of NLRP3 (top band), full-length caspase-1 (Casp1), and ASC. The lack of cell-free ox-DNA released was analyzed by ELISA after treatment with LAN (mean ± SD of 3 independent experiments). (D) Decreased BrdU (green) incorporation in rho0 cells by IF (DAPI, blue). (E) PCR amplification of nuclear DNA (nucDNA) or mitochondrial genes of DNA isolated from rho0 and parental cell lines. (F) ox-mtDNA levels assessed by ELISA in parental and rho0 cells after treatment with LAN or rhS100A9 (mean ± SD of 3 independent experiments). Scram, scrambled.
ox-DNA is released upon inflammasome activation. (A) Cell-free ox-DNA levels were analyzed by ELISA in THP1, SKM1, and U937 cells treated with lipopolysaccharide (LPS), adenosine triphosphate (ATP), and nigericin (collectively referred to as LAN), demonstrating increased ox-DNA in stimulated vs untreated (Untx) controls (mean ± SD of 3 independent experiments). (B) Confocal IF showing increased cytosolic ox-DNA in LAN-stimulated cells compared with untreated controls (DAPI; ox-DNA/RNA; magnification ×2520). Images are representative micrographs. (C) Western blot of CRISPR knockout (KO) cells of NLRP3 (top band), full-length caspase-1 (Casp1), and ASC. The lack of cell-free ox-DNA released was analyzed by ELISA after treatment with LAN (mean ± SD of 3 independent experiments). (D) Decreased BrdU (green) incorporation in rho0 cells by IF (DAPI, blue). (E) PCR amplification of nuclear DNA (nucDNA) or mitochondrial genes of DNA isolated from rho0 and parental cell lines. (F) ox-mtDNA levels assessed by ELISA in parental and rho0 cells after treatment with LAN or rhS100A9 (mean ± SD of 3 independent experiments). Scram, scrambled.
ox-DNA is of mitochondrial origin
Next, we investigated whether cytosolic ox-DNA released upon inflammasome activation is of mitochondrial or nuclear origin. To this end, we depleted mtDNA to generate Rho0 cells. This was accomplished by culturing cell lines in the presence of low levels of EtBr to block mtDNA replication via inhibition of DNA polymerase γ.21,29 The absence of BrdU incorporation after treatment with APH, which inhibits nuclear DNA replication, was assessed by IF, and depletion of mtDNA in the Rho0 cells was confirmed (Figure 2D). Loss of mtDNA was further confirmed by PCR using mitochondrial or nuclear gene–specific primers on DNA isolated from Rho0 cells (Figure 2E). To demonstrate that the extracellular ox-DNA is of mitochondrial origin, we treated Rho0 and parental cells with either LAN or rhS100A9, a DAMP and TLR4 ligand, to stimulate inflammasome assembly. We found that ox-DNA was not released by Rho0 cells upon inflammasome activation, whereas ox-DNA was released by parental cells (SKM1 parental: vehicle vs LAN, P = 9.0 × 10⁻⁷; vehicle vs S100A9, P = 2.9 × 10⁻³; SKM1 rho0: vehicle vs LAN, P = .488; vehicle vs S100A9, P=.518; U937 parental: vehicle vs LAN, P = 1.2 × 10⁻²; vehicle vs S100A9, P = 5.0 × 10⁻⁴; U937 rho0: vehicle vs LAN, P = .782; vehicle vs S100A9, P = .220) (Figure 2F; supplemental Figure 5) demonstrating that mtDNA is dispensable for TLR-induced inflammasome activation of the Rho0 cells because these cells lack mtDNA. These data confirm that the ox-DNA released upon inflammasome activation is mtDNA.
Levels of ox-mtDNA are elevated in PB plasma of MDS patients
NLRP3-inflammasome–directed pyroptosis is responsible for the extensive medullary cell death and the cytopenias characteristic of LR MDS.3 To determine whether ox-mtDNA liberated from pyroptotic HSPCs is demonstrable in MDS patient plasma, we first performed PCR using mtDNA– and nuclear DNA–specific primers on cell-free DNA isolated from MDS patient plasma. We found substantial amplification of mitochondrial genes in PB plasma; however, there was little or no amplification of nuclear genes, indicating that the cell-free DNA was of mitochondrial origin (Figure 3A; supplemental Figure 6). This was further confirmed by immunoprecipitation of ox-DNA in MDS patient and normal BM plasma and the detection by immunoblot of only mitochondrial-associated protein (TFAM), but not the nuclear protein histone H3 (supplemental Figure 7). Collectively, these data demonstrate that the ox-DNA was of mitochondrial origin. We then used an ELISA to quantitate ox-mtDNA in patient plasma and compared levels in paired patient BM and PB plasma. Log10-transformed, glucose-adjusted (to account for possible changes arising from hyperglycemia-induced inflammasome activation30,31 ) ox-mtDNA was detected in both PB and BM plasma with significantly higher levels found in BM plasma (P = 1.0 × 10⁻³), with a positive correlation among paired samples (r = 0.339; P = 4.0 × 10⁻³; n = 71) (Figure 3 B-C). We next quantified ox-mtDNA in PB plasma from MDS patients compared with age-matched healthy donors (Table 1).32 We found no robust differences in log10-transformed, glucose-adjusted ox-mtDNA levels based on sex, race, co-existing autoimmune diseases, alcohol consumption, or tobacco usage (supplemental Figure 8). Log10-transformed, glucose-adjusted ox-mtDNA levels were significantly higher in MDS patients (n = 176) compared with healthy donors (n = 29; P = 1.0 × 10−42), findings that were validated in an independent cohort of 113 MDS patients and 30 healthy donors (P = 1.0 × 10⁻²⁶) (Figure 3D; Table 2). Moreover, log10-transformed, glucose-adjusted levels of ox-mtDNA were highest in LR MDS patients (n = 162) compared with HR MDS patients (n = 14; P = 2.0 × 10⁻⁴), consistent with greater medullary pyroptosis.3 These findings were validated in a separate independent cohort (LR MDS, n = 66; HR MDS, n = 47; P = 3.0 × 10⁻³) (Figure 3E; Table 2). To determine the sensitivity and specificity of ox-mtDNA as a disease-specific biomarker for MDS, we performed an ROC/AUC analysis and found that log10-transformed, glucose-adjusted ox-mtDNA concentration is a sensitive and specific biomarker in patients with MDS when compared with healthy donors (all MDS AUC, 0.964; threshold, 0.541; sensitivity, 0.899; specificity, 0.928; HR MDS AUC, 0.974; LR MDS AUC, 0.959) (Figure 3F).
![ox-mtDNA is elevated in PB plasma from patients with MDS. (A) DNA isolated from PB plasma of MDS patients was amplified with nuclear or mitochondrial primers demonstrating that cell-free DNA is of mitochondrial origin. Representative image of 8 independent MDS samples. Log10-transformed, glucose-adjusted levels of ox-mtDNA in PB and BM plasma from patients with MDS (B), and correlation with PB and BM within a given MDS sample (C; shading is 95% confidence bands for the linear regression), and in patients compared with controls in both discovery and validation sets (D-E). Box and whisker plots denoting median and variability outside the lower and upper bound. (F) ROC/AUC analyses of ox-mtDNA in patients with MDS compared with healthy controls. Log10-transformed, glucose-adjusted levels of ox-mtDNA stratified by number of severe cytopenias (0-4) (G) (white blood cell [WBC] count, <5 × 10⁴; absolute neutrophil count [ANC], <0.80 × 10⁹/L; hemoglobin [HgB], <10 g/dL; platelets, <100 × 109/L) and severity of BM fibrosis (H). Mean ± SEM. Df, dilution factor.](https://ash.silverchair-cdn.com/ash/content_public/journal/bloodadvances/5/8/10.1182_bloodadvances.2020003475/1/m_advancesadv2020003475f3.png?Expires=1769599537&Signature=s-a2upu6-v0VZmojLosMmyRvP4~MAVuSA8w8P6w1EbyrqUzLWlKDQHl8z~ViYadS2qgJ3qn65pMwBhVj3lLj~a7pNNHpx7PGnTu2xlILcDYwqH6UKThH8bUHypePDat2fYaAYbh2XxsOG8gL16AS~Mc70LlsyPNNNtKIiItEf3jRt-a373nljSoozD7xnpCcBrK8LpjSJ2HSulFd2CCSumgDCVGRym0DpbF00ShmNFSz1Auw1jJG3DfSjdq0Id4CMpj~vafMSIsDeRTWewLNcHT7v33ORc1eQovppueIxx-5aMor5BkmLGJS3BvH-hKOdbGFSQhgSU7FkxuVozVBTA__&Key-Pair-Id=APKAIE5G5CRDK6RD3PGA)
ox-mtDNA is elevated in PB plasma from patients with MDS. (A) DNA isolated from PB plasma of MDS patients was amplified with nuclear or mitochondrial primers demonstrating that cell-free DNA is of mitochondrial origin. Representative image of 8 independent MDS samples. Log10-transformed, glucose-adjusted levels of ox-mtDNA in PB and BM plasma from patients with MDS (B), and correlation with PB and BM within a given MDS sample (C; shading is 95% confidence bands for the linear regression), and in patients compared with controls in both discovery and validation sets (D-E). Box and whisker plots denoting median and variability outside the lower and upper bound. (F) ROC/AUC analyses of ox-mtDNA in patients with MDS compared with healthy controls. Log10-transformed, glucose-adjusted levels of ox-mtDNA stratified by number of severe cytopenias (0-4) (G) (white blood cell [WBC] count, <5 × 10⁴; absolute neutrophil count [ANC], <0.80 × 10⁹/L; hemoglobin [HgB], <10 g/dL; platelets, <100 × 109/L) and severity of BM fibrosis (H). Mean ± SEM. Df, dilution factor.
ox-mtDNA is elevated in PB plasma from patients with MDS. (A) DNA isolated from PB plasma of MDS patients was amplified with nuclear or mitochondrial primers demonstrating that cell-free DNA is of mitochondrial origin. Representative image of 8 independent MDS samples. Log10-transformed, glucose-adjusted levels of ox-mtDNA in PB and BM plasma from patients with MDS (B), and correlation with PB and BM within a given MDS sample (C; shading is 95% confidence bands for the linear regression), and in patients compared with controls in both discovery and validation sets (D-E). Box and whisker plots denoting median and variability outside the lower and upper bound. (F) ROC/AUC analyses of ox-mtDNA in patients with MDS compared with healthy controls. Log10-transformed, glucose-adjusted levels of ox-mtDNA stratified by number of severe cytopenias (0-4) (G) (white blood cell [WBC] count, <5 × 10⁴; absolute neutrophil count [ANC], <0.80 × 10⁹/L; hemoglobin [HgB], <10 g/dL; platelets, <100 × 109/L) and severity of BM fibrosis (H). Mean ± SEM. Df, dilution factor.
Summary statistics for PB plasma log10-transformed, glucose-corrected ox-mtDNA in patients and healthy controls
| n | Mean | Median | SD | P compared with | ||||
|---|---|---|---|---|---|---|---|---|
| Normal | LR MDS | HR MDS | MDS | |||||
| Healthy | 29 | 1.5765 | 1.585941 | 0.15 | NA | 6.9 × 10–44 | 1.1 × 10⁻⁷ | 1.23 × 10–42 |
| LR MDS | 162 | 2.557 | 2.481877 | 0.38 | 6.86 × 10–44 | NA | 2.1 × 10⁻⁴ | NA |
| HR MDS | 14 | 2.2089 | 2.20 | 0.27 | 1.1 × 10⁻⁷ | 2.1 × 10⁻⁴ | NA | NA |
| MDS | 176 | 2.5275 | 2.452618 | 0.38 | 1.2 × 10–42 | NA | NA | NA |
| ALL* | 6 | 1.8149 | 1.862336 | 0.41 | 4.4 × 10⁻² | 1.8 × 10⁻⁴ | 3.6 × 10⁻² | 2.7 × 10⁻⁴ |
| Anemia* | 6 | 1.9285 | 1.88186592 | 0.18 | 7.0 × 10⁻⁴ | 2.2 × 10⁻⁴ | 3.7 × 10⁻² | 3.3 × 10⁻⁴ |
| CHIP | 25 | 2.0085 | 2.0347573 | 0.18 | 2.5 × 10⁻¹² | 2.4 × 10⁻¹⁷ | 2.0 × 10⁻² | 2.5 × 10⁻¹⁶ |
| CLL | 45 | 2.5463 | 2.527587 | 0.27 | 1.2 × 10⁻³⁰ | 8.3 × 10⁻¹ | 3.6 × 10⁻⁴ | 7.0 × 10⁻¹ |
| CML* | 9 | 1.958 | 1.984861 | 0.31 | 9.2 × 10⁻⁴ | 6.0 × 10⁻⁵ | 6.0 × 10⁻² | 1.0 × 10⁻⁴ |
| CMML | 16 | 2.2366 | 2.179886 | 0.29 | 4.9 × 10⁻⁸ | 5.3 × 10⁻⁴ | 7.9 × 10⁻¹ | 1.3 × 10⁻³ |
| De novo AML | 12 | 1.8792 | 1.770521 | 0.26 | 2.3 × 10⁻³ | 6.9 × 10⁻⁷ | 4.1 × 10⁻³ | 1.3 × 10⁻⁶ |
| ET | 18 | 1.9892 | 1.975373 | 0.16 | 2.1 × 10⁻¹⁰ | 2.8 × 10⁻¹⁵ | 1.2 × 10⁻² | 2.0 × 10⁻¹⁴ |
| LGL | 17 | 2.1418 | 2.161461 | 0.28 | 1.5 × 10⁻⁷ | 1.3 × 10⁻⁵ | 5.0 × 10⁻¹ | 3.3 × 10⁻⁵ |
| MF | 11 | 1.785 | 1.570546 | 0.44 | 1.5 × 10⁻¹ | 1.4 × 10⁻⁴ | 1.3 × 10⁻² | 2.0 × 10⁻⁴ |
| Myeloma | 18 | 1.9017 | 1.943949 | 0.11 | 1.1 × 10⁻¹⁰ | 1.1 × 10⁻²⁶ | 7.2 × 10⁻⁴ | 1.9 × 10⁻²⁵ |
| PV | 18 | 1.9292 | 1.967492 | 0.18 | 8.9 × 10⁻⁸ | 2.3 × 10⁻¹⁴ | 2.5 × 10⁻³ | 1.2 × 10⁻¹³ |
| Secondary AML | 26 | 1.984 | 1.973814 | 0.24 | 4.1 × 10⁻⁹ | 1.1 × 10⁻¹³ | 1.4 × 10⁻² | 6.5 × 10⁻¹³ |
| T2D | 25 | 1.7453 | 1.80 | 0.20 | 1.4 × 10⁻³ | 2.9 ×10⁻²² | 8.2 × 10⁻⁶ | 2.3 × 10⁻²¹ |
| Normal discovery | 29 | 1.5765 | 1.58 | 0.15 | 6.1 × 10⁻¹† | |||
| Normal validation | 30 | 1.5558 | 1.53 | 0.15 | ||||
| MDS discovery | 176 | 2.5275 | 2.45 | 0.38 | 8.4 × 10⁻¹⁰† | |||
| MDS validation | 113 | 2.2133 | 2.13 | 0.47 | ||||
ALL, acute lymphocytic leukemia; AML, acute myeloid leukemia; CHIP, clonal hematopoiesis of indeterminate potential; CLL, chronic lymphocytic leukemia; CML, chronic myelogenous leukemia; ET, essential thrombocytosis; LGL, large granular lymphocytic leukemia; MF, myelofibrosis; NA, not available; PV, polycythemia vera; T2D, type 2 diabetes.
P values represent Kruskal-Wallis significance values because of low numbers of patients.
P values compare discovery to validation patients and discovery normal controls to validation controls.
Correlation of ox-mtDNA and clinical features
In addition, log10-transformed, glucose-adjusted ox-mtDNA is negatively correlated with the number of cytopenias (n = 40; white blood cell count, absolute neutrophil count, hemoglobin, platelets [n = 0-4]; r = −0.3243; P = 4.12 × 10⁻²) (Figure 3G; supplemental Figure 9). Furthermore, log10-transformed, glucose-adjusted ox-mtDNA is correlated with white blood cell counts (n = 32; r = 0.3575; P = 4.46 × 10⁻²), platelet count (n = 33; r = 0.5388; P = 1.20 × 10⁻³), absolute monocyte count (n = 31; r = 0.3801; P = .0349), and absolute lymphocyte count (n = 35; r = 0.3367; P = 4.80 × 10⁻²). Of the MDS patients with absolute neutrophil count data, there is a significant difference in log10-transformed, glucose-adjusted ox-mtDNA between the normal and thrombocytopenic (<100 × 109/L) patients (n = 33; P = 4.0 × 10⁻⁴) as well as between normal and neutropenic (<0.80 × 10⁹/L) patients (n = 35; P = 4.59 × 10⁻²) (supplemental Figure 9). In addition, log10-transformed, glucose-adjusted ox-mtDNA increased directly with the severity of BM fibrosis (normal, P = 1.41 × 10⁻⁴; mild, P = 7.31 × 10⁻⁵; moderate, P = 8.55 × 10⁻⁴) (Figure 3H). No robust differences in ox-mtDNA levels were demonstrable based on World Health Organization subtype or cytogenetic risk group (supplemental Figure 10; supplemental Table 1). However, within the excess blast (EB) subtypes, EB1 was significantly elevated compared with EB2 (EB1, n = 17; EB2, n = 6; P = 3.0 × 10⁻²), in agreement with the more progressive disease state. We found that patients with transcriptional gene mutations carried significantly lower PB log10-transformed, glucose-adjusted ox-mtDNA compared with patients without transcriptional gene mutations (P = .04; supplemental Table 2), and patients who harbor U2AF1 mutations vs WT had significantly higher ox-mtDNA levels (P = .05; supplemental Table 3), although the number of positive patients was low (n = 3); no other correlations with mutational status and ox-mtDNA were observed (supplemental Figure 11; supplemental Tables 2 and 3).
Plasma ox-mtDNA concentrations correlate with biomarkers of inflammasome activation
S100A9 and S100A8 are key cell-extrinsic inflammasome-activating, TLR4-engaging DAMPs in MDS, levels of which can serve as an index of pyropotosis.3,33,34 To evaluate the specificity of ox-mtDNA as a measure of inflammasome activation and pyroptosis, we analyzed the relationship between ox-mtDNA and these DAMPs. Patient plasma ox-mtDNA concentration significantly correlated with S100A8 (n = 134; log10-transformed, glucose-adjusted; r = 0.62; P = 2.0 × 10⁻¹⁵) and S100A9 (n = 134; log10-transformed, glucose-adjusted; r = 0.4; P = 2.0 × 10⁻⁶) concentration (Figure 4A). We previously demonstrated that the percentage of log10-transformed, glucose-adjusted ASC specks is a reliable index of medullary pyroptosis execution in MDS and potentially a disease-specific biomarker.35 ASC specks significantly and positively correlated with ox-mtDNA (n = 134; r = 0.59; P = 7.0 × 10⁻¹⁴) (Figure 4B). We found that the sensitivity and specificity of ox-mtDNA could not be improved by combining ox-mtDNA and ASC speck levels in the ROC analysis of MDS patients compared with normal controls; ox-mtDNA alone had the greatest utility as a biomarker (MDS AUC, 0.940; LR MDS AUC, 0.950; HR MDS AUC, 0.934) (Figure 4C). These findings indicate that plasma ox-mtDNA concentrations demonstrate a direct correlation with validated indices of pyroptosis, such as ASC specks, S100A9, and S100A8, thereby demonstrating the utility of ox-mtDNA as a biologically relevant biomarker of inflammasome activation.
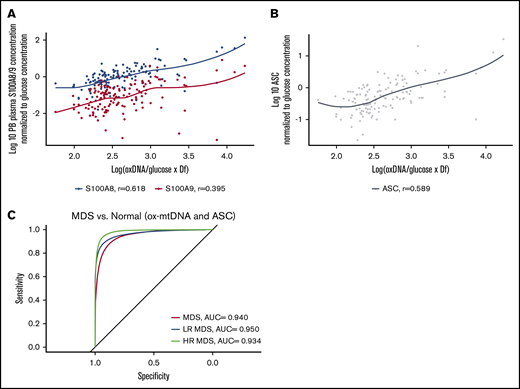
ox-mtDNA levels correlate with known biomarkers of inflammasome activation. Log10-transformed, glucose-adjusted ox-mtDNA is correlated with known MDS inflammasome activating alarmins in S100A8 and S100A9 (A) and ASC (B) specks in patient PB plasma. (C) ROC/AUC analyses of ox-mtDNA and ASC speck percentage in MDS patients vs controls.
ox-mtDNA levels correlate with known biomarkers of inflammasome activation. Log10-transformed, glucose-adjusted ox-mtDNA is correlated with known MDS inflammasome activating alarmins in S100A8 and S100A9 (A) and ASC (B) specks in patient PB plasma. (C) ROC/AUC analyses of ox-mtDNA and ASC speck percentage in MDS patients vs controls.
Plasma concentration of ox-mtDNA distinguishes MDS from other hematologic malignancies
To determine whether elevations in ox-mtDNA plasma levels are specific for MDS, we quantified ox-mtDNA concentration in plasma from patients with non-MDS hematologic malignancies (Figure 5A; Table 2). The inflammasome can be activated as a result of hyperglycemia, which promotes insulin resistance30,31 ; therefore, we also analyzed a cohort of 25 T2D plasma samples from patients with no history of cancer. Log10-transformed, glucose-adjusted PB plasma concentrations of ox-mtDNA were significantly higher in T2D patients than in controls, but they were significantly lower than in MDS patients (n = 25; P = 2.3 × 10⁻²¹). Log10-transformed, glucose-adjusted PB plasma ox-DNA levels across disease groups were highest in MDS (n = 177) compared with all other non-MDS hematologic malignancies, including acute lymphoblastic leukemia (n = 6; P = 2.7 × 10⁻⁴), de novo acute myeloid leukemia (n = 12; P = 1.3 × 10⁻⁶) and secondary acute myeloid leukemia (n = 26; P = 6.5 × 10⁻¹³), chronic myeloid leukemia (n = 9; P = 1.0 × 10⁻⁴), chronic myelomonocytic leukemia (n = 16; P = 1.3 × 10⁻³), large granular lymphocytic leukemia (n = 17; P = 3.3 × 10⁻⁵), myelofibrosis (n = 11; P = 2.0 × 10⁻⁴), essential thrombocythemia (n = 18; P = 2.0 × 10⁻¹⁴), polycythemia vera (n = 18; P = 1.2 × 10⁻¹³), and multiple myeloma (n = 18; P = 1.9 × 10⁻²⁵) and was shown to be mitochondrial in nature by PCR except for the CLL cohort (Figure 5A; Table 2; supplemental Figure 12). Of note, MDS ox-mtDNA levels were not significantly higher than levels in patients with CLL (n = 45; P = .7). Elevations in plasma ox-DNA were previously reported in CLL and were specifically linked to poor-risk chromosomal abnormalities associated with oxidative injury and ROS.36-38 When organized into more-favorable (normal, del(13q), trisomy 12) and less-favorable (del(6q), del(11q), and del(17p)) cytogenetic groups, the less-favorable cytogenetic CLL patients displayed significantly higher levels of ox-DNA (P = 3.3 × 10⁻²) (supplemental Figure 13). In addition, the less-favorable cohort represented a disproportionately high number of our CLL samples.36 Within our CLL cohort, cell-free DNA of nuclear origin was detected in addition to mtDNA. We further investigated key nonmalignant reactive conditions, including aplastic anemia and pure red cell aplasia (anemia), which exhibit cytopenias without hypercellular and dysplastic BM, as well as in individuals with CHIP.39-41 Patients with CHIP or anemia have significantly higher log10-transformed, glucose-adjusted ox-mtDNA PB levels compared with normal donors (n = 25; P = 2.45 × 10⁻¹²; n = 6; P = 7.00 × 10⁻⁴) but significantly lower levels than patients with MDS (patients with CHIP vs MDS, P = 2.48 × 10⁻¹⁶; patients with anemia vs MDS, P = 3.30 × 10⁻⁴; Figure 5A; Table 2). We then evaluated whether ox-mtDNA is a specific marker for MDS compared with non-MDS hematologic disorders (excluding CLL) by using a fivefold cross-validation (k = 5) repeated 30 times. The cross-validation showed that ox-mtDNA was indeed a sensitive and specific biomarker for MDS compared with the other hematologic malignancies (MDS AUC, 0.893; LR MDS AUC, 0.909; HR MDS AUC, 0.720) (Figure 5B). Similarly, ox-mtDNA is highly specific and sensitive for MDS vs the reactive conditions (T2D, anemia, CHIP) per cross-validation (MDS AUC, 0.940; LR MDS AUC, 0.960; HR MDS AUC, 0.810) (Figure 5C). Importantly, we found that elevation of plasma ox-mtDNA was specific for MDS and was not found in other hematologic malignancies with dyshematopoiesis such as myelofibrosis, acute myeloid leukemia, and CMML. These data suggest that elevated levels of PB plasma ox-mtDNA are specific to MDS and may be used as a marker for pyroptosis.
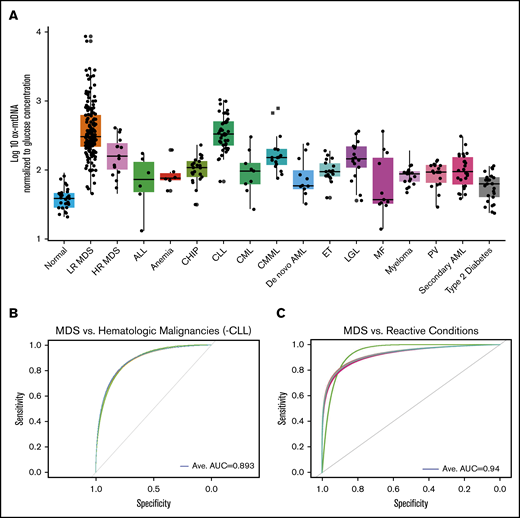
ox-mtDNA is higher in PB plasma from patients with MDS compared with patients who have other hematologic diseases. (A) Box and whisker plot denoting median and variability of lower and upper bound of PB plasma log10-transformed, glucose-adjusted ox-mtDNA levels are significantly increased in patients with MDS compared with healthy donors, all other hematologic malignancies (except CLL), and in individuals with T2D. Cross-validation analysis of MDS compared with non-MDS hematologic controls (excluding CLL) (B) and reactive conditions (T2D, CHIP, anemia) (C). Anemia includes both aplastic and pure red blood cell anemia. Ave, average.
ox-mtDNA is higher in PB plasma from patients with MDS compared with patients who have other hematologic diseases. (A) Box and whisker plot denoting median and variability of lower and upper bound of PB plasma log10-transformed, glucose-adjusted ox-mtDNA levels are significantly increased in patients with MDS compared with healthy donors, all other hematologic malignancies (except CLL), and in individuals with T2D. Cross-validation analysis of MDS compared with non-MDS hematologic controls (excluding CLL) (B) and reactive conditions (T2D, CHIP, anemia) (C). Anemia includes both aplastic and pure red blood cell anemia. Ave, average.
Discussion
DAMP-induced sterile inflammation in the BM of MDS patients leads to unrestrained inflammasome activation, resulting in HPSC lytic cell death by pyroptosis and ineffective hematopoiesis. Intracellular ox-mtDNA associates with NLRP3 to stabilize the protein in an activated state.6 We found that significant elevation of ox-mtDNA in PB plasma is found in MDS, which is consistent with the excess inflammasome activity previously described in these malignancies. We also show that ox-mtDNA is liberated into cytosolic pools by somatic gene mutations of varied functional classes, including both chromatin remodeling (TET2) and messenger RNA–splicing genes (SRSF2). Srsf2P95H and Tet2−/− are common somatic gene mutations in LR MDS, and although they represent functionally distinct gene classes, each elicits the same biological response with respect to mtDNA oxidation and release. Mitochondrial liberation of cytosolic ox-DNA is also induced by TLR ligand activation of myddosome (MyD88) signaling by decreasing mitochondrial membrane potential without releasing cytochrome c.23 TLR-dependent priming signals initiate the synthesis and oxidation of newly synthesized mtDNA, which is required for NLRP3 activation via MyD88/TIR-domain-containing adapter-inducing interferon-β (TRIF)- and interferon regulatory factor 1 (IRF1)-mediated transcriptional upregulation of the mitochondrial deoxyribonucleotide kinase, cytidine/uridine monophosphate kinase 2 (CMPK2), the rate-limiting enzyme in mtDNA synthesis.6 IRF1 binds to the promoter of CMPK2 to induce TLR-driven CMPK2 upregulation. Newly synthesized mtDNA does not undergo compaction into a highly condensed nucleoid structure by TFAM, which may account for its susceptibility to oxidation and nuclease fragmentation. A second NLRP3 activation signal is then required for the calcium-dependent association of ASC with NLRP3 on the mitochondrial surface, resulting in inflammasome complex assembly and activation. Importantly, although other studies have proposed that ox-mtDNA is an obligate intracellular effector of NLRP3 inflammasome activation, our findings that inflammasome activation by TLR4 ligands is preserved in mtDNA-depleted rho0 cells indicates that intracellular mtDNA is dispensable for inflammasome activation.6,42
Our investigations show that plasma ox-mtDNA is a biomarker of the extent of medullary pyroptosis in MDS that directly correlates with other validated indices of pyroptosis, such as concentrations of S100A8 and S100A9 and circulating ASC specks.35 Thus, ox-mtDNA may serve as a treatment response indicator particularly with respect to compounds that specifically target inflammasome activity and pyroptosis. Of particular importance, inclusion of ASC specks into the ROC analysis did not improve the sensitivity or specificity for MDS over ox-mtDNA alone, which suggests broader clinical utility of ox-mtDNA. Although ox-DNA is elevated in CLL, we show that a significant fraction of this DNA is nuclear and readily distinguished from MDS by an accompanying B-lineage lymphocytosis. CLL B cells also display elevations in cellular ox-mtDNA owing in part to eNOX generation of peroxide in response to B-cell receptor signaling that accumulates as a result of low catalase expression, thereby conferring redox hypersensitivity.43 Importantly, we demonstrate that elevated ox-mtDNA is greatest in MDS and is significantly increased compared with overlapping syndromes and reactive conditions, including CMML, CHIP, and anemia. Interestingly, CHIP patients displayed significantly higher log10-transformed, glucose-adjusted ox-mtDNA PB levels compared with normal donors; however, they remained significantly lower than the levels in MDS, reflecting markedly smaller clone size and allele burden. This may be clinically useful as identification of a PB biomarker that can distinguish between these reactive conditions, and MDS could be used in lieu of more invasive BM aspiration diagnostics. Patients in our CMML cohort had both MDS- and myeloproliferative neoplasm–type CMML. They harbored several common mutations to MDS (Tet2, Srsf2, and others), but lower ox-mtDNA levels are likely attributed to monocyte resistance to pyroptosis.44 We show significant differences in levels of ox-mtDNA among these disorders, but one limitation of the study is the relatively small cohort numbers in the reactive conditions, as well as limited conditions studied because of a lack of resources. Future studies are warranted to validate the findings described here and investigate additional reactive conditions.
Future studies should elucidate the functional role of ox-mtDNA in MDS HSPC inflammasome activation. Numerous studies have demonstrated that mitochondrial contents may serve as danger signals that incite innate immune activation, which leads to inflammatory pressure in trauma or injury or inflammatory disorders such as autoimmune disease and others.45 Delineation of the precise mechanisms by which ox-mtDNA may serve as a danger signal to potentiate inflammasome activation in MDS will underscore its potential as a novel therapeutic strategy in these disorders and will address a currently unmet need because targeted therapies are severely limited. Investigations are currently underway to identify the mechanisms by which ox-mtDNA licenses the NLRP3 inflammasome and subsequent inflammatory response that leads to impaired hematopoiesis in MDS. To conclude, we have identified a highly sensitive and specific biomarker for MDS that requires only PB analysis using a standard and optimizable ELISA. The unique feature of inflammasome activation in MDS compared with other hematologic disorders allows exploitation for novel therapeutic strategies and biomarkers such as ox-mtDNA that can be used as both diagnostic tools and response indicators.
To request data, please contact Kathy L. McGraw via e-mail at kathy.mcgraw@moffitt.org.
Acknowledgments
The authors thank laboratory interns Alexandra R. Calescibetta, Nina S. Hong, Tommy Pham, and Robert P. Dalton for their assistance, and they acknowledge Eric Lau and Kenneth Wright who were instrumental in preparing this manuscript. The visual abstract was created with BioRender.
This study was partially funded by the Eastern Cooperative Oncology Group/American College of Radiology Imaging Network Cancer Research Group Study (E2905 Intergroup Study), by grants from the National Institutes of Health, National Cancer Institute (NCI) (CA180820) and the NCI-designated Comprehensive Cancer Center (P30-CA076292), from the Leukemia & Lymphoma Society (7018-19), and from the Flow Cytometry, Microscopy, and Tissue Core Facilities at the H. Lee Moffitt Cancer Center & Research Institute.
Authorship
Contribution: G.A.W. designed and performed research, collected, interpreted, and analyzed the data, and wrote and revised the manuscript; F.A.-A., J.J., and B.L.F. performed statistical analyses and interpreted the data; A.F.M., N.D.V., N.B.L., B.S.M., N.H.A.A., and A.L.A. performed the research and collected the data; E.P., J.P.-I., E.M., V.S., O.K., M.F., and P.F. provided clinical specimens; and A.F.L. and K.L.M. designed research, analyzed and interpreted data, and authored revisions to the manuscript.
Conflict-of-interest disclosure: The laboratory of A.F.L. has received unrelated support from Celgene, Genentech, and the Leukemia & Lymphoma Society. A.F.L. has served as a consultant for Celgene, the International Personalized Cancer Center (IPCC), Precision BioSciences, Prelude Therapeutics, and CTI Biopharma; serves on the scientific advisory boards of Aileron and Cell Biology and Molecular Genetics; and is a member of the board of directors for the MDS Foundation. E.P. has received research funding from Kura Oncology, Incyte Corporation, and KaloBios Pharmaceuticals, and serves as a consultant for Stemline Therapeutics and Blueprint Medicines. J.P.-I. has received research funding from TG Therapeutics, Sunesis, and MEI Pharma, Inc, and has received consulting fees from Janssen, AbbVie, AstraZeneca, Takeda, and Sanofi. The remaining authors declare no competing financial interests.
Correspondence: Kathy L. McGraw, H. Lee Moffitt Cancer Center & Research Institute, 12902 Magnolia Dr, Tampa, FL 33612; e-mail: kathymcgraw.phd@gmail.com.

