

Key Points
Cells harboring the MPN-associated CALR mutation show cell-autonomous activation of the IL-6 pathway.
Inhibition of IL-6 signaling may have therapeutic potential in MPNs.

Abstract
Calreticulin (CALR), an endoplasmic reticulum–associated chaperone, is frequently mutated in myeloproliferative neoplasms (MPNs). Mutated CALR promotes downstream JAK2/STAT5 signaling through interaction with, and activation of, the thrombopoietin receptor (MPL). Here, we provide evidence of a novel mechanism contributing to CALR-mutated MPNs, represented by abnormal activation of the interleukin 6 (IL-6)-signaling pathway. We found that UT7 and UT7/mpl cells, engineered by clustered regularly interspaced short palindromic repeats (CRISPR)/CRISPR-associated protein 9 (Cas9) to express the CALR type 1–like (DEL) mutation, acquired cytokine independence and were primed to the megakaryocyte (Mk) lineage. Levels of IL-6 messenger RNA (mRNA), extracellular-released IL-6, membrane-associated glycoprotein 130 (gp130), and IL-6 receptor (IL-6R), phosphorylated JAK1 and STAT3 (p-JAK1 and p-STAT3), and IL-6 promoter region occupancy by STAT3 all resulted in increased CALR DEL cells in the absence of MPL stimulation. Wild-type, but not mutated, CALR physically interacted with gp130 and IL-6R, downregulating their expression on the cell membrane. Agents targeting gp130 (SC-144), IL-6R (tocilizumab [TCZ]), and cell-released IL-6 reduced proliferation of CALR DEL as well as CALR knockout cells, supporting a mutated CALR loss-of-function model. CD34+ cells from CALR-mutated patients showed increased levels of IL-6 mRNA and p-STAT3, and colony-forming unit–Mk growth was inhibited by either SC144 or TCZ, as well as an IL-6 antibody, supporting cell-autonomous activation of the IL-6 pathway. Targeting IL-6 signaling also reduced colony formation by CD34+ cells of JAK2V617F-mutated patients. The combination of TCZ and ruxolitinib was synergistic at very low nanomolar concentrations. Overall, our results suggest that target inhibition of IL-6 signaling may have therapeutic potential in CALR, and possibly JAK2V617F, mutated MPNs.
Introduction
Calreticulin (CALR) is a 46-kDa multicompartmental, prevalently endoplasmic reticulum (ER)-associated protein that regulates cellular responses important in wound healing, fibrosis, immune response, and cancer.1 The protein has 3 domains: the N-terminal domain, with chaperone activity; a central proline-rich (P) domain that has chaperone activity and binds calcium with high affinity; and a C-terminal domain that contains low-affinity, high-capacity calcium-binding sites and terminates with an ER retention/retrieval motif (KDEL).2 Within the ER lumen, CALR ensures proper folding of proteins and glycoproteins, and controls protein quality by preventing protein aggregation and facilitating progression of misfolded proteins to ubiquitin-mediated destruction.3 CALR knockout (KO) is lethal during embryogenesis due to defective heart development.4
Somatic mutations of CALR occur in 70% to 80% of patients with essential thrombocythemia and primary myelofibrosis (PMF) who lack JAK2V617F and MPL canonical mutations.5,6 CALR mutations are typically heterozygous, and involve the last protein exon, encoding for most of the C terminus. CALR mutations consist of >50 indel variants; of these, >80% are classified as type 1 (a 52-bp deletion, L367fs*46; DEL) and type 1–like, based on predicted helical secondary structure,7 or type 2 (a 5-bp insertion, K385fs*47; INS) and type 2–like.8,9 All CALR mutations create a +1-bp frameshift in exon 9 resulting in a novel C terminus. Type 1 mutations eliminate all negatively charged exon 9 amino acids, whereas some negatively charged amino acids remain in type 2 mutations, possibly accounting for differences in calcium-binding impairment; notably, the clinical phenotype is usually more severe in the type 1 mutation.9-12
The CALR mutation is detected in the long-term hematopoietic stem cell compartment, representing an early oncogenic event in the pathogenesis of CALRmut myeloproliferative neoplasms (MPNs). Animal models confirmed that expression of mutated CALR is sufficient to induce an MPN manifesting with thrombocytosis that, although not invariably, progresses to myelofibrosis.13-16 Recent studies showed that mutated CALR binds to the thrombopoietin (TPO) receptor (MPL) in the ER and on the outside of the cell, resulting in MPL aberrant activation.17-19 MPL engagement induces downstream activation of JAK/STAT signaling20 ; notably, splenomegaly reduction and symptomatic improvement were noted in CALRmut patients who received the JAK2/JAK1 inhibitor ruxolitinib, similar to patients with JAK2V617F or MPL mutation.21 However, prominent activation of the MAPK pathway in CALRmut cells was also reported.22
Expression of CALR in normal CD34+ cells increases as they differentiate to megakaryocytes (Mks)23 ; these findings, and the engagement of MPL by mutated CALR, may explain the prevalent involvement of the Mk lineage in CALRmut diseases. However, owing to the broad action of CALR in protein and calcium homeostasis, it is hypothesized that additional mechanisms may contribute to the phenotype of CALRmut MPNs. To address this point, we analyzed different cellular models, engineered by clustered regularly interspaced short palindromic repeats (CRISPR)/CRISPR-associated protein 9 (Cas9) genome editing to express CALR DEL, or with target deletion (KO) of CALR, as well as primary cells from CALRmut patients, and provide evidence that mutated CALR is involved in abnormal activation of the interleukin 6 (IL-6) pathway.
Methods
Cell lines and primary CD34+ cell culture
The granulocyte macrophage–colony-stimulating factor (GM-CSF)-dependent UT7 (Deutsche Sammlung von Mikroorganismen und Zellkulturen [DSMZ]) and GM-CSF and TPO-dependent UT7/mpl cells (kindly donated by W. Vainchenker, INSERM, Unité Mixte de Recherche, Institut Gustave Roussy, Villejuif, France) were routinely passed with GM-CSF. CD34+ cells were magnetically isolated from healthy donors’ cord blood (CB) and the blood and bone marrow of CALR- and JAK2V617F-mutated patients (see supplemental Table 1 for patient characteristics). Collection and processing of human samples was approved by the Azienda Ospedaliera-Universitaria Careggi Institutional Review Board (#14560) after obtaining informed written consent.
CRISPR/Cas9 gene editing and transfection
We generated CALR KO cells from CB CD34+ cells, UT7 and UT7/mpl cell lines, and CALR type 1 (DEL) variants from UT7 and UT7/mpl cells. To obtain KO variants, cells were transfected with pCMV-Cas9-GFP plasmid together with a guide sequence complementary to CALR exon 1. To generate DEL variants, cells were transfected with the pCMV-Cas9-GFP plasmid, a pU6 plasmid containing the guide RNA sequence complementary to a stretch of genomic DNA and an additional single-strand donor oligonucleotide allowing the knock-in of the specific mutation by homology-directed repair. Single green fluorescent protein–positive (GFP+) cells were sorted into individual wells of a 96-well plate. Individual clones were validated using polymerase chain reaction (PCR), Sanger sequencing, quantitative reverse transcription PCR (qRT-PCR), and western blot. For CRISPR/Cas9 genome editing of CB CD34+, GFP+ transfected cells were bulk sorted into a tube containing the appropriate medium. Transient overexpression of CALR wild-type (WT) and CALR DEL was obtained by transfecting UT7/mpl CALR KO cells with the following plasmids: p-CMV3-(N)Flag-CALR WT, p-CMV3-(N)Flag-CALR DEL, and an empty vector as control. Standard methods for DNA/RNA purification, Sanger sequencing, and qRT-PCR were used.
Cell proliferation and apoptosis measurements
An automated trypan blue dye exclusion system was used for enumerating live cells; cell-cycle distribution was determined by propidium iodide and apoptosis by annexin V/propidium iodide staining, followed by flow cytometry.
Induced Mk differentiation
UT7/mpl cells were induced to Mk differentiation without/with TPO for 7 days. Mk differentiation was assessed by CD41-phycoerythrin and CD61–fluorescein isothiocyanate expression with flow cytometry.
Flow cytometry analysis of CD41/CD61 expression
Standard methodology was used with appropriate, labeled antibodies, on unfixed cells.
Colony assays of primary hematopoietic progenitors
CD34+ cells were plated in cytokine-supplemented methylcellulose, for burst-forming unit erythroid (BFU-E) and colony-forming unit (CFU) granulocyte macrophage (CFU-GM), and collagen medium, for CFU-Mk generation.
Protein analysis
Immunoblot and immunoprecipitation was performed following standard methodology. Quantification of interleukin 6 (IL-6) in culture supernatants was performed using an enzyme-linked immunosorbent assay (ELISA) technique.
ChIP assay
The chromatin immunoprecipitation (ChIP) assay was performed using a commercially available ChIP assay kit. Immunoprecipitation of CALR WT, DEL, and KO UT7 and UT7/mpl cell extracts to assess IL-6 promoter region chromatin occupancy by STAT3 was performed with STAT3 antibody. The primers used for the PCR following ChIP are listed in supplemental Methods.
Confocal microscopy
Confocal microscopy was performed according to standard methodology, using glycoprotein 130 (gp130), IL-6 receptor (IL-6R), and phospho-STAT3 (p-STAT3) antibodies.
Statistical analysis
The Student t test or 1-way analysis of variance were used as appropriate; the P value was fixed at ≤.05.
A full description of methods and reagents is provided as supplemental Methods.
Results
Development and characterization of CRISPR/Cas9-edited CALR DEL and KO cell lines
We generated CALR DEL and KO UT7 and UT7/mpl cell lines by CRISPR/Cas9 technology. We generated a frameshift in CALR exon 9 gene, resulting in a STOP codon and the transcription of a type 1–like protein (now CALR DEL cells). The mutant clones were characterized by Sanger sequencing (Figure 1A), qRT-PCR, and western blotting. UT7 and UT7/mpl CALR DEL cells expressed mutated CALR of the expected size and sequence, lacking the KDEL motif (Figure 1B). We noticed faint expression levels of DEL CALR across several different clones analyzed (not shown in detail), despite CALR messenger RNA (mRNA) levels being comparable to WT parental cells (Figure 1B), suggesting that mutated protein is less stable than WT protein, as reported.22,24 CALR KO cells were obtained by either disruption of start codon ATG (UT7 cells) or introduction of a STOP codon in exon 1 (UT7/mpl cells) resulting in no CALR protein expression (Figure 1A-B).
![Development and characterization of CALR DEL and KO cell lines. (A) The strategy to obtain CALR KO (targeting exon 1) and DEL (targeting exon 9) UT7 and UT7/mpl cell lines with CRISPR/Cas9 genome editing; the resulting DNA sequence of genome-edited clones used in the study is reported below the sequence of WT CALR, or a typical del52 mutation, at corresponding DNA regions of interest for KO and DEL targeting. The ATG start codon is in bold and underlined; in the UT7 KO cell line, the ATG is removed whereas in UT7/mpl, the KO conditions were due to insertion of a TAG stop codon (in bold and red). The predicted sequence of the resulting DEL protein for UT7 and UT7/mpl is shown within a rectangle, with the novel sequence in red and the common C terminus underlined. (B) The expression of CALR mRNA and CALR protein in CALR WT (parental), DEL and KO UT7, and UT7/mpl cell lines was assessed, respectively, by qRT-PCR (top panel) and western blotting (bottom panel), using antibodies to either the common N-terminal or the C-terminal KDEL domain. Glyceraldehyde-3-phosphate dehydrogenase (GAPDH) was used for loading normalization; the asterisk points to mutant protein. (C-D) The GM-CSF–dependent UT7 and TPO-dependent UT7/mpl cells, either parental, CALR DEL, or KO, were seeded at 2 × 10⁵ cells per milliliter in cytokine-free medium. Living cells (×105/mL) were counted daily by trypan blue dye exclusion (top panels). Cell apoptosis was assessed at day 3 using the Annexin V–Fluoassay, and expressed as the percentage of annexin V+ cells over total (for UT7 [E] and UT7/mpl [F] cell lines, respectively). Data are the mean plus or minus SD of 3 independent experiments. All P values were determined by Student t test (*P < .05; **P < .01; ***P < .001).](https://ash.silverchair-cdn.com/ash/content_public/journal/bloodadvances/5/8/10.1182_bloodadvances.2020003291/1/m_advancesadv2020003291f1.png?Expires=1769107622&Signature=BBBBX3LWwNIhD5SnBxyd7c4QdZOPAEQd7xO0zT8zSjFd3pCVtNzaXlK-1eobXq2wyEUKAW4yQR95Jl0pZTyVh6J3gndDPJwnQXqyNmhsOYrxAoUxvt7eX7XDOekNMIVeUwLU-krDK1Mo5wmlrTJdB8ji2P0-YxjacqgTskOZJYLe4YVM4I-tU2io1LY52mNTvkgQ1Ik4YGWsa~Nza9VjFA9Os2~AfFIpTbfbkCPNNdHNXvenyWA0LtqY8LdMRr-iVhC3yA9DWrFuu-yiIXOmr6BoTZEcNkZBV9tdCC2dVec6PXcPqlxvR3ReOwq8wzsGEKM7iyGshNZzhisHfWY65g__&Key-Pair-Id=APKAIE5G5CRDK6RD3PGA)
Development and characterization of CALR DEL and KO cell lines. (A) The strategy to obtain CALR KO (targeting exon 1) and DEL (targeting exon 9) UT7 and UT7/mpl cell lines with CRISPR/Cas9 genome editing; the resulting DNA sequence of genome-edited clones used in the study is reported below the sequence of WT CALR, or a typical del52 mutation, at corresponding DNA regions of interest for KO and DEL targeting. The ATG start codon is in bold and underlined; in the UT7 KO cell line, the ATG is removed whereas in UT7/mpl, the KO conditions were due to insertion of a TAG stop codon (in bold and red). The predicted sequence of the resulting DEL protein for UT7 and UT7/mpl is shown within a rectangle, with the novel sequence in red and the common C terminus underlined. (B) The expression of CALR mRNA and CALR protein in CALR WT (parental), DEL and KO UT7, and UT7/mpl cell lines was assessed, respectively, by qRT-PCR (top panel) and western blotting (bottom panel), using antibodies to either the common N-terminal or the C-terminal KDEL domain. Glyceraldehyde-3-phosphate dehydrogenase (GAPDH) was used for loading normalization; the asterisk points to mutant protein. (C-D) The GM-CSF–dependent UT7 and TPO-dependent UT7/mpl cells, either parental, CALR DEL, or KO, were seeded at 2 × 10⁵ cells per milliliter in cytokine-free medium. Living cells (×105/mL) were counted daily by trypan blue dye exclusion (top panels). Cell apoptosis was assessed at day 3 using the Annexin V–Fluoassay, and expressed as the percentage of annexin V+ cells over total (for UT7 [E] and UT7/mpl [F] cell lines, respectively). Data are the mean plus or minus SD of 3 independent experiments. All P values were determined by Student t test (*P < .05; **P < .01; ***P < .001).
Development and characterization of CALR DEL and KO cell lines. (A) The strategy to obtain CALR KO (targeting exon 1) and DEL (targeting exon 9) UT7 and UT7/mpl cell lines with CRISPR/Cas9 genome editing; the resulting DNA sequence of genome-edited clones used in the study is reported below the sequence of WT CALR, or a typical del52 mutation, at corresponding DNA regions of interest for KO and DEL targeting. The ATG start codon is in bold and underlined; in the UT7 KO cell line, the ATG is removed whereas in UT7/mpl, the KO conditions were due to insertion of a TAG stop codon (in bold and red). The predicted sequence of the resulting DEL protein for UT7 and UT7/mpl is shown within a rectangle, with the novel sequence in red and the common C terminus underlined. (B) The expression of CALR mRNA and CALR protein in CALR WT (parental), DEL and KO UT7, and UT7/mpl cell lines was assessed, respectively, by qRT-PCR (top panel) and western blotting (bottom panel), using antibodies to either the common N-terminal or the C-terminal KDEL domain. Glyceraldehyde-3-phosphate dehydrogenase (GAPDH) was used for loading normalization; the asterisk points to mutant protein. (C-D) The GM-CSF–dependent UT7 and TPO-dependent UT7/mpl cells, either parental, CALR DEL, or KO, were seeded at 2 × 10⁵ cells per milliliter in cytokine-free medium. Living cells (×105/mL) were counted daily by trypan blue dye exclusion (top panels). Cell apoptosis was assessed at day 3 using the Annexin V–Fluoassay, and expressed as the percentage of annexin V+ cells over total (for UT7 [E] and UT7/mpl [F] cell lines, respectively). Data are the mean plus or minus SD of 3 independent experiments. All P values were determined by Student t test (*P < .05; **P < .01; ***P < .001).
Under standard cytokine-supplemented culture conditions, the proliferation rate (supplemental Figure 1) of parental, CALR DEL, and KO cell lines was no different; however, CALR DEL and KO UT7 and UT/mpl cells showed extended survival and resistance to apoptosis, compared with parental cells, when cultured under cytokine depletion (Figure 1C-D). These findings indicated that CALR DEL cells expressing mutant CALR acquired cytokine independence to a certain extent, and this effect was phenocopied by a CALR KO condition.
The IL-6–signaling pathway is abnormally activated in CALR DEL and KO mutant cells
Several studies reported preferential involvement of the Mk cell lineage in patients harboring the CALR mutation,10,17,22,23,25,26 associated with activation of JAK2/STAT5 signaling.17 To this end, we first assessed TPO-induced and TPO-independent megakaryocytic differentiation of CALR DEL and KO UT7/mpl cells. After 7 days of culture with TPO, CD41+/CD61+ cells increased by 1.9-fold and 2.1-fold, respectively, in CALR DEL and KO cells compared with WT cells (P < .001; Figure 2A); notably, CD41+/CD61+ cells were similarly increased (2.0-fold and 2.4-fold, respectively, vs controls) also in TPO-deprived conditions. In the latter cell culture conditions, we observed increased p-JAK1 and p-STAT3 levels in both CALR DEL and KO cells24 (5.6-fold and 7.95-fold and 4.3-fold and 5.3-fold, respectively, in a typical experiment in Figure 2B), whereas p-JAK2 and p-STAT5 were similar to WT cells. However, in CALR DEL cells exposed to TPO, p-JAK1 (7.2-fold), p-JAK2 (9.1-fold), p-STAT3 (2.3-fold), and p-STAT5 (1.8-fold) were all upregulated in comparison with WT cells; similar changes were observed in CALR KO cells (7.5-fold, 10-fold, 2.2-fold, and 1.9-fold, respectively) (mean plus or minus standard deviation [SD] densitometric values of 3 experiments are shown in Figure 3C-D). These findings suggested that CALR DEL mutation and lack of WT protein induced autonomous, TPO-independent activation of JAK1/STAT3 signaling, whereas JAK2/STAT5 signaling was preferentially induced by activation of MPL in either CALR DEL or KO cells. Because members of the IL-6 family are among the most important activators of STAT3,27 we investigated the mRNA levels of selected members of this family in CALR DEL and KO UT7/mpl cells. In standard culture conditions without TPO, IL-6 mRNA levels were 2.0-fold and 3.2-fold, respectively, higher in CALR DEL and KO cells than parental cells, whereas LIF and OSM mRNA levels were unchanged (Figure 2E) and IL11 mRNA was below the detection limit (not shown). The IL-6 mRNA levels were further increased in UT7/mpl cells exposed to TPO (from 2.0-fold and 3.0-fold the controls in CALR DEL and KO cells in the absence of TPO to 5.5-fold and 3.2-fold, respectively, when cultured with TPO; Figure 2F), consistent with known JAK2-dependent activation of IL-6 transcription. Increased amounts of IL-6 were released in the culture medium of CALR DEL and KO UT7/mpl cells maintained without or with TPO (1.5-fold ± 0.1-fold and 2.0-fold ± 0.2-fold, and 2.2-fold ± 0.2-fold and 7.4-fold ± 0.1-fold, vs controls, respectively) (Figure 2G). We also investigated the expression of gp130 and IL-6R on the cell membrane by confocal microscopy, finding that they were expressed at higher levels in CALR DEL and KO UT7/mpl cells compared with WT cells (Figure 2H), confirmed by flow cytometry (supplemental Figure 2). Then, we transiently expressed WT and DEL CALR in CALR KO cells, finding that expression of gp130 or IL-6R receptors was overtly reduced in cells expressing the WT, unlike DEL, CALR (Figure 2I). These findings, together with the appreciation that mRNA levels (Figure 2J) and total protein content of gp130 and IL-6R (Figure 2K) in CALR DEL and KO cells was similar to WT counterparts, supported the hypothesis that increased membrane expression of gp130 and IL-6R is due to abnormal processing of the receptors by mutated CALR, an effect phenocopied by absence of WT protein in KO cells. Therefore, WT CALR might be physiologically involved in negative regulation of gp130 and IL-6R expression on the cell membrane. In support of that, we demonstrated direct interaction of WT CALR, but not the DEL variant, with IL-6R and gp130 by coimmunoprecipitation experiments (Figure 2L); CALR–IL-6 immunocomplexes were not detected.
![CALR regulates IL-6/JAK1/STAT3 signaling through interaction with IL-6 and gp130. (A) UT7/mpl cells were incubated with TPO (100 ng/mL) or without for 7 days and the percentage of CD41+/CD61+ cells was measured by flow cytometry. Data shown are the mean plus SD of at least 3 individual experiments and represent fold change compared with WT cells incubated in the same conditions. (B) Total cell extracts of CALR WT, DEL, and KO UT7/mpl cells, incubated with or without TPO, were subjected to western blotting and immunodetection for p-STAT3, STAT3, p-STAT5, STAT5, p-JAK1, JAK1, p-JAK2, and JAK2; GAPDH was used as the loading control. (C-D) Densitometric analysis of 3 individual immunoblots (cells without TPO [C]) and (cells incubated with TPO [D]). LIF, OSM, and IL-6 mRNA levels were measured by qRT-PCR in CALR DEL and KO UT7/mpl cells and expressed relative to WT cells (dashed line). (E) RNAseP mRNA levels were used for relative quantity (RQ) calculation. (F) The IL-6 mRNA levels were also measured in CALR WT (reference fixed to relative level 1, dashed line), DEL and KO UT7/mpl cells that were cultured in the presence or absence of TPO in culture medium. (G) The quantification by ELISA of the levels of IL-6 in the culture medium of CALR DEL and KO UT7/mpl cells, expressed relative to parental cells (dashed line). (H) The expression of IL-6R and gp130 on the cell membrane of CALR WT, DEL, and KO UT7/mpl cells was assessed by confocal microscopy. Carboxyfluorescein succinimidyl ester (CSFE) dye was used to identify living cells; original magnification ×200. (I) In these experiments, CALR KO UT7/mpl cells were transfected with CALR WT-GFP– and CALR DEL-GFP–expressing plasmids (pl.), then they were challenged with antibodies (red fluorescence) against membrane-associated gp130 (left panels) and IL-6R (right panels). In the “merge” fields, green fluorescence points to cells that were successfully transfected with the expression plasmid; cells labeled with antibody only (red fluorescence) and lacking green fluorescence denote baseline expression of either gp130 or IL-6R in KO cells that were not transfected. Representative cells in confocal microscopy fields are presented to illustrate changes of receptor expression on the membrane of GFP-transfected KO cells; original magnification ×200. (J-K) The levels of gp130 and IL-6R mRNA (J; expressed relative to WT cells, dashed line) and protein in total cell extracts (K) were assessed by qRT-PCR and western blot, respectively, in CALR DEL and KO UT7/mpl cells; GAPDH was used for loading normalization. (L) In the coimmunoprecipitation experiment shown (1 representative of at least 3 for each experimental condition), whole-cell extracts of CALR WT, DEL, and KO cells were immunoprecipitated with gp130 (top) and IL-6R (bottom) antibodies and revealed with respective antibodies and CALR N-terminal antibody. Input panels represent the quantification of respective proteins in whole extracts before immunoprecipitation. (M) ChIP assay was performed in extracts of CALR WT, DEL, and KO UT7/mpl cells using STAT3 antibody, or normal rabbit serum (immunoglobulin G [IgG]) as negative control, with the primers amplifying the indicated regions of the IL-6 promoter. (N) CALR WT, DEL, and KO UT7/mpl cells were seeded at 2 × 10⁵ cells per milliliter, in cytokine-free medium, and living cells were counted daily by trypan blue dye exclusion; data shown are at day 3 of culture and are expressed as percent change compared with respective control cell cultures in the absence of drug. TCZ (1 μg/mL), a monoclonal anti–IL-6R antibody, SC144 (5 μM), a small molecule inhibitor of gp130, and anti–IL-6 antibody (1 μg/mL), were added at the initiation of culture (chosen drug concentrations were predetermined in dose-response curves). Data are expressed as the mean plus or minus SD of 3 independent experiments. All P values were determined by Student t test (*P < .05; **P < .01; ***P < .01).](https://ash.silverchair-cdn.com/ash/content_public/journal/bloodadvances/5/8/10.1182_bloodadvances.2020003291/1/m_advancesadv2020003291f2.png?Expires=1769107622&Signature=IBC7-CY-IC09ozlwNf80i2BKE1RLU3ZW8LC8V60fAYfRT5l82X4XSWE1V4O4EEsX3ix7DAyflxvGJ0GF~0dz~nLW~CpVEmfYhT-YHh0Gx8Zt1EWZ2HEucaPkkxUHvLoSI~LOtZORzESBr01LrBC0M5zXGonM1zGhgcVfurMyqij9PXytjG~YlQZFBTHx1w2pxR1mvMKeT7iBHl9IZUtmagj-KStk1P7zfdRU~yPvYgSukL269vyazVDRtmXNKFJsgTFZaMKZdT2niHpnS~wUsqfYdELJLSKB0VoEeSVhjvERUCGjRjOqTrKtMdQuYtX~ZZEYslrovz0-MziEjM5d0w__&Key-Pair-Id=APKAIE5G5CRDK6RD3PGA)
CALR regulates IL-6/JAK1/STAT3 signaling through interaction with IL-6 and gp130. (A) UT7/mpl cells were incubated with TPO (100 ng/mL) or without for 7 days and the percentage of CD41+/CD61+ cells was measured by flow cytometry. Data shown are the mean plus SD of at least 3 individual experiments and represent fold change compared with WT cells incubated in the same conditions. (B) Total cell extracts of CALR WT, DEL, and KO UT7/mpl cells, incubated with or without TPO, were subjected to western blotting and immunodetection for p-STAT3, STAT3, p-STAT5, STAT5, p-JAK1, JAK1, p-JAK2, and JAK2; GAPDH was used as the loading control. (C-D) Densitometric analysis of 3 individual immunoblots (cells without TPO [C]) and (cells incubated with TPO [D]). LIF, OSM, and IL-6 mRNA levels were measured by qRT-PCR in CALR DEL and KO UT7/mpl cells and expressed relative to WT cells (dashed line). (E) RNAseP mRNA levels were used for relative quantity (RQ) calculation. (F) The IL-6 mRNA levels were also measured in CALR WT (reference fixed to relative level 1, dashed line), DEL and KO UT7/mpl cells that were cultured in the presence or absence of TPO in culture medium. (G) The quantification by ELISA of the levels of IL-6 in the culture medium of CALR DEL and KO UT7/mpl cells, expressed relative to parental cells (dashed line). (H) The expression of IL-6R and gp130 on the cell membrane of CALR WT, DEL, and KO UT7/mpl cells was assessed by confocal microscopy. Carboxyfluorescein succinimidyl ester (CSFE) dye was used to identify living cells; original magnification ×200. (I) In these experiments, CALR KO UT7/mpl cells were transfected with CALR WT-GFP– and CALR DEL-GFP–expressing plasmids (pl.), then they were challenged with antibodies (red fluorescence) against membrane-associated gp130 (left panels) and IL-6R (right panels). In the “merge” fields, green fluorescence points to cells that were successfully transfected with the expression plasmid; cells labeled with antibody only (red fluorescence) and lacking green fluorescence denote baseline expression of either gp130 or IL-6R in KO cells that were not transfected. Representative cells in confocal microscopy fields are presented to illustrate changes of receptor expression on the membrane of GFP-transfected KO cells; original magnification ×200. (J-K) The levels of gp130 and IL-6R mRNA (J; expressed relative to WT cells, dashed line) and protein in total cell extracts (K) were assessed by qRT-PCR and western blot, respectively, in CALR DEL and KO UT7/mpl cells; GAPDH was used for loading normalization. (L) In the coimmunoprecipitation experiment shown (1 representative of at least 3 for each experimental condition), whole-cell extracts of CALR WT, DEL, and KO cells were immunoprecipitated with gp130 (top) and IL-6R (bottom) antibodies and revealed with respective antibodies and CALR N-terminal antibody. Input panels represent the quantification of respective proteins in whole extracts before immunoprecipitation. (M) ChIP assay was performed in extracts of CALR WT, DEL, and KO UT7/mpl cells using STAT3 antibody, or normal rabbit serum (immunoglobulin G [IgG]) as negative control, with the primers amplifying the indicated regions of the IL-6 promoter. (N) CALR WT, DEL, and KO UT7/mpl cells were seeded at 2 × 10⁵ cells per milliliter, in cytokine-free medium, and living cells were counted daily by trypan blue dye exclusion; data shown are at day 3 of culture and are expressed as percent change compared with respective control cell cultures in the absence of drug. TCZ (1 μg/mL), a monoclonal anti–IL-6R antibody, SC144 (5 μM), a small molecule inhibitor of gp130, and anti–IL-6 antibody (1 μg/mL), were added at the initiation of culture (chosen drug concentrations were predetermined in dose-response curves). Data are expressed as the mean plus or minus SD of 3 independent experiments. All P values were determined by Student t test (*P < .05; **P < .01; ***P < .01).
CALR regulates IL-6/JAK1/STAT3 signaling through interaction with IL-6 and gp130. (A) UT7/mpl cells were incubated with TPO (100 ng/mL) or without for 7 days and the percentage of CD41+/CD61+ cells was measured by flow cytometry. Data shown are the mean plus SD of at least 3 individual experiments and represent fold change compared with WT cells incubated in the same conditions. (B) Total cell extracts of CALR WT, DEL, and KO UT7/mpl cells, incubated with or without TPO, were subjected to western blotting and immunodetection for p-STAT3, STAT3, p-STAT5, STAT5, p-JAK1, JAK1, p-JAK2, and JAK2; GAPDH was used as the loading control. (C-D) Densitometric analysis of 3 individual immunoblots (cells without TPO [C]) and (cells incubated with TPO [D]). LIF, OSM, and IL-6 mRNA levels were measured by qRT-PCR in CALR DEL and KO UT7/mpl cells and expressed relative to WT cells (dashed line). (E) RNAseP mRNA levels were used for relative quantity (RQ) calculation. (F) The IL-6 mRNA levels were also measured in CALR WT (reference fixed to relative level 1, dashed line), DEL and KO UT7/mpl cells that were cultured in the presence or absence of TPO in culture medium. (G) The quantification by ELISA of the levels of IL-6 in the culture medium of CALR DEL and KO UT7/mpl cells, expressed relative to parental cells (dashed line). (H) The expression of IL-6R and gp130 on the cell membrane of CALR WT, DEL, and KO UT7/mpl cells was assessed by confocal microscopy. Carboxyfluorescein succinimidyl ester (CSFE) dye was used to identify living cells; original magnification ×200. (I) In these experiments, CALR KO UT7/mpl cells were transfected with CALR WT-GFP– and CALR DEL-GFP–expressing plasmids (pl.), then they were challenged with antibodies (red fluorescence) against membrane-associated gp130 (left panels) and IL-6R (right panels). In the “merge” fields, green fluorescence points to cells that were successfully transfected with the expression plasmid; cells labeled with antibody only (red fluorescence) and lacking green fluorescence denote baseline expression of either gp130 or IL-6R in KO cells that were not transfected. Representative cells in confocal microscopy fields are presented to illustrate changes of receptor expression on the membrane of GFP-transfected KO cells; original magnification ×200. (J-K) The levels of gp130 and IL-6R mRNA (J; expressed relative to WT cells, dashed line) and protein in total cell extracts (K) were assessed by qRT-PCR and western blot, respectively, in CALR DEL and KO UT7/mpl cells; GAPDH was used for loading normalization. (L) In the coimmunoprecipitation experiment shown (1 representative of at least 3 for each experimental condition), whole-cell extracts of CALR WT, DEL, and KO cells were immunoprecipitated with gp130 (top) and IL-6R (bottom) antibodies and revealed with respective antibodies and CALR N-terminal antibody. Input panels represent the quantification of respective proteins in whole extracts before immunoprecipitation. (M) ChIP assay was performed in extracts of CALR WT, DEL, and KO UT7/mpl cells using STAT3 antibody, or normal rabbit serum (immunoglobulin G [IgG]) as negative control, with the primers amplifying the indicated regions of the IL-6 promoter. (N) CALR WT, DEL, and KO UT7/mpl cells were seeded at 2 × 10⁵ cells per milliliter, in cytokine-free medium, and living cells were counted daily by trypan blue dye exclusion; data shown are at day 3 of culture and are expressed as percent change compared with respective control cell cultures in the absence of drug. TCZ (1 μg/mL), a monoclonal anti–IL-6R antibody, SC144 (5 μM), a small molecule inhibitor of gp130, and anti–IL-6 antibody (1 μg/mL), were added at the initiation of culture (chosen drug concentrations were predetermined in dose-response curves). Data are expressed as the mean plus or minus SD of 3 independent experiments. All P values were determined by Student t test (*P < .05; **P < .01; ***P < .01).
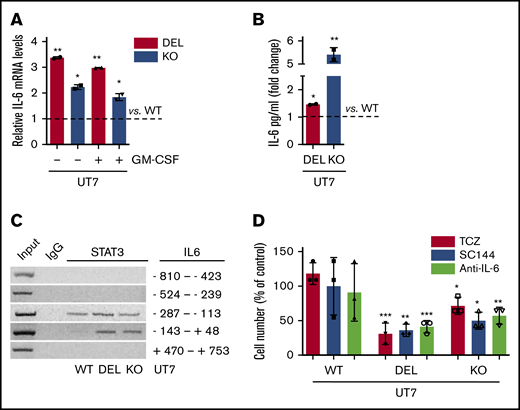
Abnormal IL-6 pathway activation is independent of MPL. (A) The IL-6 mRNA levels were measured by qRT-PCR in CALR DEL and KO UT7 cells grown in the presence or absence of GM-CSF and expressed relative to CALR WT cells (dashed line). RNAseP mRNA levels were used for relative quantity (RQ) calculation. The levels of IL-6 in the culture medium of CALR DEL and KO UT7 cells were quantified by ELISA and expressed as fold change relative to parental cells (dashed line; panel B). (C) ChIP assay was performed in extracts of CALR WT, DEL, and KO UT7 cells using STAT3 antibody, or normal rabbit serum (IgG) as negative control, with the primers amplifying the indicated regions of the IL-6 promoter. (D) CALR WT, DEL, and KO UT7 cells were seeded at 1 × 10⁵ cells per milliliter, in the presence of TCZ (1 μg/mL), SC144 (5 μM), and anti–IL-6 antibody (1 μg/mL), and living cells were counted daily by trypan blue dye exclusion; data shown represent percent changes compared with respective control cells maintained in the absence of drugs, for 3 days of culture, and are the mean plus or minus SD of 3 independent experiments. All P values were determined by Student t test (*P < .05; **P < .01; ***P < .01).
Abnormal IL-6 pathway activation is independent of MPL. (A) The IL-6 mRNA levels were measured by qRT-PCR in CALR DEL and KO UT7 cells grown in the presence or absence of GM-CSF and expressed relative to CALR WT cells (dashed line). RNAseP mRNA levels were used for relative quantity (RQ) calculation. The levels of IL-6 in the culture medium of CALR DEL and KO UT7 cells were quantified by ELISA and expressed as fold change relative to parental cells (dashed line; panel B). (C) ChIP assay was performed in extracts of CALR WT, DEL, and KO UT7 cells using STAT3 antibody, or normal rabbit serum (IgG) as negative control, with the primers amplifying the indicated regions of the IL-6 promoter. (D) CALR WT, DEL, and KO UT7 cells were seeded at 1 × 10⁵ cells per milliliter, in the presence of TCZ (1 μg/mL), SC144 (5 μM), and anti–IL-6 antibody (1 μg/mL), and living cells were counted daily by trypan blue dye exclusion; data shown represent percent changes compared with respective control cells maintained in the absence of drugs, for 3 days of culture, and are the mean plus or minus SD of 3 independent experiments. All P values were determined by Student t test (*P < .05; **P < .01; ***P < .01).
Finally, we performed a ChIP assay to analyze occupancy of candidate STAT3-binding sites in the IL-6 promoter28 ; we found evidence of enhanced interaction of STAT3 at region −238 to −113 and particularly −143 to +48 in CALR DEL and KO cells compared with parental cells (Figure 2M). Moreover, as the promoter of IL-6 contains both NF-κB and STAT3-binding sites, NF-κB was also investigated. We did not find a significant modulation in terms of expression and activation of NF-κB in CALR DEL and KO cells compared with the WT counterpart (supplemental Figure 3).
Because these findings pointed to involvement of the IL-6 pathway in cells either expressing mutated CALR or lacking WT protein, we exploited the effects of different inhibitors of this pathway. We found that SC144, a chemical inhibitor of gp130, tocilizumab (TCZ), an IL-6R–blocking monoclonal antibody, and a monoclonal anti–IL-6 antibody, all significantly reduced proliferation of CALR DEL and KO UT7/mpl cells, leaving parental cells largely unaffected (Figure 2N). At day 3 of culture, CALR DEL and KO cells were reduced, respectively, by 58.3% ± 1.2% and 57.2% ± 3.6% when exposed to SC144, 33.4% ± 3.1% and 62.6% ± 7.2% with TCZ, and 74.1% ± 3.4% and 54.4% ± 5.5% with anti–IL-6 antibody, compared with untreated cells.
IL-6–signaling pathway activation in CALR DEL and KO mutant cells is independent of MPL expression
To rule out any possible interference of MPL-dependent JAK/STAT5 activation on the autonomous activation of the IL-6 pathway in CALR-mutated cells, we repeated key experiments with UT7 cells that do not express the TPO receptor. We found that: (i) IL-6 mRNA levels were increased in CALR DEL and KO cells compared with parental cells, irrespective of being exposed or not to GM-CSF, used to support cell survival and proliferation (3.0-fold and 1.8-fold, and 3.4-fold and 2.2-fold, respectively; Figure 3A); (ii) the amount of IL-6 released in the culture medium of CALR DEL and KO UT7 cells was 1.5-fold ± 0.1-fold and 5.4-fold ± 0.2-fold higher than parental cells (Figure 3B); (iii) STAT3 protein bound to the promoter of IL-6 in CALR-mutated UT7 cells (Figure 3C): finally, UT7 CALR DEL and KO cell proliferation was significantly inhibited after exposure to IL-6 pathway inhibitors (Figure 3D). At day 3 of culture, CALR DEL and KO UT7 cells were reduced, respectively, by 63.9% ± 3% and 50% ± 4.1% when exposed to SC144, 69.1% ± 5.2% and 28.6% ± 4.1% with TCZ, and 58.8% ± 3% and 42.9% ± 4.1% with anti–IL-6 antibody, compared with controls.
These findings support MPL-independent activation of IL-6 signaling due to dysregulated exposure of gp130 and IL-6R on the cell membrane and STAT3-mediated IL-6 overproduction, caused by loss of a regulatory function exerted by WT CALR on IL-6 receptor processing.
CRISPR/Cas9-induced haploinsufficiency of WT CALR in normal CD34+ cells increases IL-6–dependent CFU-Mk generation
Aimed at validating the observations herein in primary cells, we first manipulated CB-derived CD34+ cells with a CRISPR/Cas9/GFP plasmid targeting exon 1, to induce a CALR KO condition; cells treated with mock CRISPR/Cas9/GFP plasmid served as control. Conversely, we were unable to generate CALR DEL cells due to low efficiency of the CRISPR/Cas9 DEL plasmid in CD34+ cells. Sorted CD34+ cells according to the highest GFP levels displayed ∼50% reduction of CALR mRNA and protein content, compared with mock cells, compatible with a heterozygous KO condition (Figure 4A). IL-6 mRNA levels were increased by 3.2-fold + 0.3-fold in CALR KO CD34+ vs mock cells (P < .001; Figure 4B). When sorted CALR KO CD34+ cells were plated in plasma clot cultures containing IL-6, CFU-Mks were 10-fold higher than the mock counterpart (from 4.3 ± 1.4 to 40.1 ± 8.7/103 plated cells; P < .001; Figure 4C); furthermore, in the IL-6–deprived condition, the anticipated reduction of CFU-MK generated from CALR KO CD34+ cells was lower than untouched cells (38.2% + 4.3% vs 58.0% + 13.1%; P < .05; Figure 4D). Finally, the addition of IL-6R inhibitor TCZ significantly reduced the number of CFU-Mk colonies generated from CALR KO CD34+ cells (P < .001) by 57.1% ± 2.7%, whereas mock CD34+ were largely unaffected (Figure 4E). Overall, these findings indicate that a condition of functional haploinsufficiency of CALR in CD34+ cells is associated with abnormal activation of IL-6 signaling contributing to enhanced megakaryocytopoiesis in vitro.
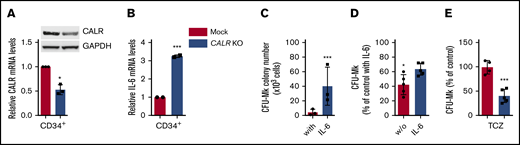
Downregulation of WT CALR in normal CD34+cells increases IL-6–dependent CFU-Mk generation. (A) Immunopurified CD34+ cells from donor CB units were transfected with a CALR CRISPR-GFP plasmid targeting exon 1 to generate a KO condition, or a mock CRISPR-GFP plasmid; cells were sorted based on high fluorescence intensity and analyzed for CALR mRNA (by qRT-PCR) and protein (by western blotting) expression levels. CALR mRNA levels are expressed relative to RNAseP mRNA levels, used for relative quantity (RQ) calculation. In these same cell preparations, the levels of IL-6 mRNA were measured by qRT-PCR, and expressed relative to WT cells, set at value 1 (panel B). (C-E) CRISPR-edited CD34+ cells were sorted based on their high GFP expression and plated in clonogenic plasma clot cultures for growth of CFU-Mk colonies, in the presence (C) or absence (D) of IL-6 in the culture medium. (E) In these experiments, cells were cultured in the absence of IL-6 but in the presence of TCZ (5 ng/mL). Data for each experimental condition represent the mean plus SD of at least 3 experiments. All P values were determined by Student t test (*P < .05; ***P < .001).
Downregulation of WT CALR in normal CD34+cells increases IL-6–dependent CFU-Mk generation. (A) Immunopurified CD34+ cells from donor CB units were transfected with a CALR CRISPR-GFP plasmid targeting exon 1 to generate a KO condition, or a mock CRISPR-GFP plasmid; cells were sorted based on high fluorescence intensity and analyzed for CALR mRNA (by qRT-PCR) and protein (by western blotting) expression levels. CALR mRNA levels are expressed relative to RNAseP mRNA levels, used for relative quantity (RQ) calculation. In these same cell preparations, the levels of IL-6 mRNA were measured by qRT-PCR, and expressed relative to WT cells, set at value 1 (panel B). (C-E) CRISPR-edited CD34+ cells were sorted based on their high GFP expression and plated in clonogenic plasma clot cultures for growth of CFU-Mk colonies, in the presence (C) or absence (D) of IL-6 in the culture medium. (E) In these experiments, cells were cultured in the absence of IL-6 but in the presence of TCZ (5 ng/mL). Data for each experimental condition represent the mean plus SD of at least 3 experiments. All P values were determined by Student t test (*P < .05; ***P < .001).
CFU-Mk colony generation in vitro from CALR- and JAK2V617F-mutated patients is synergistically inhibited by JAK1/2 and the IL-6R inhibitor
To ascertain the role of IL-6 signaling in JAK2V617F-mutated patients, we compared CFU-Mks generated from CD34+ cells of CALR- and JAK2V617F-mutated patients. In IL-6–supplemented medium, the number of CFU-Mk colonies per 103 CD34+ cells plated was 30.7 ± 1.3, 45.6 ± 5.6, and 13.1 ± 2.6 for JAK2V617F-mutated, CALR-mutated, and control subjects, respectively. The deprivation of IL-6 from culture medium caused a significant reduction (−34.6% ± 2.8%; P < .01) of CFU-Mks from control CD34+ cells, unlike CALR mutant or JAK2V617F patients (−5.2% ± 1.0% and −1.90% ± 2.4%; Figure 5A). IL-6 mRNA levels in CD34+ cells were 9.9-fold and 10.6-fold higher in CALR- and JAK2V617F-mutated patients than controls (P < .01; Figure 5B). We also found that the majority (70% ± 10%) of CD34+ cells of CALR- and JAK2V617F-mutated patients showed bright p-STAT3 immunofluorescence compared with a minority (<5%) of control CD34+ cells (Figure 5C). Increased expression of gp130 and IL-6R on CD34+ cells from CALR- and JAK2V617F-mutated patients was confirmed by flow cytometry; CD34+gp130+ cells were 32.7% ± 1.6%, 42.4% ± 1.3%, and 22.9% ± 1.2%, and CD34+IL-6R+ cells were 28.3% ± 2.7%, 29.5% ± 1.3%, and 13% ± 0.6%, in CALR mutated, JAK2V617F mutated, and controls, respectively (Figure 5D-E). Also, the gp130 and IL-6R mean fluorescent intensity was 1.4-fold and 1.6-fold in CALR-mutated cells, and 1.6-fold and 1.4-fold in JAK2V617F-mutated cells, higher than control cells. (Figure 5F-G). As a whole, these findings suggested autonomously activated IL-6 signaling in CD34+ cells of CALR- and JAK2V617F-mutated patients.
![CFU-Mk generation from CD34+cells of CALR- and JAK2V617F-mutated patients is dependent on IL-6. Immunomagnetically isolated CD34+ cells from healthy controls (HC; n = 6), CALR-mutated (n = 10), or JAK2V617F-mutated (n = 7) patients were seeded in MegaCult medium depleted of IL-6; CFU-Mk colonies were counted on day 12. Data are expressed as percent of control cultures in media containing IL-6 (A). The levels of IL-6 mRNA were assessed by qRT-PCR in CD34+ cells from CALR- (n = 8) and JAK2V617F-mutated (n = 8) MPN patients and healthy controls (HC; n = 7). Data are expressed as relative quantity (RQ) to reference RNAseP mRNA. (B) The symbol ° points to 3 CALR type 2–mutated patients, whereas the remaining 5 were typical DEL mutation. (C) The expression of p-STAT3 was evaluated by confocal microscopy in isolated CD34+ cells from CALR- or JAK2V617F-mutated patients or healthy subjects (n = 3 for each category; ×200 magnification). Random chosen cells from 1 healthy control, CALR- or JAK2V617F-mutated patient are presented. DAPI (4′,6-diamidino-2-phenylindole) dye was used to identify the nucleus. (D-G) The expression of gp130 and IL-6R on the cell membrane of CALRmut, JAK2V617Fmut patients and healthy controls was assessed by flow cytometry; the percentage of positive cells (D-E) and the mean fluorescent intensity (F-G) are shown. (H-J) Dose-dependent inhibition of CFU-Mk generation in clonogenic cultures established from CALR-mutated (n = 6) or JAK2V617F-mutated (n = 5) patients and healthy controls (HC; n = 6). SC144, TCZ, and an anti–IL-6 antibody were added at the time of culture initiation. CFU-Mk colonies from triplicate dishes were counted after 12 days, and the number of colonies was expressed as percent of controls in the absence of respective drugs. Respective IC50 values (mean plus standard error [SE]) are detailed in panel K. All P values were determined by Student t test (*P < .05; **P < .01; ***P < .001).](https://ash.silverchair-cdn.com/ash/content_public/journal/bloodadvances/5/8/10.1182_bloodadvances.2020003291/1/m_advancesadv2020003291f5.png?Expires=1769107622&Signature=ZYL3MvcKvj7X9dEhdEirjqxliLW1Hpm3iELMnCBo5UMvz4BFwBEHS70D2BQDiXqI38pj1KPkT6-BMoPN8l5lE3e-jqH4fa1VYtVkQ0-qEtK6ertX8WsJ0HEzY0ZE2KEd-V2yyzht4~plr9puu3b12fgrhM4QnDldNcjIKDmJaXzsABto-fSIbcRiVWnXGzHzUZ46HFuynrdoeL73e~DiIwLQI20pvsbjl9ue4kfB81~lcbNS6v38Bma~tsJ-C56iRORE6Cw4BU5r0Kqq-4Ci9PGg~oqziimTrHq3ov4rXGM8Zli2r140vuAhkPZYM3tqEibjJigzbyTxbxaIIelluQ__&Key-Pair-Id=APKAIE5G5CRDK6RD3PGA)
CFU-Mk generation from CD34+cells of CALR- and JAK2V617F-mutated patients is dependent on IL-6. Immunomagnetically isolated CD34+ cells from healthy controls (HC; n = 6), CALR-mutated (n = 10), or JAK2V617F-mutated (n = 7) patients were seeded in MegaCult medium depleted of IL-6; CFU-Mk colonies were counted on day 12. Data are expressed as percent of control cultures in media containing IL-6 (A). The levels of IL-6 mRNA were assessed by qRT-PCR in CD34+ cells from CALR- (n = 8) and JAK2V617F-mutated (n = 8) MPN patients and healthy controls (HC; n = 7). Data are expressed as relative quantity (RQ) to reference RNAseP mRNA. (B) The symbol ° points to 3 CALR type 2–mutated patients, whereas the remaining 5 were typical DEL mutation. (C) The expression of p-STAT3 was evaluated by confocal microscopy in isolated CD34+ cells from CALR- or JAK2V617F-mutated patients or healthy subjects (n = 3 for each category; ×200 magnification). Random chosen cells from 1 healthy control, CALR- or JAK2V617F-mutated patient are presented. DAPI (4′,6-diamidino-2-phenylindole) dye was used to identify the nucleus. (D-G) The expression of gp130 and IL-6R on the cell membrane of CALRmut, JAK2V617Fmut patients and healthy controls was assessed by flow cytometry; the percentage of positive cells (D-E) and the mean fluorescent intensity (F-G) are shown. (H-J) Dose-dependent inhibition of CFU-Mk generation in clonogenic cultures established from CALR-mutated (n = 6) or JAK2V617F-mutated (n = 5) patients and healthy controls (HC; n = 6). SC144, TCZ, and an anti–IL-6 antibody were added at the time of culture initiation. CFU-Mk colonies from triplicate dishes were counted after 12 days, and the number of colonies was expressed as percent of controls in the absence of respective drugs. Respective IC50 values (mean plus standard error [SE]) are detailed in panel K. All P values were determined by Student t test (*P < .05; **P < .01; ***P < .001).
CFU-Mk generation from CD34+cells of CALR- and JAK2V617F-mutated patients is dependent on IL-6. Immunomagnetically isolated CD34+ cells from healthy controls (HC; n = 6), CALR-mutated (n = 10), or JAK2V617F-mutated (n = 7) patients were seeded in MegaCult medium depleted of IL-6; CFU-Mk colonies were counted on day 12. Data are expressed as percent of control cultures in media containing IL-6 (A). The levels of IL-6 mRNA were assessed by qRT-PCR in CD34+ cells from CALR- (n = 8) and JAK2V617F-mutated (n = 8) MPN patients and healthy controls (HC; n = 7). Data are expressed as relative quantity (RQ) to reference RNAseP mRNA. (B) The symbol ° points to 3 CALR type 2–mutated patients, whereas the remaining 5 were typical DEL mutation. (C) The expression of p-STAT3 was evaluated by confocal microscopy in isolated CD34+ cells from CALR- or JAK2V617F-mutated patients or healthy subjects (n = 3 for each category; ×200 magnification). Random chosen cells from 1 healthy control, CALR- or JAK2V617F-mutated patient are presented. DAPI (4′,6-diamidino-2-phenylindole) dye was used to identify the nucleus. (D-G) The expression of gp130 and IL-6R on the cell membrane of CALRmut, JAK2V617Fmut patients and healthy controls was assessed by flow cytometry; the percentage of positive cells (D-E) and the mean fluorescent intensity (F-G) are shown. (H-J) Dose-dependent inhibition of CFU-Mk generation in clonogenic cultures established from CALR-mutated (n = 6) or JAK2V617F-mutated (n = 5) patients and healthy controls (HC; n = 6). SC144, TCZ, and an anti–IL-6 antibody were added at the time of culture initiation. CFU-Mk colonies from triplicate dishes were counted after 12 days, and the number of colonies was expressed as percent of controls in the absence of respective drugs. Respective IC50 values (mean plus standard error [SE]) are detailed in panel K. All P values were determined by Student t test (*P < .05; **P < .01; ***P < .001).
In clonogenic assays established with CALR- and JAK2V617F-mutated CD34+ cells, we found dose-dependent inhibition of CFU-Mk generation, unlike in control plates. The 50% inhibitory concentration (IC50) for CFU-Mks in cultures of CD34+ cells from CALR- and JAK2V617F-mutated patients was, respectively, 4.3 ± 0.2 nM and 8.1 ± 3.1 nM for SC144, 69.5 ± 7.8 ng/mL and 83.7 ± 8.7 ng/mL for TCZ, and 77.6 ± 2.5 ng/mL and 77.7 ± 2.4 ng/mL for anti–IL-6 antibody (Figure 5H-K). We also evaluated the effects of IL-6 pathway inhibitors in clonogenic cultures for CFU-GM and BFU-E (supplemental Figure 4). We found that TCZ at 250 ng/mL inhibited the number of CFU-GM generated by CALR- and JAK2V617F-mutated CD34+ cells by 51.67% ± 5.8% and 48.34% ± 5.1%; SC144 was similarly effective with 47.5% ± 1.9% and 48.9% ± 1.8% inhibition at 100 nM. TCZ was minimally effective on BFU-E, with a 33.2% ± 3.4% and 17.5% ± 3.2% reduction in CALR- and JAK2V617F-mutated patients at 250 ng/mL, whereas SC144 were more effective: at 100 nM, the number of BFU-E generated by CALR- and JAK2V617F-mutated CD34+ was reduced by 84.7% ± 5.4% and 48.3% ± 2.8%, respectively.
We finally ascertained whether the combination of TCZ and ruxolitinib resulted in synergistic inhibition of CFU-Mk generation; to this end, we used suboptimal amounts of ruxolitinib (5 nM) and TCZ (5 and 50 ng/mL). We found that CFU-Mks were reduced, respectively, by 70.8% ± 2.0% and 90.8% ± 0.7% (from 30.5 ± 2.2 to 8.9 ± 0.6 and 2.8 ± 1.1/103 plated cells; Figure 6A) in cultures of CALR-mutated CD34+ cells, and by 79.5% ± 1.2% and 64.1% ± 4.5% (from 45.7 ± 4.9 to 9.3 ± 2.0 and 16.4 ± 6.8/103 plated cells; Figure 6B) from JAK2V617F cells, resulting in respective combination indexes of 0.12 and 0.30 (Figure 6C-D).29

Combination of TCZ and ruxolitinib synergistically inhibits CFU-Mk generation from CALR- and JAK2V617F-mutated patients. (A-B) CD34+ isolated from CALR-mutated (n = 4) and JAK2V617F-mutated (n = 5) patients, respectively, were plated in IL-6–free clonogenic assays for CFU-Mk generation. Ruxolitinib (Ruxo; at a suboptimal dose of 5 nM) and TCZ (at 5 and 50 ng/mL) were added at the initiation of culture, and CFU-Mks were counted on day 12. Data are shown as percent number of colonies to control cultures in the absence of either drug. The isobologram for IC50 of TCZ and ruxolitinib to inhibiting CFU-Mk generation in CALRmut (C) and JAK2V617Fmut (D) patients was calculated according to the Chou and Talalay formula. All P values were determined by the Student t test (*P < .05; **P < .01; ***P < .001).
Combination of TCZ and ruxolitinib synergistically inhibits CFU-Mk generation from CALR- and JAK2V617F-mutated patients. (A-B) CD34+ isolated from CALR-mutated (n = 4) and JAK2V617F-mutated (n = 5) patients, respectively, were plated in IL-6–free clonogenic assays for CFU-Mk generation. Ruxolitinib (Ruxo; at a suboptimal dose of 5 nM) and TCZ (at 5 and 50 ng/mL) were added at the initiation of culture, and CFU-Mks were counted on day 12. Data are shown as percent number of colonies to control cultures in the absence of either drug. The isobologram for IC50 of TCZ and ruxolitinib to inhibiting CFU-Mk generation in CALRmut (C) and JAK2V617Fmut (D) patients was calculated according to the Chou and Talalay formula. All P values were determined by the Student t test (*P < .05; **P < .01; ***P < .001).
Discussion
CALR mutation is detected in 20% to 25% of essential thrombocythemia and PMF patients who show unique characteristics compared with JAK2V617F mutated.30-33 The best known mechanism for mutated CALR in MPN pathogenesis is through its abnormal binding and activation of the TPO receptor MPL, which is expressed on hematopoietic stem cells and the megakaryocytic lineage. Activated MPL insists on JAK2/STAT5 signaling, as in JAK2V617F-mutated cells, as well as on the MAPK pathway.22,34 The activation of JAK2-dependent cascade justifies the clinical benefits of JAK2/JAK1 inhibitor ruxolitinib and fedratinib in CALRmut patients.21,35
We present herein data supporting a novel mode of action of mutated CALR. Using UT7 and UT7/mpl cells CRISPR/Cas9 engineered to express CALR type I–like DEL mutation, we showed that cells acquire cytokine independence, become primed for Mk differentiation, express raised IL-6 mRNA and extracellularly released IL-6 levels, with higher membrane-associated gp130 and IL-6R, and increased levels of p-JAK1 and p-STAT3; these were all independent of MPL stimulation by TPO. Of note, these effects were reproduced in UT7 and UT7/mpl cells made KO for CALR. We also showed that WT CALR, but not mutated CALR, physically interacts with gp130 and IL-6R. Accordingly, we propose that WT CALR physiologically limits the exposure of gp130 and IL-6R on the cell membrane, compatible with a loss of function of mutated CALR, phenocopied by CALR KO. Mutated CALR was shown to be similarly involved in the transport of immature, or traffic-defective, MPL from the ER to the cell membrane.19,36 The augmented membrane exposure of IL-6Rs would in turn promote IL-6 transcription through increased occupancy of the IL-6 promoter by STAT3, resulting in a feed-forward autocrine feedback loop.37,38 We also showed that CB CD34+ cells engineered to become haploinsufficient for WT CALR, as well as primary CD34+ cells isolated from CALRmut patients (including a few with CALR type 2 mutation), presented increased expression of IL-6 mRNA and dependence on autocrine IL-6 for CFU-Mk generation. Furthermore, we showed that agents targeting gp130 (SC144) or IL-6R (TCZ) inhibited the growth of CALR DEL/KO cells and, more importantly, Mk colonies from CD34+ progenitors of CALRmut patients; such inhibition was synergistically potentiated by ruxolitinib, raising the provoking perspective that these 2 approved agents may be efficaciously combined in vivo. TCZ is a humanized antibody that competitively inhibits IL-6 binding to its receptor; it is approved for the treatment of rheumatoid arthritis, chimeric antigen receptor-T-cell–induced cytokine release syndrome, and idiopathic multicentric Castelman disease.38,39 The effective concentrations of TCZ in cultures of CD34+ cells in our experiments were in the low range of 5 to 100 ng/mL, well within the steady-state peak and through concentration (183 + 86 μg/mL and 9.7 + 1.1 μg/mL, respectively) of a clinically used dose of 8 mg/kg.40
When activated by IL-6, the intracytoplasmic portion of IL-6R binds to gp130, triggering receptor dimerization and signal transduction via either the JAK/STAT or MAPK pathway.39 IL-6 acts directly by inducing the expression of STAT3 target genes, which among the others encode proteins that drive tumor cell proliferation (such as cyclin D1) and survival (such as BCL-xL).38,41 IL-6 is normally involved in megakaryocytopoiesis in both TPO-dependent and TPO-independent mechanisms.42,43 Therefore, it makes sense that IL-6 mRNA levels were increased also in CD34+ cells of JAK2V617Fmut patients, owing to autonomous activation of JAK2 signaling, and that inhibitors of IL-6 signaling and extracellularly released IL-6 inhibited CFU-Mk generation. However, the effects of blocking IL-6 signaling may extend beyond the Mk lineage, as supported by TCZ-induced inhibition of myeloid (CFU-GM) progenitors, and to lower extent, erythroid ones, of CALRmut and JAK2V617Fmut patients.
Intriguingly, circulating CALR was found to be associated with IL-6 plasma levels and disease severity in patients with MF.44 It is also noteworthy that in a mouse chronic myelogenous leukemia model, abnormal production of IL-6 by leukemic stem cells sustained leukemia development; conceivably, disease-associated splenomegaly and myeloid expansion in hematopoietic tissues were abrogated by anti–IL-6 antibody.45 Kleppe et al identified IL-6 as one of the most abnormally produced inflammatory cytokines by granulocytes of PMF patients that was associated with constitutive STAT3 activation. Pan-hematopoietic Stat3 deletion in the context of an MPLW515L MPN mouse model resulted in amelioration of the myelofibrosis trait, consistent with a requirement of STAT3 in malignant and nonmalignant hematopoietic cells.46 Furthermore, a loss-of-function polymorphism of IL-6R (rs4537545) was associated with reduced risk of developing a JAK2V617Fmut MPN in a Danish population study.47 Dual targeting of JAK2 and STAT3 (via IL-6R blockade) may therefore have attractiveness for the treatment of MPN patients.48,49 Using the same reasoning, targeting NF-κB with BET bromodomain protein inhibitors, alone and in combination with ruxolitinib, was therapeutically effective in MPN models and post-MPN acute leukemia cells.48,50
As a whole, our data support an abnormal interaction between mutated CALR and gp130 and IL-6R. As pointed out in an elegant commentary by Ann Mullally,51 the complexity of the role of mutated CALR is broadening from “gains,” exemplified by its well-characterized interaction with MPL, to “losses,” including defective interaction with ERp57, a member of the protein disulfide isomerase family involved in calcium regulation,52 deficiency of myeloperoxidase in leukocytes,53 and abnormal processing of IL-6 receptors, according to data presented in this manuscript. This concept is strengthened by findings that mutated CALR was faithfully phenocopied by absence (UT7 and UT7/mpl KO cells) or haploinsufficiency of WT (CD34+ KO cells). Theocharides et al observed that deficiency of myeloperoxidase was mostly pronounced in leukocytes of patients harboring homozygous CALR mutation,53 and Shide et al recently demonstrated that CALR haploinsufficiency in hematopoietic cell–specific Calr-deficient mice was necessary for the onset of myeloproliferation, and augmented stem cell activity.54
Though providing compelling in vitro and ex vivo evidence to support IL-6 as a novel pathogenetic mechanism and therapeutic target for CALR- and, possibly, JAK2V617F-mutated MPN, this study poses some questions that deserve to be investigated in future experiments. The first regards whether the therapeutic efficacy of combined JAK2/IL-6 inhibition will be substantiated in in vivo models; absence of animal data are an acknowledged limitation of current work. An additional aspect to explore is whether paracrine effects might also contribute to abnormal IL-6 pathway activation in MPN hematopoietic cells, as inflammatory cytokines originate both from the MPN clone as well as nonclonal cells.
Requests for data may be e-mailed to the corresponding author, Alessandro Maria Vannucchi, at amvannucchi@unifi.it.
Acknowledgments
This work was supported by Associazione Italiana per la Ricerca sul Cancro (AIRC) 5×1000 call “Metastatic disease: the key unmet need in oncology” to MYeloid NEoplasms Research Venture AIRC (MYNERVA), project #21267; Cancer Research UK (C355/A26819), Fundación Científica–Asociación Española contra el Cáncer (FC AECC) and AIRC under the Accelerator Award Program; Istituto Toscano Tumori, Regione Toscana, project 2013-B16D14001130002; Bando Ricerca Finalizzata Ministero della Salute RF-2016-02362930; and Ministero della Università e della Ricerca PRIN-2017WXR7ZT.
Authorship
Contribution: M.B., L.C., N.B., and P.G. designed the research and analyzed data; S.R., L.M., and M.L. contributed to experimental data; R.M. contributed to analysis; and A.M.V. designed the research and wrote the paper with the collaboration of P.G. and M.B.
Conflict-of-interest disclosure: A.M.V. is on the advisory board for Novartis, Celgene, AbbVie, Incyte, Italfarmaco, and CTI; and is a speaker for Novartis, Celgene, and CTI. P.G. is on the advisory board of, and is a speaker for, Novartis. The remaining authors declare no competing financial interests.
Correspondence: Alessandro M. Vannucchi, CRIMM, Centro di Ricerca e Innovazione e Laboratorio Congiunto per le Malattie Mieloproliferative, AOU Careggi, Dipartimento di Medicina Sperimentale e Clinica and DENOTHE Excellence Center, CUBO 3, Padiglione 27b, Viale Pieraccini, 6, 50134 Firenze, Italy; e-mail: amvannucchi@unifi.it.

