

Key Points
Activated B cell–like DLBCL shows increased levels of PD1+TIM3+ TILs with impaired functions.
These exhausted PD1+TIM3+ TILs can be functionally reactivated after blocking PD1 or TIM3.

Abstract
In diffuse large B-cell lymphoma (DLBCL), tumor-infiltrating T lymphocytes (TILs) are involved in therapeutic responses. However, tumor-specific TILs can be dysfunctional, with impaired effector functions. Various mechanisms are involved in this exhaustion, and the increased expression of programmed cell death receptor 1 (PD1) and TIM3 on dysfunctional cells suggests their involvement. However, conflicting data have been published regarding their expression or coexpression in DLBCL. We evaluated the presence and phenotype of CD4+ and CD8+ TILs in freshly collected tumor tissues in DLBCL and compared the results with those in follicular lymphoma, classical Hodgkin lymphoma, and nonmalignant reactive lymphadenopathy. We found that TILs expressing both PD1 and TIM3 were expanded in DLBCL, particularly in the activated B cell–like subgroup. Isolated PD1+TIM3+ TILs exhibited a transcriptomic signature related to T-cell exhaustion associated with a reduction in cytokine production, both compromising the antitumor immune response. However, these cells expressed high levels of cytotoxic molecules. In line with this, stimulated PD1+TIM3+ TILs from DLBCL patients exhibited reduced proliferation and impaired secretion of interferon-γ, but these functions were restored by the blockade of PD1 or TIM3. In summary, the PD1+TIM3+ TIL population is expanded and exhausted in DLBCL but can be reinvigorated with appropriate therapies.
Introduction
Diffuse large B-cell lymphoma (DLBCL) is the most common and most aggressive type of B-cell lymphoma and constitutes a heterogeneous group of tumors with several entities. In particular, 2 subtypes, germinal center B cell–like (GC) and activated B cell–like (ABC) DLBCL, have displayed different outcomes after immunochemotherapy in some, but not all, studies.1,2 Despite limited and short response rates in relapsed or refractory DLBCL after anti–programmed cell death receptor 1 (PD1) treatment alone,3 therapeutic regimens combining PD1/PD ligand 1 (PD-L1) pathway blockade and rituximab chemotherapy are currently under investigation in several ongoing trials. However, correlative data from clinical trials point to the role of tumor-infiltrating T lymphocytes (TILs) for therapeutic efficacy. CD8+ TILs may have reduced efficacy in the context of T cell–mediated immunotherapy, including chimeric antigen receptor (CAR) T-cell therapy, through the loss of various effector functions, such as cytolytic capacity, proliferative capacity, and production of the cytokines interferon-γ (IFN-γ), tumor necrosis factor-α (TNF-α), and interleukin-2 (IL-2).4-7
CD8+ TILs that upregulate PD1 expression display an exhausted phenotype.8 PD1 is a surrogate marker of T-cell exhaustion and acts by negatively regulating T-cell receptor (TCR) and CD28 signaling and decreasing proliferation and cytokine secretion of T cells upon engagement with its ligands (PD-L1 and PD-L2).9,10 Accumulated data indicate that PD1 and PD-L1 are highly expressed in the tumor microenvironment and are robust prognostic markers in various tumors.11-16 In DLBCL, conflicting results have been published, and increased PD1 expression in circulating T cells has been associated with poor outcomes in patients.17,18 In contrast, high PD-L1 expression on tumor cells and high levels of plasma-soluble PD-L1 have been associated with poor outcomes.19-22 Finally, PD1 expression alone is not sufficient to characterize exhausted T cells.23 Among other molecules, TIM3 represents another well-characterized marker associated with T-cell exhaustion. TIM3 is a member of the T-cell immunoglobulin and mucin domain family of proteins and is expressed on T cells and innate immune cells, where it has been shown to suppress responses after its engagement.24 Like PD1, TIM3 serves as an inhibitory immune checkpoint receptor and is a marker of dysfunction in T cells infiltrating tumors in both mice and humans.25,26 High expression levels of TIM3 on CD8+ T cells have been associated with tumor progression and poor outcomes.17,27,28 TIM3 expression is closely associated with PD1 expression on TILs, and PD1+TIM3+ TILs have been described as being more exhausted than their TIM3− counterparts.29,30 The CD4+ T-cell subset, which is critical to CD8+ T-cell function and antitumor responses, also expresses these inhibitory receptors.31,32 Combination therapies based on blockade of both TIM3 and PD1 exhibited synergistic effects in restoring T-cell responses in vitro and antitumor responses in preclinical animal models.26
Herein, using viable tumor cell suspensions, we sought to accurately assess the level of TIL infiltration in DLBCL, determine the phenotype and gene expression profile of these cells by comparing PD1+TIM3+ and PD1−TIM3− compartments in CD4+ and CD8+ T cells, and evaluate their functional capacities in terms of proliferation and production of IFN-γ. We found enrichment in exhausted T cells in ABC DLBCL tumors, and we demonstrated in vitro that these cells could be reactivated functionally after the blockade of PD1 or TIM3.
Materials and methods
Patients
Fresh biopsy samples were collected at diagnosis from DLBCL patients (n = 25), all classified according to the World Health Organization (Table 1).33 In addition, follicular lymphoma (FL; n = 15), classical Hodgkin lymphoma (cHL; n = 10), and reactive lymphadenopathy (rLN) samples (n = 7) were analyzed as controls. DLBCL cases were considered to be de novo cases, because there was no history of FL or FL histological features. The DLBCL cell of origin was determined by immunohistochemistry using the Hans algorithm (n = 21)34 or molecular analysis using the previously described reverse transcriptase multiplex ligation-dependent probe amplification technique (n = 4).35 All patients provided informed consent according to the principles of the Declaration of Helsinki and the French National Cancer Institute ethics committee recommendations, and the study was approved by the ethics board of the Paoli-Calmette Institute.
DLBCL patient characteristics (n = 25)
| n (%) | |
|---|---|
| Age, y | |
| Average | 66 |
| Range | 29-83 |
| Sex | |
| Male | 11 (44) |
| Female | 14 (56) |
| IPI | |
| 0-1 | 7 (37)* |
| 2-3 | 8 (42)* |
| 4-5 | 4 (21)* |
| Cell of origin | |
| GC | 9 (36) |
| Non-GC | 14 (56) |
| Unknown | 2 (8) |
| n (%) | |
|---|---|
| Age, y | |
| Average | 66 |
| Range | 29-83 |
| Sex | |
| Male | 11 (44) |
| Female | 14 (56) |
| IPI | |
| 0-1 | 7 (37)* |
| 2-3 | 8 (42)* |
| 4-5 | 4 (21)* |
| Cell of origin | |
| GC | 9 (36) |
| Non-GC | 14 (56) |
| Unknown | 2 (8) |
IPI, International Prognostic Index.
Percentage for cases with known data.
Cell isolation, cell sorting, and surface and intracellular staining
Sample tissues were mechanically disrupted (GentleMACS; Miltenyi Biotec) to obtain dissociated mononuclear cells, which were frozen for further analysis.
For functional analyses, T cells were obtained from lymphoma tissues by negative selection (StemCell Technologies). To isolate TIM3+PD1+, TIM3−PD1−, and TIM3−PD1+ T cells, purified intratumoral T cells were labeled with CD2, CD56, PD1, TIM3, and a viability marker (Live/Dead Aqua stain; Life Technologies), and were sorted on the FACSAria platform (BD Biosciences; supplemental Table 1A).
For NanoString analysis, cells were stained with CD3, CD4, CD8, CD45RO, PD1, and TIM3 (supplemental Table 1). The CD3+CD45RO+DAPI− population and PD1−TIM3− CD4+, PD1+TIM3+ CD4+, PD1−TIM3− CD8+, or PD1+TIM3+ CD8+ population were sorted.
Cells were surface stained (detailed in the data supplement; supplemental Table 1), and data were acquired on an LSRII (BD Biosciences) and analyzed using FACSDiva and FlowJo software.
Intracellular cytokine secretion
After stimulation (detailed in the data supplement), cells were surface stained with CD3 BV605, CD4 BV650, CD8 Alexa-Fluor700, PD1 BV421, and/or TIM3 PE antibodies and Live/Dead Aqua stain before fixation/permeabilization with the BD Cytofix/Cytosperm kit. Cells were washed and stained with intracellular molecular antibodies (mAbs) specific for IL-2, TNF-α, IFN-γ, and granzyme B.
CellTrace labeling and T-cell proliferation assays
Mononuclear cells and sorted T-cell subsets were stained with the CellTrace violet cell proliferation kit (Life Technologies; detailed in the data supplement). Proliferation was evaluated by the percentage of CellTracedim cells. Supernatants of cocultures were collected, and IFN-γ was further measured by enzyme-linked immunosorbent assay (BD Biosciences).
In situ immunofluorescence staining and analysis of TILs
Tissue samples from 6 DLBCL, 2 rLN, and 2 FL patients obtained on the day of surgery were frozen and stored at −80°C. Staining for CD8, PD1, TIM3, and either Ki67 or CD20 was performed using nonlabeled primary antibodies followed by fluorophore-labeled secondary antibodies (detailed in the data supplement; supplemental Table 2). Fluorescence analysis and automated cell counts were performed as previously described.29 To evaluate the distance between the CD8+ T-cell infiltrate depending on PD1/TIM3 phenotype and CD20+ clusters, we performed tissue segmentation based on CD20 staining. This allowed counting of PD1+TIM3+ CD8+ T cells according to their localization in CD20+ vs CD20− areas.
NanoString analysis
The nCounter PanCancer immune cell profiling kit (Nanostring Technologies, Inc.) was used (detailed in the data supplement). The analysis allowed us to compare PD1+TIM3+ and PD1−TIM3− subsets in the CD4+ or CD8+ T-cell populations and determine, by a Student t test statistic (P < .05; |fold change [FC]| > 2), the specific gene expression pattern for each population expressed in FC. Ingenuity pathways analysis (Ingenuity Systems) was used to define upstream regulators.
Statistical analysis
Quantitative variables are expressed as means ± standard errors of the mean (SEMs). Statistical analyses were performed with GraphPad Prism 5 software using the Mann-Whitney U or Wilcoxon nonparametric test as appropriate (*P < .05, **P < .01, ***P < .001). For each parameter, the mean frequency of positive cells or mean fluorescence intensity was normalized across samples. Data were then visualized by hierarchical clustering under MeV software (version 4.9.0). Euclidian distance was used with average linkage clustering.
Results
In ABC DLBCL, lymphoma cells strongly express PD-L1
We investigated by flow cytometry the expression of PD-L1 and PD-L2 on lymphoma cells using a clonal marker in DLBCL, FL, and rLN and most likely on normal B cells in cHL. This investigation is in line with previous studies of primary DLBCL cells and lymphoma cell lines.21,36 The expression of PD-L1 was significantly higher (P < .01) on DLBCL cells vs cells from rLN and other lymphomas, whereas there was no significant difference in PD-L2 on B cells, although expression in cHL and rLN tended to be higher (Figure 1A). As in previous studies,21,36,37 we also found that B cells taken from ABC DLBCL samples expressed significantly more PD-L1 (P < .05) than B cells from GC DLBCL or FL samples (Figure 1B).

Lymphoma B cells from ABC DLBCL strongly express PD-L1. (A) Representative histograms of PD-L1 and PD-L2 expression on isotype-restricted clonal B cells, except for cHL (top), and percentage of B cells expressing PD-L1 or PD-L2 in DLBCL (n = 23), FL (n = 15), cHL (n = 10), and rLN (n = 7) samples (bottom). (B) Percentage of PD-L1+ lymphoma cells in GC DLBCL (n = 9), ABC DLBCL (n = 12), and FL (n = 15) samples. *P < .05, **P < .01, ***P < .001 by Mann-Whitney nonparametric U test.
Lymphoma B cells from ABC DLBCL strongly express PD-L1. (A) Representative histograms of PD-L1 and PD-L2 expression on isotype-restricted clonal B cells, except for cHL (top), and percentage of B cells expressing PD-L1 or PD-L2 in DLBCL (n = 23), FL (n = 15), cHL (n = 10), and rLN (n = 7) samples (bottom). (B) Percentage of PD-L1+ lymphoma cells in GC DLBCL (n = 9), ABC DLBCL (n = 12), and FL (n = 15) samples. *P < .05, **P < .01, ***P < .001 by Mann-Whitney nonparametric U test.
In ABC DLBCL tumors, expansion of CD8+ and CD4+ TILs expressing inhibitor molecules and the proliferation marker Ki67
Because of the increased number of PD-L1+ B cells, we studied the frequency of TILs and the expression of immune checkpoint membrane proteins in tissues from DCLBL, cHL, FL, and rLN samples. CD8+ T cells were significantly increased in DLBCL compared with other tumors and rLN (considered here as a control), whereas the percentage of CD4+ T cells was significantly lower in DLBCL compared with other tumor types and rLN (supplemental Figure 1). DLBCL tissues exhibited a specific phenotypic pattern compared with rLN, cHL, and FL tissues; in particular, CD4+ and CD8+ T cells expressed higher levels of inhibitory molecules on their surface, including PD1, PD-L1, TIM3, and CD80 (Figure 2A). Additionally, the percentages of PD1+TIM3+ CD4+ and PD1+TIM3+ CD8+ T cells were increased in DLBCL samples compared with other tissues (P < .05; Figure 2B). Interestingly, both the CD4+ and CD8+ PD1+TIM3+ subsets were significantly increased in ABC DLBCL tumors compared with GC DLBCL and FL. Finally, tumor infiltration by PD1+TIM3+ CD4+ correlated with that by PD1+TIM3+ CD8+ T cells, independently of DLBCL subtype (Figure 2C). In contrast with cells from GC DLBCL or FL, PD1+TIM3+ TILs accumulated in the tumor microenvironment of ABC DLBCL tumors, and these cells exhibited increased HLA-DR and Ki67 expression (Figure 2A). Immunofluorescence microscopic analysis revealed that ∼1% to 7% of the Ki67+ cells were PD1+CD8+ TILs (Figure 2D; supplemental Table 3).
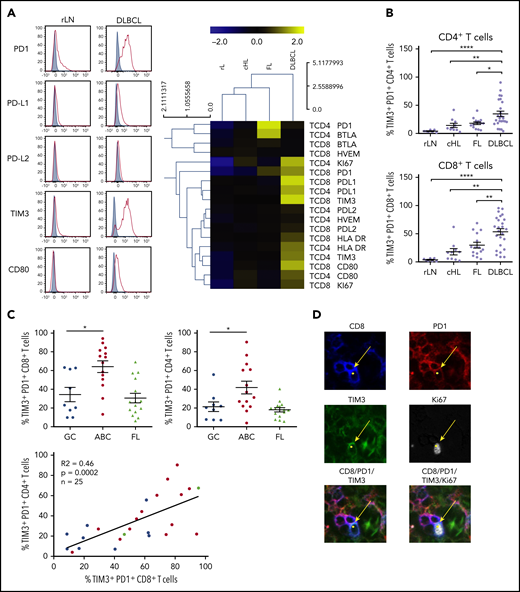
PD1+TIM3+CD4+T cells and PD1+TIM3+CD8+T cells are enriched in ABC DLBCL tissues. (A) Representative histograms of PD1, PD-L1, PD-L2, TIM3, and CD80 expression on CD8+ T cells from 1 rLN and 1 DLBCL sample (left). PD1, PD-L1, PD-L2, BTLA, HVEM, CD80, TIM3, HLA-DR, and Ki67 expression on CD4+ and CD8+ T cells in DLBCL (n = 25), FL (n = 15), cHL (n = 10), and rLN (n = 7) samples (right). The percentage of Ki67+ cells and median fluorescence intensity (MFI) for other markers were normalized and hierarchically clustered using Tmev software. (B) Percentage of CD4+ and CD8+ T cells expressing PD1 and TIM3 in DLBCL (n = 25), FL (n = 15), cHL (n = 10), and rLN (n = 7) samples. (C) Percentage of PD1+TIM3+ CD8+ T cells and PD1+TIM3+ CD4+ T cells in GC DLBCL (n = 9), ABC DLBCL (n = 14), and FL (n = 15) samples. Correlation between percentages of PD1+TIM3+ CD8+ T cells and percentages of PD1+TIM3+ CD4+ T cells on DLBCL samples (GC, blue; ABC, red; unknown, green). (D) Representative mIHC staining in a DLBCL sample (magnification ×100). Yellow arrows show a CD8+ (blue), PD1+ (red), TIM3+ (green) cell that expresses Ki67 (white). *P < .05, **P < .01, ****P < .0001 by Mann-Whitney nonparametric U test.
PD1+TIM3+CD4+T cells and PD1+TIM3+CD8+T cells are enriched in ABC DLBCL tissues. (A) Representative histograms of PD1, PD-L1, PD-L2, TIM3, and CD80 expression on CD8+ T cells from 1 rLN and 1 DLBCL sample (left). PD1, PD-L1, PD-L2, BTLA, HVEM, CD80, TIM3, HLA-DR, and Ki67 expression on CD4+ and CD8+ T cells in DLBCL (n = 25), FL (n = 15), cHL (n = 10), and rLN (n = 7) samples (right). The percentage of Ki67+ cells and median fluorescence intensity (MFI) for other markers were normalized and hierarchically clustered using Tmev software. (B) Percentage of CD4+ and CD8+ T cells expressing PD1 and TIM3 in DLBCL (n = 25), FL (n = 15), cHL (n = 10), and rLN (n = 7) samples. (C) Percentage of PD1+TIM3+ CD8+ T cells and PD1+TIM3+ CD4+ T cells in GC DLBCL (n = 9), ABC DLBCL (n = 14), and FL (n = 15) samples. Correlation between percentages of PD1+TIM3+ CD8+ T cells and percentages of PD1+TIM3+ CD4+ T cells on DLBCL samples (GC, blue; ABC, red; unknown, green). (D) Representative mIHC staining in a DLBCL sample (magnification ×100). Yellow arrows show a CD8+ (blue), PD1+ (red), TIM3+ (green) cell that expresses Ki67 (white). *P < .05, **P < .01, ****P < .0001 by Mann-Whitney nonparametric U test.
In DLBCL, PD1+TIM3+ CD8+ TILs localize inside CD20+ B-cell clusters
We investigated the localization of T and B cells within lymphoma-involved lymph nodes. Frozen tissues from 6 DLBCL (GC, n = 3; ABC, n = 3), 2 FL, and 2 rLN patients were examined using 5-color multiplex immunofluorescence for PD1+TIM3− and PD1+TIM3+ CD8+ T cells and CD20+ cells. Both DLBCL and rLN were highly infiltrated by CD8+ T cells, with average CD8+/CD20+ ratios of 1:18 and 1:6, respectively, whereas FL tissues were less infiltrated (1:71; supplemental Table 3). In DLBCL tissues, CD8+ T cells sometimes expressed both PD1 and TIM3, with a high variability between patients in the examined tissues and with no observed differences between ABC and GC DLBCL subtypes. The median frequency of PD1+TIM3+ cells in the CD8+ T cell subset was 15%; this frequency fell to 2% for rLN and FL (Figure 3; supplemental Figure 2A; supplemental Table 3). In DLBCL, PD1+TIM3+ CD8+ T cells were observed inside CD20+ B-cell clusters, whereas in rLN, we found PD1+CD8+ (usually TIM3−) T cells at the periphery of CD20+ B-cell clusters (Figure 3; supplemental Figure 2B).
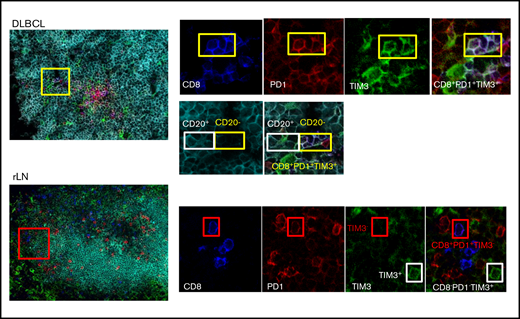
CD8+T-cell expression of PD1 and TIM3 in DLBCL vs rLN and their colocalization with B cells. In this DLBCL sample, the yellow box shows 4 cells expressing CD8 (blue), PD1 (red), and TIM3 (green) in contact with CD20+ lymphoma cells, identified by the white box. These CD8+ T cells frequently localize in the CD20+ infiltrate (turquoise). In this rLN sample, the CD8+ T cells (blue) sometimes express PD1 (red) but not TIM3 (green). They are found at the periphery of the CD20+ cluster. Original magnification ×60.
CD8+T-cell expression of PD1 and TIM3 in DLBCL vs rLN and their colocalization with B cells. In this DLBCL sample, the yellow box shows 4 cells expressing CD8 (blue), PD1 (red), and TIM3 (green) in contact with CD20+ lymphoma cells, identified by the white box. These CD8+ T cells frequently localize in the CD20+ infiltrate (turquoise). In this rLN sample, the CD8+ T cells (blue) sometimes express PD1 (red) but not TIM3 (green). They are found at the periphery of the CD20+ cluster. Original magnification ×60.
PD1+TIM3+ TIL characterization by transcriptome analysis
To define the molecular signature of dysfunctional PD1+TIM3+ TILs in DLBCL, we profiled their gene expression and compared them with PD1−TIM3− T-cell counterparts. We conducted this comparison for the CD4+ and CD8+ T-cell populations of 3 patients with DLBCL. The expression of 138 (18.2%) of 760 genes changed significantly (P < .05; |FC| > 2), with 40 upregulated and 98 downregulated genes in PD1+TIM3+ cells compared with PD1−TIM3− cells. Only 16 of 138 genes were specific for the CD4+ or CD8+ T-cell population, including 11 (68%) downregulated genes and 1 upregulated gene (PDCD1) in the CD4+ T-cell population and 4 upregulated genes in the CD8+ T-cell population (Figure 4A). The list of the top-10 upregulated genes in PD1+TIM3+ cells included: (1) chemokine ligands, including CCL3, CCL4, and CCL3L1, all 3 of which were located near to one another at the q arm of chromosome 17, and CXCL13, a molecule involved in the follicle homing of secondary lymphoid organs, which had the highest score;(2) cytotoxicity molecules granzyme B, A, and H, IFN-γ, and perforin; and (3) molecules involved in immune suppression, such as IL10 (Figure 4B). Besides PD1 and TIM3, multiple cell-surface inhibitors, including LAG3, TIGIT, TNFRSF9 (CD137), and CTLA4, were expressed. Downregulation of IL7R, CCR7, and TCF7 suggests a transition from a central memory to an exhausted or effector phenotype. The decreased expression of signaling membrane receptors (IL11RA, IL18R1, IL4R, IL5RA, and IL7R) and the downregulation of several genes encoding cytokines, including IL2, IL22, IL4, IL5, IL13, and IL12B, suggests loss of functionality via reduced cytokine signaling. Gene changes related to PD1+TIM3+ cells also affected transcription factors, with the upregulation of IRF8, EOMES, and IRF4, whereas RORA, RORC, GATA3, and STAT4 were downregulated, as were IFN response factors. We next analyzed the potential upstream regulators driving the significant changes in the data set. Prediction of downregulated upstream factors in PD1+TIM3+ cells revealed TNF (with the highest score) and then TNFRSF1A, IL1A, and PTGS2; the expression of these 4 genes tended to be repressed in our data set (Figure 4C). In contrast, predictions of upregulated upstream factors identified the 2 transcription factors TBX21 and RUNX3 (Figure 4C).
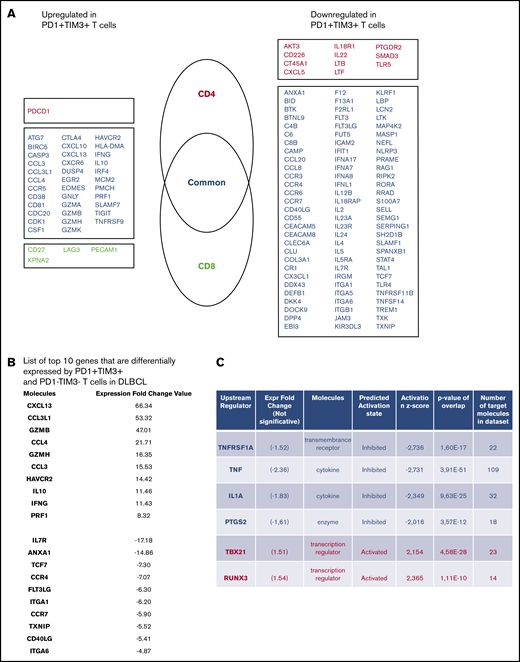
PD1+TIM3+T cells display an exhausted transcriptomic signature. (A) Genes differentially expressed by PD1+TIM3+ and PD1−TIM3− T-cell subsets. Genes are classified as specific to CD4+ T cells (red) or CD8+ T cells (green) or common to both subsets (blue). (B) List of top-10 genes differentially expressed by PD1+TIM3+ and PD1−TIM3− T-cell subsets. (C) Upstream regulators for genes differentially expressed by PD1+TIM3+ and PD1−TIM3− T-cell subsets.
PD1+TIM3+T cells display an exhausted transcriptomic signature. (A) Genes differentially expressed by PD1+TIM3+ and PD1−TIM3− T-cell subsets. Genes are classified as specific to CD4+ T cells (red) or CD8+ T cells (green) or common to both subsets (blue). (B) List of top-10 genes differentially expressed by PD1+TIM3+ and PD1−TIM3− T-cell subsets. (C) Upstream regulators for genes differentially expressed by PD1+TIM3+ and PD1−TIM3− T-cell subsets.
Altered functional responses of PD1+TIM3+ TILs in DLBCL
We next wanted to evaluate the functional capacities of TILs isolated from DLBCL tumors. Proliferative capacity of and cytokine production by CD8+ and CD4+ T cells from 13 DLBCL samples in response to TCR stimulation were assessed in vitro. We compared results with those obtained for a control group comprising cells from 3 rLN, 6 cHL, and 3 FL samples. CD8+ and CD4+ T cells from DLBCL samples proliferated and secreted IFN-γ significantly less in response to CD3/CD28 stimulation than those from the control group (Figure 5A). Interestingly, these functional losses were proportional to the percentage of tumor-infiltrating PD1+TIM3+ T cells, particularly for the CD8+ T-cell subset (Figure 5B; supplemental Figure 3A). The decrease in cell proliferation correlated with the diminished IFN-γ secretion, suggesting that both functions were reduced in parallel upon TCR activation (Figure 5C). A 5 times higher dose of anti-CD3 and anti-CD28 mAbs produced similar results (supplemental Figure 3A-B). We then tested T-cell activation by PMA and ionomycin and measured the capacity of PD1+TIM3+ TILs to secrete IL-2, TNF-α, IFN-γ, and granzyme B. In the CD8+ T-cell population, we found an inverse correlation between IL-2 or TNF-α production and the percentage of tumor-infiltrating PD1+TIM3+ CD8+ T cells (supplemental Figure 3C). In contrast, increased granzyme B production paralleled increased PD1+TIM3+ CD8+ T-cell infiltration (Figure 5D). Interestingly, although we did not observe a correlation between IFN-γ production and CD8+ T-cell infiltration, IFN-γ production increased significantly as tumor infiltration by PD1+TIM3+ CD4+ T cells increased (supplemental Figure 3C). These results were specific to DLBCL tumors, whatever the cell-of-origin classification, and were not observed in the control group, with the exception of a correlation between IFN-γ production and CD4+ T-cell infiltration (supplemental Figure 4). Taken together, functional analyses of TIM3+PD1+ T cells confirmed the transcriptome profiling data by revealing impaired cytokine production; however, these cells maintained their capacity to produce cytotoxic granzyme B.
![In DLBCL tumors, PD1+TIM3+T cells are exhausted. CellTrace violet–labeled mononuclear cells from DLBCL (n = 13) and control group (n = 12 [rLN, n = 3; cHL, n = 6; FL, n = 3]) tissues were activated by plate-coated CD3 and soluble CD28 antibodies. (A) Proliferative capacity of CD4+ and CD8+ T cells, determined by the percentage of CellTracedim cells and the concentration of IFN-γ detected in the culture supernatant. (B) Correlation between the percentage of PD1+TIM3+ CD4+ or CD8+ T cells and their proliferation and IFN-γ secretion (n = 18 or 20 DLBCL). (C) Correlation between the percentage of proliferated T cells and the concentration of IFN-γ detected in the supernatant (n = 18 or 20 DLBCL;GC, blue; ABC, red; unknown, green). (D) Correlation between percentage of CD4+ or CD8+ T cells coexpressing PD1 and TIM3 and their intracellular IFN-γ or granzyme B secretion (n = 12; GC, blue; ABC, red; cell of origin not defined, green).](https://ash.silverchair-cdn.com/ash/content_public/journal/bloodadvances/5/7/10.1182_bloodadvances.2020003080/3/m_advancesadv2020003080f5.png?Expires=1769084470&Signature=QNOq9hXjyefbmipVAwWIxl0Tezq1EOg001fiYizrs~JE6HffVP4JOhTFCCq9uqjaDFB6TzKti0HUA1EbBxklgH9V~r~8Aw72T4-8O2NO~taZeDjEqIDdJzfNTk1MRkiOXZ2olRoz8cPXbDzWd7urLTBF1dKCWROaeob6Yvxr6kDXf0er3UszFpNGEVF3uPCz5kz011zwAbjPK9HR-o--FRiCdssZcaOfn9~xpSh55GywkabqeZk6d~BWLFZTron7EiVMTxLmCkwDixigT1BIReXtPZa2OT5Ms5RrJCo65iPLkaq28fECWNdqcWIyYY1lsutPjiH~~a87Uop1vQgNdA__&Key-Pair-Id=APKAIE5G5CRDK6RD3PGA)
In DLBCL tumors, PD1+TIM3+T cells are exhausted. CellTrace violet–labeled mononuclear cells from DLBCL (n = 13) and control group (n = 12 [rLN, n = 3; cHL, n = 6; FL, n = 3]) tissues were activated by plate-coated CD3 and soluble CD28 antibodies. (A) Proliferative capacity of CD4+ and CD8+ T cells, determined by the percentage of CellTracedim cells and the concentration of IFN-γ detected in the culture supernatant. (B) Correlation between the percentage of PD1+TIM3+ CD4+ or CD8+ T cells and their proliferation and IFN-γ secretion (n = 18 or 20 DLBCL). (C) Correlation between the percentage of proliferated T cells and the concentration of IFN-γ detected in the supernatant (n = 18 or 20 DLBCL;GC, blue; ABC, red; unknown, green). (D) Correlation between percentage of CD4+ or CD8+ T cells coexpressing PD1 and TIM3 and their intracellular IFN-γ or granzyme B secretion (n = 12; GC, blue; ABC, red; cell of origin not defined, green).
In DLBCL tumors, PD1+TIM3+T cells are exhausted. CellTrace violet–labeled mononuclear cells from DLBCL (n = 13) and control group (n = 12 [rLN, n = 3; cHL, n = 6; FL, n = 3]) tissues were activated by plate-coated CD3 and soluble CD28 antibodies. (A) Proliferative capacity of CD4+ and CD8+ T cells, determined by the percentage of CellTracedim cells and the concentration of IFN-γ detected in the culture supernatant. (B) Correlation between the percentage of PD1+TIM3+ CD4+ or CD8+ T cells and their proliferation and IFN-γ secretion (n = 18 or 20 DLBCL). (C) Correlation between the percentage of proliferated T cells and the concentration of IFN-γ detected in the supernatant (n = 18 or 20 DLBCL;GC, blue; ABC, red; unknown, green). (D) Correlation between percentage of CD4+ or CD8+ T cells coexpressing PD1 and TIM3 and their intracellular IFN-γ or granzyme B secretion (n = 12; GC, blue; ABC, red; cell of origin not defined, green).
PD1+TIM3+ TILs exhibited broad markers of exhausted phenotype
PD1 expression is rapidly upregulated upon T-cell activation and may persist at moderate levels in healthy humans. In addition to PD1, exhausted T cells express a range of other cell-surface inhibitory molecules that can act in synergy. We investigated the expression of additional functional molecules by CD8+ and CD4+ T-cell populations in DLBCL and compared results for the PD1+TIM3+, PD1+TIM3−, and PD1−TIM3− subsets. PD1+TIM3+ CD8+ T cells expressed the lowest levels of CD45RA, CCR7, and CD127 and had increased expression of CD27 and CD28. Taken together, this is indicative of a dynamic phenotype, where CD8+ T cells are progressively skewed toward an effector memory phenotype (Figure 6A). Compared with PD1+TIM3− and PD1−TIM3− CD8+ T-cell subsets, PD1+TIM3+ CD8+ T cells significantly upregulated phenotypically by flow cytometry: (1) CD38, HLA-DR, and CD57 activation markers; (2) a broad range of inhibitory receptors, including TIGIT, CD39, LAG3, CTLA-4, PD-L1, and 2B4; (3) the transcription factor EOMES; (4) the proliferation marker Ki67; and (5) the cytotoxic molecules perforin and granzyme B (Figure 6B). Similar results were observed for the CD4+ T-cell population and the comparison between the PD1+TIM3+ and PD1+TIM3−/PD1−TIM3− subsets (supplemental Figure 5).
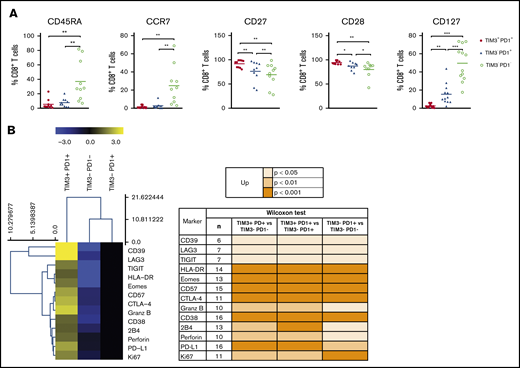
The PD1+TIM3+T cell–exhausted phenotype. (A) Expression of CD45RA, CCR7, CD27, CD28, and CD127 by PD1+TIM3+, PD1+TIM3−, and PD1−TIM3− CD8+ T-cell subsets (n = 10 DLBCL). (B) Expression of inhibitory, proliferation, and effector markers among CD8+ T-cell subsets. For each marker, the percentage was normalized and hierarchically clustered using Tmev software. *P ≤ .05, **P < .01, ***P < .001 by Wilcoxon parametric test.
The PD1+TIM3+T cell–exhausted phenotype. (A) Expression of CD45RA, CCR7, CD27, CD28, and CD127 by PD1+TIM3+, PD1+TIM3−, and PD1−TIM3− CD8+ T-cell subsets (n = 10 DLBCL). (B) Expression of inhibitory, proliferation, and effector markers among CD8+ T-cell subsets. For each marker, the percentage was normalized and hierarchically clustered using Tmev software. *P ≤ .05, **P < .01, ***P < .001 by Wilcoxon parametric test.
Restoration of TIL proliferation after blockade of PD1 or TIM3
TILs, particularly the PD1+TIM3+ CD8+ T-cell subset, significantly upregulated the expression of the nuclear protein Ki67, indicating that cells in all phases of the cell cycle are present (Figure 2A,D). We therefore determined the in vitro proliferative capacity of CD8+ and CD4+ TILs after CD3/CD28 stimulation for 5 days. In addition, we assessed the production of IFN-γ secondary to the stimulation. Results compared PD1+TIM3+, PD1+TIM3−, and PD1−TIM3− subsets based on a flow cytometric gating strategy. At the end of the culture, PD1−TIM3− cells had mostly undergone several cycles of division (mean ± SEM, 83.8% ± 1.5% and 60% ± 11% for PD1−TIM3− CD8+ and PD1−TIM3− CD4+ T cells, respectively). PD1+TIM3− subsets proliferated moderately, whereas PD1+TIM3+ cells barely proliferated (mean ± SEM, 6.6% ± 5%, 15.3% ± 6%, 2.8% ± 1.3%, and 19% ± 6.3% for PD1+TIM3+ CD8+, PD1+TIM3− CD8+, PD1+TIM3+ CD4+, and PD1+TIM3− CD4+ T cells, respectively; Figure 7A). In addition, only PD1−TIM3− subsets produced high levels of IFN-γ (mean ± SEM, 127 ± 105, 148 ± 61, and 1063 ± 395 pg/mL for PD1+TIM3+, PD1+TIM3−, and PD1−TIM3− T cells, respectively; Figure 7B). In contrast, and in accordance with the above findings, intracellular detection of IL-2, TNF-α, IFN-γ, and granzyme B after PMA/ionomycin stimulation revealed that, compared with PD1−TIM3− subsets, PD1+TIM3+ cells decreased their IL-2 secretion but significantly increased their IFN-γ and granzyme B secretion. The PD1+TIM3− subsets were somewhat intermediate between the 2 other phenotypes (Figure 7B; supplemental Figure 6). Finally, we blocked PD1 and/or TIM3 molecules by use of inhibitory mAbs and tested TIL proliferation after CD3/CD28 stimulation. Proliferation of the CD4+ and CD8+ T-cell populations significantly increased (P < .05) when anti-PD1 or anti-TIM3 mAbs were added to the culture compared with control isotype mAbs (Figure 7C). We did not observe synergistic effects when anti-PD1 and anti-TIM3 mAbs were combined. Finally, we reasoned that the level of infiltration by TIM3+PD1+ TILs in DLBCL tumors could have an impact on the prognosis of patients. To explore this idea, we used a public RNA sequencing data set of 928 DLBCL samples38 and found that patients with low expression levels for HAVCR2 (encodes TIM3) and PDCD1 (encodes PD1) genes had significantly worse outcomes than others (Figure 7D).
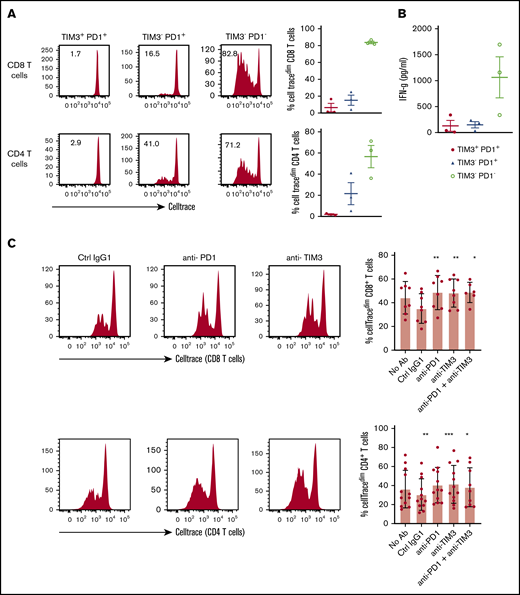
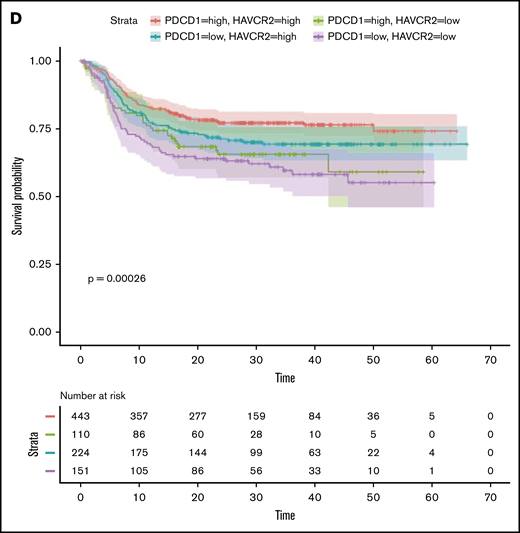
In DLBCL, PD1 and TIM3 are involved in T-cell exhaustion. (A) Representative histograms of the proliferation (evaluated by the percentage of CellTracedim cells) of each CD8+ and CD4+ T-cell subset (n = 3 DLBCL). (B) IFN-γ secretion in the supernatant of each T-cell subset was measured by enzyme-linked immunosorbent assay (n = 3 DLBCL). (C) CellTrace violet–labeled mononuclear cells from DLBCL samples (n = 8-12) were activated by plate-coated CD3 and soluble CD28 antibodies. Blocking monoclonal antibodies or control isotype antibodies were added at 10 μg/mL. Representative histograms of the proliferation of CD8+ T cells and CD4+ T cells (left) and percentage of T cells undergoing proliferation (right) in DLBCL in the presence of anti-PD1 or anti-TIM3 antibodies or a combination of both antibodies vs control immunoglobulin G1 (IgG1) antibodies. (D) Event-free survival for the 928 DLBCL patients (GSE117556 cohort). Patients stratified according to PDCD1 and HAVCR2 expression in 4 subgroups after thresholds were defined using the MaxStat package 0.7-25 (https://cran.r-project.org/web/packages/maxstat/index.html). Survival probability was calculated with a log-rank test. *P < .05, **P < .01, ***P < .001 by Wilcoxon parametric test.
In DLBCL, PD1 and TIM3 are involved in T-cell exhaustion. (A) Representative histograms of the proliferation (evaluated by the percentage of CellTracedim cells) of each CD8+ and CD4+ T-cell subset (n = 3 DLBCL). (B) IFN-γ secretion in the supernatant of each T-cell subset was measured by enzyme-linked immunosorbent assay (n = 3 DLBCL). (C) CellTrace violet–labeled mononuclear cells from DLBCL samples (n = 8-12) were activated by plate-coated CD3 and soluble CD28 antibodies. Blocking monoclonal antibodies or control isotype antibodies were added at 10 μg/mL. Representative histograms of the proliferation of CD8+ T cells and CD4+ T cells (left) and percentage of T cells undergoing proliferation (right) in DLBCL in the presence of anti-PD1 or anti-TIM3 antibodies or a combination of both antibodies vs control immunoglobulin G1 (IgG1) antibodies. (D) Event-free survival for the 928 DLBCL patients (GSE117556 cohort). Patients stratified according to PDCD1 and HAVCR2 expression in 4 subgroups after thresholds were defined using the MaxStat package 0.7-25 (https://cran.r-project.org/web/packages/maxstat/index.html). Survival probability was calculated with a log-rank test. *P < .05, **P < .01, ***P < .001 by Wilcoxon parametric test.
Discussion
In this study, we performed a systematic analysis to define the phenotype and functional capacities of CD8+ and CD4+ infiltrating T cells in DLBCL tumors. To this end, we analyzed cell suspensions obtained from tumor biopsies and compared DLBCL with FL, cHL, and rLN tissues. The comparison of PD-L1 expression by B cells in the various tumor tissues revealed that PD-L1 was significantly higher in B cells from DLBCL, particularly in B cells from the ABC subtype, as previously described in patient studies39,40 and in accordance with a mouse model of ABC DLBCL where tumors contained PD-L1+ B cells associated with a tumor microenvironment enriched for CD8+ T cells at the expense of CD4+, as in our study (supplemental Figure 1)41 .
In contrast to GC DLBCL, in ABC DLBCL, CD8+ and CD4+ T-cell populations showed high expression of the proliferation marker Ki67, associated with an increase in HLA-DR and regulatory surface proteins, such as PD1 and TIM3. Thus, although the percentage of CD4+ T cells was ultimately decreased in DLBCL, in ABC DLBCL, both CD8+ and CD4+ T-cell compartments presented PD1+TIM3+ cells with an activated phenotype and similar transcriptomes. The PD1+TIM3+ cells increased their expression of the cytotoxic molecules, such as granzymes, IFN-γ, and perforin, but also chemokine ligands, particularly CXCL13, a molecule involved in the homing of CXCR5+ T and B cells to follicles of secondary organs. This later finding is consistent with immunofluorescence experiments and the enrichment of PD1+TIM3+ CD8+ T cells in CD20+ B-cell clusters, in accordance with the recruitment of CXCR5+CD8+ effector T cells in tumors.42 Collectively, our findings suggest that in ABC DLBCL, the tumor microenvironment exhibits all the features of an operative cellular immune response. However, the response differs from patient to patient, in accordance with previously described T cell–inflamed and non–T cell–inflamed phenotypes in solid tumors where increased TILs are associated with the former.43-45 The T cell–inflamed subset of tumors was dominated by T-cell markers and chemokines that likely mediated effector T-cell recruitment, increasing antitumor T-cell response, which is consistent with the fact that patients with DLBCL expressing high levels of HAVCR2 (encodes TIM3) and PDCD1 (encodes PD1) have better clinical outcomes than low expressors (Figure 7D).
Gene expression profiling revealed that PD1+TIM3+ T cells presented decreased expression of TCF7, which encodes the transcription factor TCF1. TIM3+TCF1− CD8+ T cells corresponded to terminally exhausted TILs that lost the capacity to respond to PD1 blockade.46,47 Functional investigations confirmed that the decline in IL-2 production (as well as TNF-α and IFN-γ) correlated with an increase in PD1+TIM3+ T-cell infiltration. In parallel, the PD1+TIM3+ cells lost their proliferative capacity after CD3/CD28 stimulation, despite the fact that they expressed the proliferative marker Ki67. In contrast, bioinformatic prediction of upregulated upstream regulators identified an imprint of TBX21/T-bet and RUNX3 in these cells, 2 transcription factors described, respectively, as related to functionally efficient or reactivable TILs and as supporting the expression of crucial tissue-residency genes while suppressing genes associated with tissue egress and recirculation.48,49 This finding suggests that PD1+TIM3+ TILs in DLBCL remain functionally reactivable. Indeed, our TCR activation assays showed an increase in granzyme B and IFN-γ production proportional, respectively, to the increase of PD1+TIM3+ CD8+ and CD4+ TILs (Figure 5D). Overall, our data are consistent with the fact that DLBCL exhibits a dynamic tumor-specific response, which needs to be reactivated through the restoration of the proliferative capacity of terminal differentiated PD1+TIM3+ TILs.
Mechanisms by which antibody blockade of PD1 reinvigorates T cells are not fully understood; however, a specific subpopulation of exhausted CD8+ TILs retain polyfunctionality and respond to anti-PD1 therapy.46 However, in refractory/relapsed DLBCL, only low response rates to anti-PD1 monotherapy have been observed in unselected patients.50 Recurrent genetic alterations may facilitate escape from immune surveillance, including, for example, gene inactivation of β2-microglobulin and CD58 or, in ABC DLBCL, loss of major histocompatibility complex II expression.51,52 However, in ABC DLBCL, the presence of PD-L1+ B cells associated with PD1+ TILs supports the rationale behind current ongoing therapeutic strategies combining anti-PD1 mAbs with anti-CD20–based chemotherapy (registered at www.clinicaltrials.gov as #NCT02541565, #NCT03259529, and #NCT03366272). The combination of immune checkpoint blockers with small molecules (eg, inhibition of BTK) or with immunomodulatory imide drugs may also improve antitumor immune response.53 In our study, CD4+ and CD8+ TILs restored their proliferative response to CD3/CD28 stimulation after PD1 or TIM3 blockade. Thus, the immune response, although blunted, can be restored by different pathways, and this reactivation occurs for both CD8+ and CD4+ TILs.
Even taking into account the small sample size, among the striking information from our study is the fact that PD1 and TIM3 pathways seemed to be independent, meaning they are not synergistic. Therefore, different T-cell subsets with different requirements are operating in lymphoma. The most straightforward conclusion is that both pathways should be targeted, with differences between DLBCL patients that need to be identified. Additional investigations should include single-cell transcriptome analysis, helpful in such questions, and, of course, a greater number of samples tested and the genetic diversity of DLBCL analyzed. Interestingly, our data can be compared with a recent case report showing that CD8+ T cells and CAR T cells from a patient with DLBCL treated with CAR T-cell therapy exhibited overexpression of PD1 and TIM3 before the contraction of the CAR T-cell population.54
Our study supports the concept that successful therapies should harness those cells that limit tumor growth, particularly T cells and other immune cells. The extraordinary success of cancer immunotherapy implies that immune checkpoints hold promising therapeutic potential in ABC DLBCL. Our study provides preclinical proof of concept for the clinical evaluation of incorporating anti-PD1–based therapy into the current anti-CD20–based modalities as combination immunotherapy for ABC DLBCL. The lack of direct synergy between PD1 and TIM3 blockade was not really expected here in light of current studies in solid tumors evaluating such a combination.55 Therefore, in DLBCL, further preclinical evaluation is required for dual blockade, bearing in mind that such an approach may carry potential risks, as has been seen with CTLA/PD1 blockade in melanoma. Our study sheds light on another surprising feature in DLBCL, which concerns the diversity of markers of inhibitory pathways detected on TILs, such as TIGIT and ectonucleotidases (CD39), and the increased expression of the CD80 marker on CD4+ and CD8+ T cells, which could affect the PD1/PD-L1 functional axis.56 The intimate relationship between T cells and lymphoma cells in ABC DLBCL demonstrates that both inhibitory and activating pathways could be tackled to unleash immune responses and allow adequate T-cell effector functions, with these cells expressing high levels of cytotoxic molecules, as shown in our study.
For data sharing, please contact the corresponding author at thierry.fest@univ-rennes1.fr.
Acknowledgments
The authors thank the pathologists, biologists, and clinicians, particularly those from the BREHAT group, who participated in the collection of samples and clinical data annotation. The authors acknowledge the Centre de Ressources Biologiques-Santé (BB-0033-00056) of Rennes Hospital and the Paoli-Calmette Institute (AC 2018-1905) Biobank for their support in the processing of biological samples, as well as the CeVi collection of the Institute Carnot/CALYM.
The team of D.O. was supported by the grant Equipe FRM DEQ20180339209 from the Equipe Fondation pour la Recherche Médicale. D.O. is a senior scholar at the Institut Universitaire de France.
Authorship
Contribution: K.-S.L., M.R., T.F., and D.O. designed the research; K.-S.L., M.R., C.G., F.L.G., and E.F. performed the research; K.-S.L., M.R., D.O., and T.F. analyzed the data; S.L.G. and E.T. assisted with the experiments; L.X., C.P., V.L., and T.L. provided FL samples; and M.R., K.-S.L., and T.F. wrote the paper.
Conflict-of-interest disclosure: D.O. is cofounder of ImCheck Therapeutics, Alderaan Biotechnology, and Emergence Therapeutics and is a shareholder in these companies. The remaining authors declare no competing financial interests.
The current affiliation for K.-S.L. and E.F. is ImCheck Therapeutics, Marseille, France.
Correspondence: Thierry Fest, Inserm UMR1236, Faculté de Médecine, 2 Av du Pr Léon Bernard, CS 34317, F-35043 Rennes Cedex, France; e-mail: thierry.fest@univ-rennes1.fr; and Daniel Olive, Inserm UMR1068, CNRS UMR7258, Université Aix Marseille U105, Institut Paoli Calmettes, F-13273 Marseille Cedex 09, France; e-mail: daniel.olive@inserm.fr.

