

Key Points
GVL activity in patients receiving DLI for relapse after allogeneic hematopoietic stem cell transplantation is associated with clonal expansion of CD8+ T cells.
Absence of clonal expansion of the CD8+TRB repertoire after DLI predicts relapse at a median time of 11.2 months before clinical diagnosis.

Abstract
Donor lymphocyte infusion (DLI) is a standard of care for relapse of acute myeloid leukemia after allogeneic hematopoietic stem cell transplantation. Currently it is poorly understood how and when CD8+ αβ T cells exert graft-versus-leukemia (GVL) activity after DLI. Also, there is no reliable biomarker to monitor GVL activity of the infused CD8+ T cells. Therefore, we analyzed the dynamics of CD8+ αβ T-cell clones in patients with DLI. In this prospective clinical study of 29 patients, we performed deep T-cell receptor β (TRB ) sequencing of sorted CD8+ αβ T cells to track patients’ repertoire changes in response to DLI. Upon first occurrence of GVL, longitudinal analyses revealed a preferential expansion of distinct CD8+TRB clones (n = 14). This did not occur in samples of patients without signs of GVL (n = 11). Importantly, early repertoire changes 15 days after DLI predicted durable remission for the 36-month study follow-up. Furthermore, absence of clonal outgrowth of the CD8+TRB repertoire after DLI was an early biomarker that predicted relapse at a median time of 11.2 months ahead of actual diagnosis. Additionally, unbiased sample analysis regardless of the clinical outcome revealed that patients with decreasing CD8+TRB diversity at day 15 after DLI (n = 13) had a lower relapse incidence (P = .0040) compared with patients without clonal expansion (n = 6). In conclusion, CD8+TRB analysis may provide a reliable tool for predicting the efficacy of DLI and holds the potential to identify patients at risk for progression and relapse after DLI.
Introduction
Relapse of acute myeloid leukemia is the main driver of mortality after allogeneic hematopoietic stem cell transplantation (aHSCT).1 In contrast to targeted and classical chemotherapy or irradiation, donor lymphocyte infusions (DLIs) represent a potential curative treatment option for relapse after aHSCT. The concept of transferring donor T cells aims at (re)enforcing a graft-versus-leukemia (GVL) effect targeting the recurring malignant cells.2 GVL is thought to be mainly driven by CD8+ T cells.3-5 Commonly, DLI is applied in incremental doses until remission is achieved or signs of graft-versus-host disease (GVHD) appear.6 Currently, response to DLI is assessed based on donor chimerism dynamics and/or monitoring of minimal residual disease (MRD) markers as well as cytology and clinical presentation of the patient.
T-cell receptor (TCR) repertoire analyses provide the opportunity to observe kinetics of overall T-cell diversity and outgrowth of specific T-cell clones in individuals. Information on TCR-based repertoire dynamics in patients receiving DLI is just evolving. The few available studies have used spectratyping.7 Some of those studies have shown an oligoclonal T-cell response associated with GVL after DLI,8,9 whereas others described normalization of CDR3 spectratypes.10 However, spectratyping does not allow measuring the frequency of individual TCRs and only roughly reflects repertoire diversity. With the advent of deep sequencing technology, methods became available that provide a direct measure of high-resolution TCR diversity.11-14 For example, TCR dynamics assessed via next-generation sequencing revealed oligoclonal expansions of T-cell clones in response to virus reactivation or prevention of GVHD in aHSCT cohorts.15-17 In the context of DLI, deep TCR sequencing data to characterize GVL on the clonal level are still limited. Although 1 study examining the effect of sorafenib and DLI showed a lower TCR diversity in responders,18 another study in patients with myeloid malignancies reported no difference in overall CD8+ diversity regarding GVL after DLI. Nevertheless, expansion of alloreactive T cells in patients with GVL was described.19 Most available studies used bulk CD3+ T cells for TCR repertoire sequencing, neglecting the opposing biological effects of T-cell subsets such as CD8+ cytotoxic T cells and CD4+FOXP3+ regulatory T cells.18,20 Therefore, we considered sorting of T-cell subsets before TCR analysis as crucial for obtaining more (biologically) meaningful results.
To this end, we performed TCR repertoire analyses of CD8+ T cells in patients receiving DLI treatment of relapse after aHSCT. The sequences of T-cell receptor β (TRB) chains of sorted CD8+ αβ T cells were monitored longitudinally by deep sequencing of the CDR3 region, and the corresponding individual clinical outcome to DLI treatment was observed over a subsequent period of 36 months. The study had 2 objectives: (1) to examine a potential correlation of GVL and the composition of the CD8+TRB repertoire and (2) to analyze the predictive value of early TRB repertoire dynamics regarding successful DLI therapy or disease relapse.
In this study, we show that an effective GVL effect is associated with a substantial reduction of CD8+TRB diversity and a concomitant expansion of dominant clones. Moreover, failure of DLI can be predicted already at an early point after DLI using CD8+TRB diversity dynamics. This is further accompanied by characteristic changes in the CD8+TRB repertoire detected at a median of 11.2 months before onset of relapse or leukemia progression. These findings imply that CD8+TRB repertoire analysis might serve as a predictive tool of a DLI response.
Materials and methods
Cohort and study design
Twenty-nine patients receiving DLI treatment of clinical or molecular relapse or increased host chimerism after aHSCT were recruited at Hannover Medical School from 2015 to 2017. The study was approved by the institutional review board (#2604-2015), and written informed consent was obtained from all participants.
Blood samples were taken before and at subsequent time points after DLI (supplemental Figures 1 and 2). Patients in complete remission, including absence of host chimerism and lack of MRD, were excluded (n = 3), as were patients with isolated extramedullary relapse (n = 3). Furthermore, samples with concomitant use of steroids or chemotherapeutic agents or samples taken during active viral infections were excluded (supplemental Table 1). In total, 115 patient samples were available, of which 73 met inclusion criteria for TRB repertoire analysis. All samples included for analysis were evaluated for criteria of GVL or noGVL. Besides cytologic and clinical evaluation of remission, recent advances in molecular diagnostics, including high sensitivity chimerism21 and MRD analyses,22 offer more sensitive measures for GVL assessment. Because no consensus regarding GVL definition exists, we integrated current European LeukemiaNet (ELN) guidelines on MRD diagnostics23 together with current knowledge about high-sensitivity chimerism21 for definition of GVL activity (Table 1). Occurrence of GVL was assessed at least twice within the first month after administration of every DLI, followed by evaluations 1 to 2 times per month. High-sensitivity chimerism was analyzed in the department’s chimerism laboratory as published.21 MRD markers were analyzed via deep sequencing in the department’s molecular genetics laboratory as published.22 Cytological remission criteria were used according to current ELN definitions.23
Definition of GVL and noGVL
| GVL | noGVL |
|---|---|
| Relative decrease of host chimerism by ≥50% (compared with previous time point) or absolute decrease by ≥1.00% or Stable* host chimerism after previous GVL and/or Conversion of MRD from positive to negative or MRD level decrease by ≥10-fold and no cytologic or extramedullary relapse/progressive disease | Stable*/increased host chimerism (compared with previous time point) and/or MRD persistence or MRD level decrease by <10-fold and/or molecular, cytologic, or extramedullary relapse/progressive disease |
Stable host chimerism was defined as <50% decrease or increase of host chimerism compared with previous time point.
Flow cytometry and cell sorting
Peripheral blood mononuclear cells were stained with CD45-APC-Vio770 (clone 5B1, No. 130-096-609, Miltenyi Biotec), TCRγδ-PE (clone 11F2, No. 333141, BD Biosciences), TCR-αβ-FITC (clone BW 242/412, No. 130-098-688, Miltenyi Biotec), CD4-PerCP (clone M-T466, No. 130-101-147, Miltenyi Biotec), CD8-VioGreen (clone BW 135/80, No. 130-096-902, Miltenyi Biotec), and DAPI. Cell sorting of CD8+ T cells was performed on BD FACSAria Fusion (BD Biosciences). Flow cytometry data were analyzed using FlowJo (version 10, TreeStar).
cDNA synthesis and next-generation sequencing
Reverse transcription of extracted RNA was conducted using SMARTer RACE 5'-3' PCR Kit (Clontech) as described by van Heijst et al.16 within a customized protocol.17 To amplify the CDR3 region, transcribed cDNA was subject to RACE polymerase chain reaction (PCR).17 CDR3 amplicons were then prepared for paired-end Illumina sequencing as described.15,16 During all PCR steps, negative controls (H2O) were run together with the patient material to rule out PCR contamination.
Sequence analysis
FastQ files were prepared as described elsewhere.17 Next, raw sequencing data were extracted via MIXCR (version 2.1.11) with alignment of nucleotide sequences based on IMGT database (22.05.2018), including correction of PCR errors. Alignment and assembling were performed with MIXCR default options.17 Before further bioinformatics analyses, all samples were randomly normalized to 20 000 reads to avoid bias due to diverging sequencing depths. This was done by using a custom bash script as part of our streamline data analysis method resulting in a standardized downsampling function (https://github.com/MHHIMMUNOLOGY/MHHTCR_ANALYSIS). TCR repertoire analysis was based on usage of VDJtools,24 tcR-package.25 Repertoire diversity was assessed using the inverse Simpson’s diversity index, as described elsewhere.26 CD8+TRB repertoires were further analyzed with regard to the number of unique clonotypes required to occupy 25%, 50%, 75%, and 100% of the CD8+ repertoire (clonal space). For this analysis, clonotypes were used in decreasing order of their abundance, identifying the minimal number of unique clonotypes required to cover each defined segment of the CD8+ repertoire. To investigate the clonal properties of each sample in detail, we chose to split the repertoire into the top 20, top 21 to 50, and top 51 to N occurring clones (clonal proportions). These 3 categories allowed us to study the clones with regard to their frequency and simultaneously display the individual temporal course of every single CDR3 sequence of the top 20 highly expanded clones. This clonal proportions analysis was also applied to overlapping clonotypes, which were defined as identical CD8+ clones present at more than 1 time point in individual patients (intrapatient comparison). To determine the dynamics of DLI CD8+ clonotypes, only overlapping clones present in the DLI cell product were selected (including preexisting clones). Additionally, the role of new DLI CD8+ T-cell clones was investigated by identifying only those DLI clones that were not detected in the pre-DLI sample (exclusion of preexisting clones).
CD8+ CDR3 amino acid sequences were searched for published functionality data in the VDJ CDR3 database and Chinese National Gene Bank Pan Immune Repertoire database. Generation probabilities (pGen) of each CDR3 sequence (ie, publicity) were calculated by the optimized likelihood estimate of immunoglobulin amino-acid sequences (OLGA) software in Python 2.7 environment.27
Statistical analysis
Statistical analyses were conducted with Prism 8 (GraphPad). For analysis of longitudinal changes within 1 patient (intragroup comparison), two-tailed Wilcoxon matched-pairs signed ranked test was used. For intergroup comparisons, two-tailed Mann-Whitney test was performed. Cumulative incidence of relapse (CIR) and nonrelapse mortality (NRM) were analyzed by means of cumulative incidence curves using Gray’s test.28 Univariate analysis (UVA) was performed with Fisher's exact test for categorical variables and Mann-Whitney test for numerical variables (two-tailed, exact). Interdependence of descriptive variables was checked by multivariate analysis (MVA). We applied analysis of variance (R function analysis of variance) testing either with all variables (categorized to 2 levels, when applicable) for the GVL vs noGVL comparison or using only variables significantly correlating with dependent variable at P < .25 for the no relapse vs relapse comparison. For the expansion vs no expansion comparison, we used multivariate Cox and Gray competing risk regression models (R packages survival and cmprsk).29 Variables found to be significant with P < .25 in respective UVA were used in MVA. Backward elimination procedure was used to reduce the number of variables until remaining variables were fitting a model at P < .05.
Results
Cohort characteristics and response to DLI
In this prospective observational study, 29 patients receiving DLI treatment of relapse or increased host chimerism after aHSCT were recruited, of whom 23 met inclusion criteria (supplemental Figures 1 and 2). Patient characteristics as well as details on relapse treatment and corresponding response before DLI are shown in supplemental Tables 2 and 3. During the study period of 36 months after DLI, GVL activity was closely monitored (Table 1). Ten patients had continuous GVL response, 7 had intermittent GVL response, and 6 patients did not respond to DLI (Figure 1; Table 2). Nonresponders had high-risk disease, received their DLI earlier after aHSCT, experienced more relapses, and had a reduced survival compared with GVL responders (Table 2; supplemental Table 4).
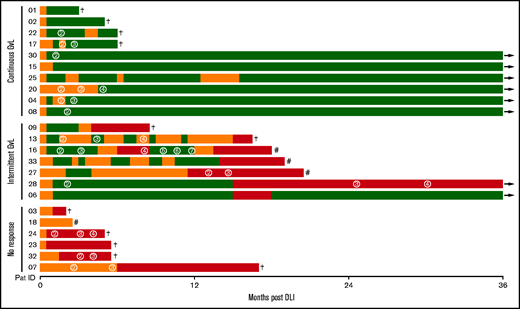
Response to DLI. Every line represents 1 individual patient with color coding detailing timing and duration of GVL (green) and noGVL (orange) response or relapse (red). First DLI was given at baseline. Numbers in circles indicate the consecutive number of further DLIs. Follow-up was 36 months. †, death; #, 2nd aHSCT; →, continued survival.
Response to DLI. Every line represents 1 individual patient with color coding detailing timing and duration of GVL (green) and noGVL (orange) response or relapse (red). First DLI was given at baseline. Numbers in circles indicate the consecutive number of further DLIs. Follow-up was 36 months. †, death; #, 2nd aHSCT; →, continued survival.
Cohort overview and response to DLI
| All | Continuous GVL | Intermittent GVL | No response | |
|---|---|---|---|---|
| N | 23 | 10 | 7 | 6 |
| Age at DLI, y | 46 (22-72) | 49 (22-63) | 39 (24-72) | 45.5 (23-65) |
| Sex, male | 13 (57) | 7 (70) | 3 (43) | 3 (50) |
| Disease, AML | 17 (74) | 6 (60) | 7 (100) | 4 (67) |
| Disease risk, adverse/high risk | 8 (35) | 3 (30) | 2 (29) | 3 (50) |
| DLI trigger | ||||
| Cytologic/histologic relapse | 12 (52) | 5 (50) | 3 (43) | 4 (67) |
| Molecular relapse | 5 (22) | 3 (30) | 1 (14) | 1 (17) |
| Increased host chimerism | 6 (26) | 2 (20) | 3 (43) | 1 (17) |
| CTx pre-DLI | 11 (48) | 5 (50) | 3 (43) | 3 (50) |
| First DLI, mo post-aHSCT | 11 (4.1-75.7) | 16.7 (5.5-75.7) | 11.5 (4.1-29.4) | 9.2 (4.6-17.1) |
| Dose first DLI, CD3+/kg BW | 5 × 10E6 (5 × 10E5-2.5 × 10E7) | 5.5.×10E6 (5 × 10E5-1.2 × 10E7) | 1 × 10E7 (1 × 10E6-2.5 × 10E7) | 3.5 × 10E6 (1 × 10E6-1 × 10E7) |
| Total number of DLI | 2 (1-7) | 2 (1-4) | 3 (1-7) | 2 (1-4) |
| First GVL, mo post-DLI | 0.6 (0.4-4.4) | 0.7 (0.5-1.7) | — | |
| Relapse, mo post-DLI | — | 13.9 (3.7-15.0) | 0.9 (0.2-5.9) | |
| OS at 36 mo post-DLI, mo | 16.6 (1.7-36.0) | 36.0 (2.6-36.0) | 18.6 (8.5-36.0) | 5.0 (1.7-16.6) |
| Patients alive at 36 mo post DLI | 8 (35) | 6 (60) | 2 (29) | 0 (0) |
Given is the median (range) for continuous variables and the absolute number (%) for categorical variables.
AML, acute myeloid leukemia; BW, body weight; CTx, chemotherapy; OS, overall survival. —, not applicable.
Therapeutic effect of DLI is not reflected by absolute CD8+ T-cell counts or frequencies
First, we tested whether the number and frequency of CD8+ T cells in peripheral blood changed upon occurrence of GVL (supplemental Figure 3A). In samples in which GVL was detected for the first time (compared with the previous time point; n = 14) and those without GVL (n = 11; with time points chosen in accordance to timing of GVL samples), we did not observe significant changes in CD8+ frequencies and absolute counts (supplemental Figure 3B-C). Comparison of the clinical characteristics in these subgroups is shown in supplemental Table 5A.
GVL effect coincides with decreasing CD8+ T-cell diversity
To further analyze clonal changes of the CD8+TRB repertoire at occurrence of GVL after DLI, we sequenced the CDR3 region of the TRB chains from sorted αβCD8+ T cells.
We first examined whether the CD8+TRB diversity measured via inverse Simpson’s index (1/D) was altered in patients with or without GVL. A reduction in inverse Simpson’s index value indicates a drop in repertoire diversity. Upon occurrence of GVL, the TRB diversity decreased significantly compared with the previous time point (−25.29% 1/D; P = .0017), whereas 1/D was on average unchanged in noGVL samples (+0.51% 1/D; P = not significant; Figure 2A). Similarly, the intergroup comparison confirmed this drop in diversity at first occurrence of GVL compared with noGVL (P = .0051; Figure 2B). Given the inhomogeneous characteristics of our study cohort regarding indications for DLI, therapy before DLI, underlying malignancy, and different transplant characteristics, this finding was further tested by MVA and confirmed that GVL vs noGVL is the only driver of the observed CD8+ TCR diversity dynamics (Table 3). In sum, a reduction in complexity of the CD8+TRB repertoire presumably due to expansion of individual clones was associated with GVL. This effect was observed in neither the CD4+TRB repertoire (Figure 2C-D) nor the computed entire CD3+ repertoire (Figure 2E-F).
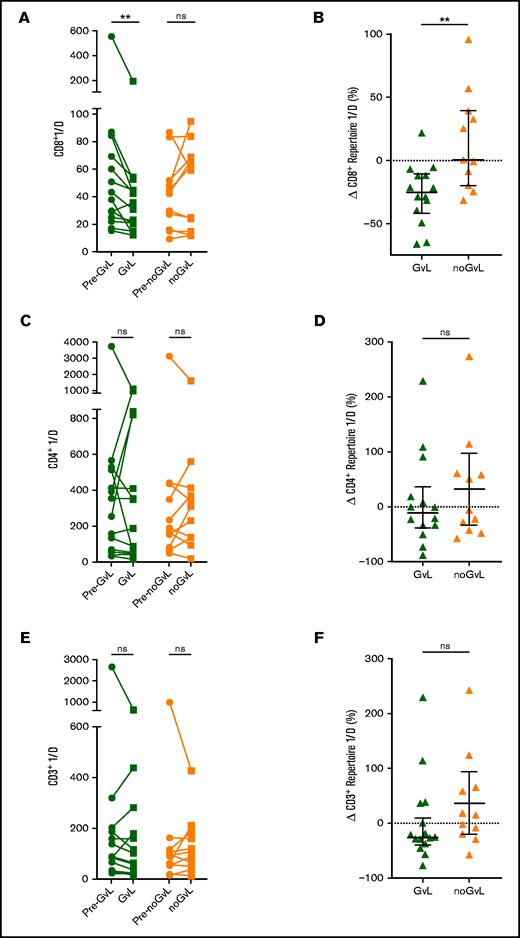
Focusing of the CD8+ but not CD4+ or entire CD3+TRB repertoire is linked to GVL effect. Comparison of CD8+ (A), CD4+ (C), and entire CD3+ (E) TRB diversity via inverse Simpson’s index (1/D) in patients with GVL effect (green; n = 14) and those without (orange; n = 11). The graph shows the time point before occurrence of first GVL/noGVL (closed circles) and the first occurrence of GVL/noGVL (closed squares) for each patient. The higher the inverse Simpson’s value, the higher the TCR repertoire diversity. Change of CD8+ (B), CD4+ (D), and entire CD3+ (F) TRB diversity at first GVL occurrence and patients without GVL in percent is displayed. CD3+ diversity data were calculated based on the cell frequencies of CD8+ and CD4+ cells (eg, CD3+ 1/D was calculated as sum of CD8+ 1/D × frequency of CD8+ of CD3+ and CD4+ 1/D × frequency of CD4+ of CD3+). Statistical analysis was performed by Wilcoxon matched-pairs signed ranked test (two-tailed) (A) and Mann-Whitney test (two-tailed) (B). Black lines represent median; error bars show the interquartile range. **P < .01; ns, not significant.
Focusing of the CD8+ but not CD4+ or entire CD3+TRB repertoire is linked to GVL effect. Comparison of CD8+ (A), CD4+ (C), and entire CD3+ (E) TRB diversity via inverse Simpson’s index (1/D) in patients with GVL effect (green; n = 14) and those without (orange; n = 11). The graph shows the time point before occurrence of first GVL/noGVL (closed circles) and the first occurrence of GVL/noGVL (closed squares) for each patient. The higher the inverse Simpson’s value, the higher the TCR repertoire diversity. Change of CD8+ (B), CD4+ (D), and entire CD3+ (F) TRB diversity at first GVL occurrence and patients without GVL in percent is displayed. CD3+ diversity data were calculated based on the cell frequencies of CD8+ and CD4+ cells (eg, CD3+ 1/D was calculated as sum of CD8+ 1/D × frequency of CD8+ of CD3+ and CD4+ 1/D × frequency of CD4+ of CD3+). Statistical analysis was performed by Wilcoxon matched-pairs signed ranked test (two-tailed) (A) and Mann-Whitney test (two-tailed) (B). Black lines represent median; error bars show the interquartile range. **P < .01; ns, not significant.
Overview of univariate and multivariate results of intergroup comparisons
| UVA P | MVA P | Supplemental material | |
|---|---|---|---|
| GVL vs noGVL | Table 5A | ||
| Figure 2B CD8+ 1/D | .0051 | .0309 | Table 5B |
| Figure 3B Δ no. of clones top 25% | .0172 | .0326 | Table 5C |
| Figure 3B Δ no. of clones top 50% | .0200 | .0380 | Table 5D |
| Figure 3B Δ no. of clones top 75% | .0179 | .0480 | Table 5E |
| Figure 3B Δ no. of clones whole repertoire | .0287 | .5600 | Table 5F |
| Figure 4B Δ CD8+TRB repertoire occupation by top 20 clones | .0051 | .0069 | Table 5G |
| Figure 4B Δ CD8+TRB repertoire occupation by top 21-50 clones | .1700 | .6273 | Table 5H |
| Figure 4B Δ CD8+TRB repertoire occupation by top 51-N clones | .0248 | .0186 | Table 5I |
| Figure 5B Δ CD8+TRB repertoire occupation by top 20 overlapping clones | .0442 | .0306 | Table 5J |
| Figure 5B Δ CD8+TRB repertoire occupation by top 21-N overlapping clones | .8400 | .6098 | Table 5K |
| Figure 5B Δ CD8+TRB repertoire occupation by all overlapping clones | .0018 | .0121 | Table 5L |
| Figure 5F Δ overlapping DLI CD8+ clones | .0128 | .0024 | Table 5M |
| Figure 5G Δ new DLI CD8+ clones | .7780 | .0415 | Table 5N |
| No relapse vs relapse | Table 6A-B | ||
| Figure 6B CD8+ 1/D | .0142 | .0066 | Table 6C |
| Figure 6D Δ no. of clones top 25% | .0107 | .0034 | Table 6D |
| Figure 6D Δ no. of clones top 50% | .0242 | .0133 | Table 6E |
| Figure 6D Δ no. of clones top 75% | .4363 | .1815 | Table 6F |
| Figure 6D Δ no. of clones whole repertoire | .8633 | .4480 | Table 6G |
| Figure 6F Δ CD8+TRB repertoire occupation by top 20 clones | .0244 | .0073 | Table 6H |
| Figure 6F Δ CD8+TRB repertoire occupation by top 21-50 clones | 1.0000 | .4050 | Table 6I |
| Figure 6F Δ CD8+TRB repertoire occupation by top 51-N clones | .2581 | .1220 | Table 6J |
| Figure 6H Δ CD8+TRB repertoire occupation by top 20 overlapping clones | .0503 | .0308 | Table 6K |
| Figure 6H Δ CD8+TRB repertoire occupation by top 21-N overlapping clones | .5613 | .7643 | Table 6L |
| Figure 6H Δ CD8+TRB repertoire occupation by all overlapping clones | .0770 | .0660 | Table 6M |
| CD8+ expansion vs no expansion | Table 7A-B, D | ||
| Figure 7A CIR | .0040 | .0080 | Table 7C |
| Figure 7B Relapse-free survival | .0150 | .0210 | Table 7E |
Given are the UVA and MVA results for the intergroup comparisons of Figures 2-7. UVA for Figures 2-6 were done with Mann-Whitney test (two-tailed, exact). UVA for Figure 7A was done with Gray’s test and for Figure 7B with univariate Cox regression analysis. MVA for Figures 2-6 employed analysis of variance testing, either with all variables (categorized to 2 levels, when applicable) for the GVL vs noGVL comparison or using only variables significantly correlating with dependent variables at P < .25 for the no relapse vs relapse comparison. MVA of Figure 7 used multivariate Cox regression models. Variables found to be significant with P < .25 in respective UVA were used in MVA. Backward elimination procedure was used to reduce the number of variables until remaining variables were fitting a model at P < .05. Details of MVA are shown in the supplemental material.
CD8+ T-cell clonal space is occupied by fewer unique clonotypes in patients with GVL
Changes in CD8+TRB diversity under conditions of constant frequencies and numbers of CD8+ T cells suggested an expansion of CD8+ T-cell clones in patients with GVL. However, changes in overall diversity do not allow measurement of expansion of specific clones. To investigate such a potential clonal expansion, we analyzed the distribution of CD8+ T-cell clones by calculating the number of unique TRB clones that occupy 25%, 50%, 75%, and 100% of the TCR repertoire within each individual patient. Compared with the previous time point, we observed a drop of unique TRB clones occupying 25%, 50%, and 75% of the CD8+TRB repertoire in first-time GVL samples (25%: median −1.5 clones = −30.95%; P = .0078; 50%: −2 clones = −20.2%; P = .0034; 75%: −25 clones = −19.55%; P = .0101), which was not the case in noGVL samples (Figure 3A). The intergroup comparison between GVL and noGVL was significant for all 4 clonal compartments (25% P = .0172; 50% P = .0200; 75% P = .0179; 100% P = .0287; Figure 3B). Except for the 100% clonal compartment comparison, these results were confirmed by MVA (Table 3). Taken together, in patients responding to DLI, fewer unique CD8+TRB clones occupy the 25%, 50%, and 75% compartments of the TRB repertoire, suggesting an expansion of dominant clonotypes when GVL takes place.
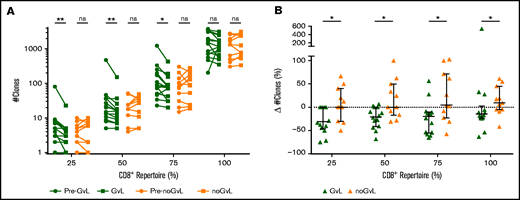
CD8+ T-cell clonal space is occupied by fewer clones at occurrence of GVL. (A) Number of unique clonotypes (y-axis) required to occupy 25%, 50%, 75%, and 100% of the CD8+ repertoire is compared between patients with GVL effect (green; n = 14) and those without GVL (orange; n = 11). Clonotypes are used by decreasing abundance, identifying the minimal number of unique clonotypes required to cover each quartile of the CD8+ repertoire. Two time points are compared for each patient, with closed circles displaying the pre-GVL/noGVL time point and closed squares displaying the first onset of GVL/noGVL. (B) Difference in number of clones (y-axis) between pre-GVL/noGVL and GVL/noGVL (y-axis) is displayed individually for each quartile of the CD8+ repertoire. Statistical analysis was performed by Wilcoxon matched-pairs signed ranked test (two-tailed) (A) and Mann-Whitney test (two-tailed) (B). Black lines represent median; error bars show the interquartile range. *P < .05; **P < .01; ns, not significant.
CD8+ T-cell clonal space is occupied by fewer clones at occurrence of GVL. (A) Number of unique clonotypes (y-axis) required to occupy 25%, 50%, 75%, and 100% of the CD8+ repertoire is compared between patients with GVL effect (green; n = 14) and those without GVL (orange; n = 11). Clonotypes are used by decreasing abundance, identifying the minimal number of unique clonotypes required to cover each quartile of the CD8+ repertoire. Two time points are compared for each patient, with closed circles displaying the pre-GVL/noGVL time point and closed squares displaying the first onset of GVL/noGVL. (B) Difference in number of clones (y-axis) between pre-GVL/noGVL and GVL/noGVL (y-axis) is displayed individually for each quartile of the CD8+ repertoire. Statistical analysis was performed by Wilcoxon matched-pairs signed ranked test (two-tailed) (A) and Mann-Whitney test (two-tailed) (B). Black lines represent median; error bars show the interquartile range. *P < .05; **P < .01; ns, not significant.
Top 20 CD8+ T-cell clones are expanding in patients with GVL
To further analyze details of the assumed expansion of specific CD8+ T-cell clones in responders, we focused on the top 20, top 21 to 50, and top 51 to N unique CD8+ clonotypes and analyzed the percentage of CD8+ repertoire covered. In samples in which GVL was detected for the first time, a higher proportion of the CD8+ repertoire was covered by the top 20 clones (median +2.85%; P = .0031; Figure 4A). Conversely, a decrease of covered repertoire by the top 51 to N clones (median −2.43%; P = .0283; Figure 4A) was seen. In contrast, no significant changes were observed in patients without GVL (Figure 4A). Intergroup comparison confirmed this increase for the first occurrence of the top 20 GVL clones (P = .0051) and decrease for the 51 to N clones when compared with noGVL (Figure 4B). To visualize this finding, we show the clonal proportions of the CD8+TRB repertoire over time for 3 consecutive time points with color coding of the top 20 single clonotypes, representative for 2 patients without GVL (Figure 4C) and 2 patients meeting GVL criteria (Figure 4D). We confirmed by MVA that GVL vs noGVL is the main driver of the observed intergroup changes (Table 3). In summary, we observed an expansion of the top 20 CD8+ clones in patients with GVL activity.
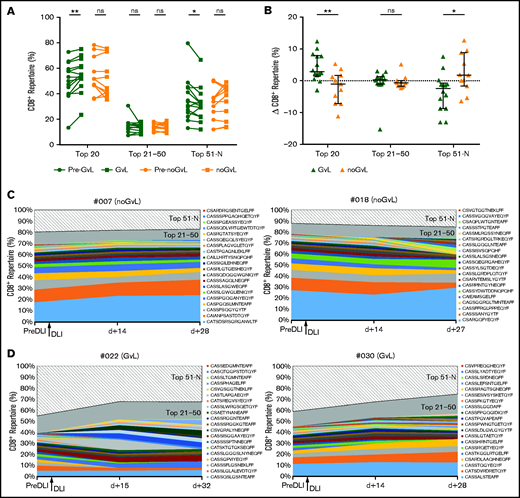
Top 20 CD8+ T-cell clones are expanding in patients with GVL. (A) CD8+TRB repertoire proportions are compared between patients with GVL effect (green; n = 14) and those without GVL (orange; n = 11). Two time points are compared, with closed circles displaying the pre-GVL/noGVL time point and closed squares displaying the time point of first onset of GVL/noGVL. (B) Difference in CD8+TRB repertoire (y-axis) occupied by top 20, 21 to 50, and 51 to N clones between pre-GVL/noGVL and first GVL/noGVL time. (C-D) Clonal proportions of the CD8+TRB repertoire (y-axis) are shown over time for 3 consecutive time points (x-axis). Every single CDR3 sequence of the top 20 clones is shown in a different color, as indicated by the legend. The top 21 to 50 (gray) and 51 to N clones (hatched area) are grouped together. The arrow indicates the time point of administration of DLI. Displayed are 2 representative patients without GVL (C) and 2 with GVL effect (D). Statistical analysis was performed by Wilcoxon matched-pairs signed ranked test (two-tailed) (A) and Mann-Whitney test (two-tailed) (B). Black lines represent median; error bars show the interquartile range. *P < .05; **P < .01; ns, not significant.
Top 20 CD8+ T-cell clones are expanding in patients with GVL. (A) CD8+TRB repertoire proportions are compared between patients with GVL effect (green; n = 14) and those without GVL (orange; n = 11). Two time points are compared, with closed circles displaying the pre-GVL/noGVL time point and closed squares displaying the time point of first onset of GVL/noGVL. (B) Difference in CD8+TRB repertoire (y-axis) occupied by top 20, 21 to 50, and 51 to N clones between pre-GVL/noGVL and first GVL/noGVL time. (C-D) Clonal proportions of the CD8+TRB repertoire (y-axis) are shown over time for 3 consecutive time points (x-axis). Every single CDR3 sequence of the top 20 clones is shown in a different color, as indicated by the legend. The top 21 to 50 (gray) and 51 to N clones (hatched area) are grouped together. The arrow indicates the time point of administration of DLI. Displayed are 2 representative patients without GVL (C) and 2 with GVL effect (D). Statistical analysis was performed by Wilcoxon matched-pairs signed ranked test (two-tailed) (A) and Mann-Whitney test (two-tailed) (B). Black lines represent median; error bars show the interquartile range. *P < .05; **P < .01; ns, not significant.
Preexisting and newly introduced overlapping clones are expanding in patients with GVL after DLI
We then asked whether the observed expansion of the top 20 CD8+ clones is due to preexisting or newly introduced clones. To do so, we focused exclusively on overlapping intrapatient clones to monitor their response to DLI over time. Overlapping clones were defined as identical CD8+ clones present at more than 1 time point in individual patients (intrapatient comparison). In samples with first occurrence of GVL (compared with the previous time point), the top 20 overlapping clones covered an increased proportion of the CD8+ repertoire (median +5.3%; P = .0001), whereas the top 20 overlapping clones in noGVL samples were unchanged (Figure 5A-B). We confirmed that GVL vs noGVL is a significant driver of the observed intergroup change by MVA (Table 3). To visualize this finding, we show the overlapping top 20 CD8+ clones of 3 time points together with the information regarding whether these clones were present in the DLI cell product itself, representative for 2 patients without GVL (Figure 5C) and 2 patients meeting GVL criteria (Figure 5D).
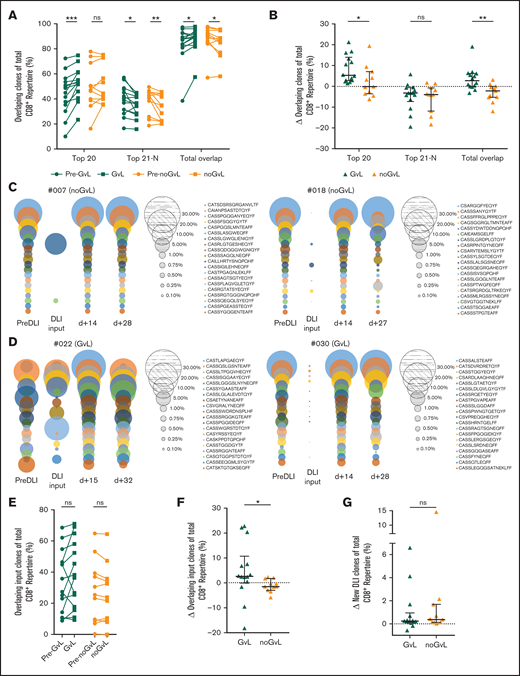
Overlapping clones are expanding in patients with GVL effect. Identical CD8+ clones present in more than 1 time point of individual patients (longitudinal intrapatient comparison) were defined as overlapping clones. (A) Top 20, 21 to N, and total overlapping CD8+ T-cell clones as percent of total CD8+TRB repertoire (y-axis) are shown for patients with GVL (green; n = 14) and without GVL (orange; n = 11). Two time points are compared, with closed circles displaying the pre-GVL/pre-noGVL time point and closed squares displaying the first onset of GVL/comparable time point in patients without GVL. (B) Change of overlapping CD8+TRB repertoire proportions is compared between patients with GVL (green) and those without GVL (orange). (C-D) Overlapping repertoire over time of the top 20 CD8+ T-cell clones of 2 representative patients without GVL (C) and with GVL (D) are displayed. Each circle represents 1 CD8+ T-cell clone, with the size matching the abundance of the total CD8+TRB repertoire at that time point. (E) Proportion of overlapping CD8+ T-cell DLI clones in patients with first occurrence of GVL effect (green) and those without (orange). Shown is the sample with first occurrence of GVL/noGVL (closed squares) in comparison with the time point pre-GVL/pre-noGVL (closed circles) for each patient. At occurrence of first GVL, overlapping DLI clones showed a trend to expand (P = .0651) but not in noGVL samples (P = .3086). (F) Change of overlapping DLI CD8+ T-cell clones between first pre-GVL/pre-noGVL and GVL/noGVL time point is shown for patients with GVL (green) and without GVL (orange); P = .0128. (G) Change of new DLI CD8+ T-cell clones (clones were not detected in pre-DLI sample) between all pre-GVL/pre-noGVL and all GVL/noGVL time points is shown for patients with GVL (green) and without GVL (orange); P = .7780. In the multivariate variate analysis of this comparison, GVL contributed significantly to the model (P = .0415; Table 3; supplemental Table 5N). Statistical analysis was performed by Wilcoxon matched-pairs signed ranked test (two-tailed) (A, E) and Mann-Whitney test (two-tailed) (B, F-G). Black lines represent median; error bars show the interquartile range. *P < .05; **P < .01; ***P < .001; ns, not significant.
Overlapping clones are expanding in patients with GVL effect. Identical CD8+ clones present in more than 1 time point of individual patients (longitudinal intrapatient comparison) were defined as overlapping clones. (A) Top 20, 21 to N, and total overlapping CD8+ T-cell clones as percent of total CD8+TRB repertoire (y-axis) are shown for patients with GVL (green; n = 14) and without GVL (orange; n = 11). Two time points are compared, with closed circles displaying the pre-GVL/pre-noGVL time point and closed squares displaying the first onset of GVL/comparable time point in patients without GVL. (B) Change of overlapping CD8+TRB repertoire proportions is compared between patients with GVL (green) and those without GVL (orange). (C-D) Overlapping repertoire over time of the top 20 CD8+ T-cell clones of 2 representative patients without GVL (C) and with GVL (D) are displayed. Each circle represents 1 CD8+ T-cell clone, with the size matching the abundance of the total CD8+TRB repertoire at that time point. (E) Proportion of overlapping CD8+ T-cell DLI clones in patients with first occurrence of GVL effect (green) and those without (orange). Shown is the sample with first occurrence of GVL/noGVL (closed squares) in comparison with the time point pre-GVL/pre-noGVL (closed circles) for each patient. At occurrence of first GVL, overlapping DLI clones showed a trend to expand (P = .0651) but not in noGVL samples (P = .3086). (F) Change of overlapping DLI CD8+ T-cell clones between first pre-GVL/pre-noGVL and GVL/noGVL time point is shown for patients with GVL (green) and without GVL (orange); P = .0128. (G) Change of new DLI CD8+ T-cell clones (clones were not detected in pre-DLI sample) between all pre-GVL/pre-noGVL and all GVL/noGVL time points is shown for patients with GVL (green) and without GVL (orange); P = .7780. In the multivariate variate analysis of this comparison, GVL contributed significantly to the model (P = .0415; Table 3; supplemental Table 5N). Statistical analysis was performed by Wilcoxon matched-pairs signed ranked test (two-tailed) (A, E) and Mann-Whitney test (two-tailed) (B, F-G). Black lines represent median; error bars show the interquartile range. *P < .05; **P < .01; ***P < .001; ns, not significant.
We observed that some but not all overlapping TRB clones were also present in the DLI cell product. To determine the role of CD8+ clones that had been transfused via DLI, we then exclusively focused on those overlapping DLI clones and their fate over time. We detected a trend toward an increased proportion of overlapping DLI TRB clones at occurrence of GVL (+4.56%; P = .0652) but not in noGVL samples (−1.07%; P = not significant; Figure 5E). In the intergroup analysis, this difference was significant (P = .0128; Figure 5F). We then confirmed that GVL vs noGVL is a significant driver of the observed intergroup change by MVA (Table 3).
Next, we excluded all overlapping DLI clones present before DLI treatment (preexisting clones) to solely examine the role of clones introduced by the DLI (new DLI clones). In the UVA, the proportion of these new clones originating from the DLI itself did not differ between patients with or without GVL (Figure 5G). However, GVL was contributing significantly to the model, as confirmed by MVA (Table 3).
In summary, we observed an expansion of overlapping TRB clones at occurrence of GVL, including preexisting clones and newly introduced TRB clones originating from the DLI sample.
Furthermore, we examined the pGen of specific clones that were present in each patient. To do so, we calculated the pGens of each CD8+ CDR3 sequence as described in the Methods section. We tested qualitatively whether pGen was different in GVL (n = 14) compared with noGVL samples (n = 11). Median log10pGen was similar between the groups (−9.12 vs −9.07; supplemental Figure 4A). The same was true when only the top 50 clones were analyzed (−8.67 vs −8.64; supplemental Figure 4B). Thus, log10pGen values did not differ between GVL and noGVL samples.
Continuous GVL effect is associated with early changes in CD8+TRB repertoire
Next, we analyzed the effect of continuous GVL effect on the CD8+TRB repertoire. In 9 of 14 patients, more than 1 sample meeting GVL criteria was available. We analyzed all samples with GVL regardless of the time of occurrence (n = 28) compared with all samples with noGVL (n = 20). Again, no difference in CD8+ T cells in peripheral blood was observed (supplemental Figure 3D-E). Analyzing TRB repertoire diversity in all samples with GVL compared with noGVL showed only a trend toward decreased repertoire diversity (supplemental Figure 5A-B). We then analyzed CD8+ diversity in individual patients over time. For most patients, occurrence of the first GVL effect coincided with the greatest decrease in CD8+ diversity, whereas subsequent GVL effects did not reach this magnitude. However, noGVL or relapse was associated with increasing CD8+ diversity (supplemental Figure 6A-C). Analyzing the clonal space coverage in all samples with GVL compared with noGVL revealed diverging results in the intergroup comparison (supplemental Figure 5C-D). The proportion of the CD8+ repertoire covered by the top 20, top 21 to 50, and top 51 to N clones (supplemental Figure 5E-F) as well as changes in overlapping clones (supplemental Figures 5G-H and 7A-C) showed a similar trend between all GVL and first GVL samples.
Taken together, these data imply that the decisive changes of the CD8+TRB repertoire take place already early after DLI because in patients with continuous GVL effect, we could not detect further focusing of the repertoire at later time points.
Absolute CD8+ T-cell numbers and CD8+ T-cell diversity of the DLI input sample do not predict response to DLI
We then analyzed the DLI cell product (DLI input) with regard to outcome (supplemental Figure 8). Frequencies and absolute count of CD8+ T cells did not differ in the DLI input comparing recipients meeting GVL criteria at least once (n = 16) to recipients without GVL (n = 5) during the study follow-up (supplemental Figure 8A-B). This was also the case for recipients without (n = 10) and with relapse (n = 11) during the study follow-up (supplemental Figure 8C-D). Also, we analyzed the CD8+TRB diversity of the DLI input with regard to outcome. For recipients with or without GVL (supplemental Figure 8E) and for nonrelapsing or relapsing recipients (supplemental Figure 8F), we detected no differences in 1/D. Taken together, the proportion of CD8+ T cells and the CD8+ T-cell diversity of the DLI cell product did not correlate with the patients’ response to the cell product.
CD8+ TRB repertoire changes prediction response to DLI
Finally, to test the hypothesis that immunologic changes take place before molecular and/or clinical detection of relapse, we regrouped the cohort into patients achieving remission (no relapse) or relapsing/progressing during the 36-month follow-up. Median time to relapse was 11.7 months (range 0.6-15.0 months) after DLI. Patients with relapse within the first month after DLI were excluded from this analysis, as were samples with concomitant use of steroids or chemotherapeutic agents or samples taken during active infections (supplemental Table 1; supplemental Figure 1). We compared the first sample after DLI (median d+14; range 10-35 days; no difference between the groups) of relapsing patients (n = 9) with patients with ongoing remission (n = 9). Comparison of the clinical characteristics in these subgroups is shown in supplemental Table 6A. We did not detect any significant differences in CD8+ frequencies and absolute numbers (supplemental Figure 3F-G) comparing both groups. We therefore assessed the predictive power of CD8+TRB repertoire changes after DLI regarding prediction of relapse/remission. CD8+TRB diversity decreased in patients in remission until last follow-up but not in patients with future relapse (Figure 6A-B). This effect was observed in neither the CD4+TRB repertoire (supplemental Figure 9A-B) nor the computed entire CD3+ repertoire (supplemental Figure 9C-D). Furthermore, in patients with ongoing remission, the number of unique clonotypes declined (Figure 6C-D) and the percentage of CD8+ repertoire covered by the top 20 clones increased (Figure 6E-F) although this was not the case in patients experiencing relapse. Also, only patients without relapse showed an increased proportion of CD8+ repertoire covered by the top 20 overlapping clones (Figure 6G-H). Although the univariate intergroup comparison for the top 20 overlapping clones (Figure 6H) showed a trend toward expansion of the overlapping CD8+ clones for patients without relapse (P = .0503), this difference was significant when tested by MVA (Table 3). We did not detect differences in the CD8+ repertoire being occupied by the overlapping DLI clones in patients with relapse compared with patients with ongoing remission (supplemental Figure 7D-E). Similarly, the proportion of new clones originating from the DLI itself did not differ between patients with or without relapse (supplemental Figure 7F). Except for Figure 6H (top 20), significance of all other univariate intergroup comparisons (Figure 6B,D,F,H) were confirmed by MVA (Table 3). Taken together, clonal expansion of CD8+TRB repertoire 15 days after DLI predicted durable remission during the 36-month study follow-up. Additionally, absence of focusing of the CD8+TRB repertoire early after DLI was associated with relapse 11.2 months (median range 0.2-14.4) before diagnosis of relapse.
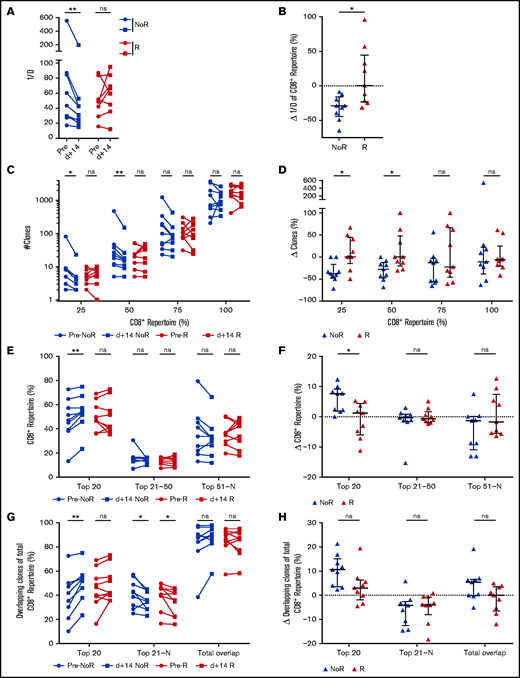
Changes in CD8+TRB repertoires are associated with durable remission post-DLI. (A) Comparison of CD8+TRB diversity in pre-DLI samples (filled circles) and d+14 post-DLI samples (filled squares) in patients without relapse (noR) post-DLI during the study follow-up (blue; n = 9) and patients with relapse (R) post-DLI (red; n = 9). (B) Change of CD8+TRB diversity in patients without (blue) and with relapse (red) in percent is displayed. (C) Number of unique clonotypes (y-axis) is displayed individually for each quartile of the CD8+ repertoire, comparing patients without relapse post-DLI (blue; n = 9) with patients developing relapse post-DLI (red; n = 9). Two time points are given for each group, with closed circles displaying the pre-DLI time point and closed squares d+14 post-DLI. (D) Difference in number of clones (y-axis) between pre-DLI and d+14 time point is displayed individually for each quartile of the CD8+ repertoire, comparing patients without relapse post-DLI (blue; n = 9) with patients developing relapse post-DLI (red; n = 9). (E) CD8+TRB repertoire proportions are displayed for the top 20, 21 to 50, and 51 to N CD8+ T-cell clones, comparing patients without relapse post-DLI (blue; n = 9) with patients developing relapse post-DLI (red; n = 9). Two time points are given for each group, with closed circles displaying the pre-DLI time point and closed squares d+14 post-DLI. (F) Difference in CD8+TRB repertoire (y-axis) occupied by top 20, 21 to 50, and 51 to N clones between pre-DLI and d+14 time point. (G) Top 20, 21 to N, and total overlapping CD8+ T-cell clones as percent of total CD8+TRB repertoire (y-axis) is shown for patients without development of relapse post-DLI (blue; n = 9) and patients developing relapse post-DLI (red; n = 9). Two time points are given for each group, with closed circles displaying the pre-DLI time point and closed squares d+14 post-DLI. (H) Change of overlapping CD8+TRB repertoire proportions is displayed for the top 20, 21 to N, and total overlapping CD8+ T-cell clones, comparing patients without relapse post-DLI (blue) with patients developing relapse post-DLI (red). Statistical analysis was performed by Wilcoxon matched-pairs signed ranked test (two-tailed) (A, C, E, G) and Mann-Whitney test (two-tailed) (B, D, F, H). Black lines represent median; error bars show the interquartile range. *P < .05; **P < .01; ns, not significant.
Changes in CD8+TRB repertoires are associated with durable remission post-DLI. (A) Comparison of CD8+TRB diversity in pre-DLI samples (filled circles) and d+14 post-DLI samples (filled squares) in patients without relapse (noR) post-DLI during the study follow-up (blue; n = 9) and patients with relapse (R) post-DLI (red; n = 9). (B) Change of CD8+TRB diversity in patients without (blue) and with relapse (red) in percent is displayed. (C) Number of unique clonotypes (y-axis) is displayed individually for each quartile of the CD8+ repertoire, comparing patients without relapse post-DLI (blue; n = 9) with patients developing relapse post-DLI (red; n = 9). Two time points are given for each group, with closed circles displaying the pre-DLI time point and closed squares d+14 post-DLI. (D) Difference in number of clones (y-axis) between pre-DLI and d+14 time point is displayed individually for each quartile of the CD8+ repertoire, comparing patients without relapse post-DLI (blue; n = 9) with patients developing relapse post-DLI (red; n = 9). (E) CD8+TRB repertoire proportions are displayed for the top 20, 21 to 50, and 51 to N CD8+ T-cell clones, comparing patients without relapse post-DLI (blue; n = 9) with patients developing relapse post-DLI (red; n = 9). Two time points are given for each group, with closed circles displaying the pre-DLI time point and closed squares d+14 post-DLI. (F) Difference in CD8+TRB repertoire (y-axis) occupied by top 20, 21 to 50, and 51 to N clones between pre-DLI and d+14 time point. (G) Top 20, 21 to N, and total overlapping CD8+ T-cell clones as percent of total CD8+TRB repertoire (y-axis) is shown for patients without development of relapse post-DLI (blue; n = 9) and patients developing relapse post-DLI (red; n = 9). Two time points are given for each group, with closed circles displaying the pre-DLI time point and closed squares d+14 post-DLI. (H) Change of overlapping CD8+TRB repertoire proportions is displayed for the top 20, 21 to N, and total overlapping CD8+ T-cell clones, comparing patients without relapse post-DLI (blue) with patients developing relapse post-DLI (red). Statistical analysis was performed by Wilcoxon matched-pairs signed ranked test (two-tailed) (A, C, E, G) and Mann-Whitney test (two-tailed) (B, D, F, H). Black lines represent median; error bars show the interquartile range. *P < .05; **P < .01; ns, not significant.
To verify whether TRB repertoire changes might be suited for prediction of clinical response, we categorized samples purely based on their CD8+ diversity dynamics early after DLI (on average +15 days, range 10-35). As before, patient samples with concomitant use of steroids or chemotherapeutic agents or samples taken during active infections were excluded from this analysis (supplemental Table 1; supplemental Figure 1). Thus, we grouped all samples with decreasing (≥5% change) inverse Simpson’s index (n = 13) and samples without decreasing CD8+TRB diversity (n = 6) and analyzed the relapse incidence within the 36-month study follow-up. Comparison of the clinical characteristics in these subgroups is shown in supplemental Table 7A. Competing risk analysis30 revealed that in patients with clonal expansion of CD8+TRB repertoire early after DLI, relapse incidence was significantly lower compared with patients without expansion (Figure 7A). Accordingly, there was a significant difference in relapse-free survival but not overall survival between the groups (Figure 7 B-C). These results were confirmed by MVA (Table 3). However, this effect was observed in neither the CD4+TRB repertoire (supplemental Figure 10A-C) nor the computed entire CD3+ repertoire (supplemental Figure 10D-F). Taken together, this supports our hypothesis that expansion of CD8+ T-cell clones was associated with induction of durable remission after DLI and underlines the predictive potential of TRB repertoire changes.
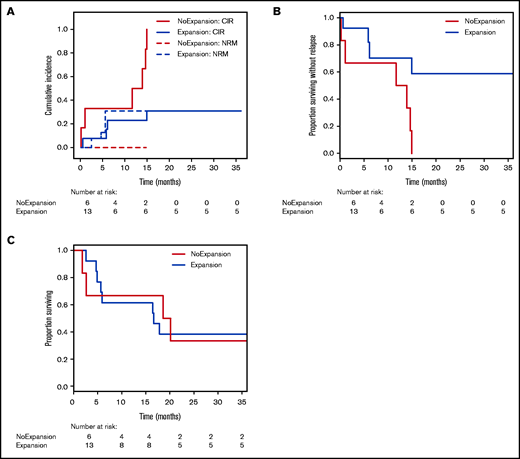
Relapse incidence is predicted by expansion of CD8+ T-cell clones 14 days post-DLI. (A) Cumulative incidence curves are shown with relapse incidence (CIR, solid lines) and nonrelapse mortality (NRM, dotted lines) as competing events for patients without clonal expansion (red; n = 6) and for patients with clonal expansion (blue; n = 13) of CD8+TRB repertoire at first sampling time point post-DLI (on average d+14). Expansion was assessed via inverse Simpson’s index (1/D) and compared with the pre-DLI time point. CIR and NRM were analyzed by means of cumulative incidence curves using Gray’s test (CIR, P = .0040; NRM, P = .1502). (B) Analysis of relapse-free survival (RFS) between patients without clonal expansion (red; n = 6) and for patients with clonal expansion (blue; n = 13) of CD8+TRB repertoire at first sampling time point post-DLI (on average d+14). Statistical analysis was done with univariate Cox regression model (P = .0150). (C) Analysis of overall survival (OS) between patients without clonal expansion (red; n = 6) and for patients with clonal expansion (blue; n = 13) of CD8+TRB repertoire at first sampling time point post-DLI (on average d+14). Statistical analysis was done with univariate Cox regression model (P = .9280).
Relapse incidence is predicted by expansion of CD8+ T-cell clones 14 days post-DLI. (A) Cumulative incidence curves are shown with relapse incidence (CIR, solid lines) and nonrelapse mortality (NRM, dotted lines) as competing events for patients without clonal expansion (red; n = 6) and for patients with clonal expansion (blue; n = 13) of CD8+TRB repertoire at first sampling time point post-DLI (on average d+14). Expansion was assessed via inverse Simpson’s index (1/D) and compared with the pre-DLI time point. CIR and NRM were analyzed by means of cumulative incidence curves using Gray’s test (CIR, P = .0040; NRM, P = .1502). (B) Analysis of relapse-free survival (RFS) between patients without clonal expansion (red; n = 6) and for patients with clonal expansion (blue; n = 13) of CD8+TRB repertoire at first sampling time point post-DLI (on average d+14). Statistical analysis was done with univariate Cox regression model (P = .0150). (C) Analysis of overall survival (OS) between patients without clonal expansion (red; n = 6) and for patients with clonal expansion (blue; n = 13) of CD8+TRB repertoire at first sampling time point post-DLI (on average d+14). Statistical analysis was done with univariate Cox regression model (P = .9280).
Discussion
To date, monitoring treatment response to DLI depends on clinical assessment, chimerism measurements, or, at best, molecular markers. Such information allows us to roughly estimate the onset of GVL activity. Failing to observe a response to DLI in time may lead to a dose incremented application of further DLIs, with increased risk for severe GVHD.
Based on the assumption that allo- and leukemia-reactive CD8+ T-cell clones will proliferate upon activation, herein we elucidate the underlying immunologic dynamics of GVL (ie, expanding CD8+TRB clones). We show that these changes might become a useful biomarker with regard to remission and relapse. Using a prospective study approach, we examined outcome-dependent changes in the CD8+TRB repertoire in patients who received DLI for treatment of relapse after aHSCT. Although the number of CD8+ T cells remained unchanged, expansion of CD8+TRB clones was characteristic for samples with GVL. Furthermore, TRB dynamics of CD8+ T cells early after DLI predicted patient clinical outcome in this cohort. The data on continuous GVL additionally support the hypothesis that early changes in CD8+TRB repertoire correlate with long-term clinical effects (supplemental Figure 6). Inclusion of the DLI cell product into the sequencing analysis enabled us to examine the dynamics of preexisting and new DLI clones. Interestingly, expansion of not only new DLI clones but also preexisting CD8+TRB clones was associated with GVL activity. This demonstrates the complexity of underlying immune cell interactions. Importantly, the sequencing results could not be reproduced within the TRB CD4+ or CD3+ repertoire, as our TCR sequencing data clearly show diverging results for different T-cell subsets (Figure 2; supplemental Figures 9 and 10). Therefore, applying a bulk sequencing approach of unsorted T cells and thus ignoring the distinct immunologic functions of major T-cell subsets results in skewed sequencing results.
While spectratyping kinetics after DLI showed conflicting results regarding expansion and diversification associated with favorable outcome to DLI,8-10TRB CDR3 region analysis via deep sequencing, as used in our study, revealed that clonal expansion of CD8+TRB repertoire was indeed consistently linked to GVL and remission. This is in agreement with a report in patients responding to DLI in combination with sorafenib18 and follows observed immunological changes in the TRB repertoire in response to acute viral infection31 or nontolerant patients who received kidney transplant.32 One study with a heterogeneous group of aHSCT patients was also using sorted CD8+ T cells for the analyses of GVL and DLI; similar to our data, researchers detected expansion of dominant clonotypes.19 However, in contrast to that study, we detected a global decrease of CD8+TRB diversity in GVL samples. Differences in exclusion criteria (eg, analyzing samples with concurrent medication with steroids for GVHD treatment) might have led to these divergent results.
Given the current technological advances, TRB repertoire analyses become increasingly feasible, fast, and cost efficient. Future advances will thus support monitoring of this clinical parameter by employing multiplex rather than unbiased template switch/RACE approaches and in the long run perhaps with a dedicated bias on covering typical abundant clonotypes.
Limitations of our results are the cohort size and the heterogeneity of underlying hematologic diseases. Nevertheless, we could identify significant changes in CD8+TRB repertoire as a function of divergent response to DLI, suggesting a strong biological phenotype. Also, with regard to the published studies, our patient cohort is the largest prospective analysis to date.
Moreover, exclusively focusing on the TRB chain genes of the TCR made it technically impossible to identify the full functional sequence of the TCR and associated allo-antigens. Future studies should therefore aim at investigating both chains of the TCR to gain full information on individual T-cell clones. Also, including a mixed lymphocyte reaction (DLI T cells against recipient cells) in combination with a sequencing approach to assess the alloreactive T-cell repertoire32,33 would offer the potential to further identify GVL-inducing clones. Moreover, future studies investigating the TCR repertoire dynamics in patients with acute myeloid leukemia who experience relapse after DLI would potentially offer further insights regarding immune escape mechanisms.
Our results warrant further testing for validity and reproducibility in a multicentric cohort to prove suitability and feasibility as biomarker to inform monitoring and prediction of DLI response.
In conclusion, at the current stage, our data do not allow us to base clinical decisions after DLI solely on CD8+ repertoire dynamics. However, CD8+TRB repertoire analysis holds the potential to increase safety of DLI treatment by continuously monitoring the underlying immune dynamics and predicting treatment response. In patients identified as at risk for failure of remission induction after DLI, early analysis of underlying immune escape mechanisms might offer individualized salvage therapy options.34
Acknowledgments
The authors thank Razif Gabdoulline for his support with the statistical analyses and G. Bernhardt and M. Beck for reading and discussing the manuscript. Furthermore, the authors thank Elke Dammann for her support in providing clinical data and Melanie Drenker for isolating peripheral blood mononuclear cells.
This work was supported by grants from Deutsche Forschungsgemeinschaft (SFB900/B8, Project ID 158989968) (C.K. and I.P.) and the German Federal Ministry of Education and Research (01EO1302) (C.R.S.-F., C.K., and I.P.).
Authorship
Contribution: C.R.S.-F., I.P., and C.K. designed the study; C.R.S.-F., and L.K. performed experiments; L.V. and L.H. performed chimerism analyses; C.R.S.-F., L.K., S. Raha, J.B.-M., L.T., and S. Ravens analyzed experimental data; C.R.S.-F., L.K., I.P., and C.K. interpreted the data; C.R.S.-F., L.K., I.P., and C.K. wrote the manuscript; S. Raha, J.B.-M., I.O., L.T., Y.X., S. Ravens, L.H., M.E., L.V., M.S., F.T., M.H., R.F., and A.G. reviewed and edited the manuscript.
Conflict-of-interest disclosure: The authors declare no competing financial interests.
Correspondence: Christian R. Schultze-Florey; e-mail: schultze-florey.christian@mh-hannover.de; and Christian Koenecke, Carl-Neuberg-Straße 1, 30625 Hannover, Germany; e-mail: koenecke.christian@mh-hannover.de.

