

TO THE EDITOR:
Internal tandem duplications (ITDs) of FMS-like tyrosine kinase 3 (FLT3-ITD) are the most common genetic aberrations in adult acute myeloid leukemia (AML).1 The presence of FLT3-ITD dictates the use of FLT3 tyrosine kinase inhibitors (TKIs) as supplemental therapy or as an alternative to standard treatment.2,3 Furthermore, the FLT3-ITD allelic ratio (AR)—the mutant:wild-type (WT) FLT3 ratio as determined by analysis of capillary fragment length—is associated with survival and is included in the 2017 European LeukemiaNet (ELN) risk stratification.4 The length of FLT3-ITD remains external to current risk stratification protocols, although it likely is of prognostic value.5-8 Accordingly, it is essential to accurately determine the presence of the FLT3-ITD, the AR, and potentially the length of the ITD. In pediatric AML, discrepancies between the measurements of genomic DNA and RNA and complementary DNA (cDNA) have an impact on outcome prediction.9,10 For adult AML, there has not been a thorough comparison between DNA and RNA/cDNA FLT3-ITD measurements in relation to prognostication. Therefore, we herein compare measurements of FLT3-ITD AR and length by using genomic DNA or RNA/cDNA and their prognostic value in 259 adult patients with FLT3-ITD AML.
Diagnostic bone marrow samples were obtained from patients with FLT3-ITD AML enrolled within the Dutch-Belgian Cooperative Trial Group for Hematology-Oncology (HOVON)/Swiss Group for Clinical Cancer Research (SAKK) HOVON 102 AML/SAKK 30/09 trial (hereafter HOVON 102)11 (n = 133) and the HOVON 132 AML/SAKK 30/13 trial (hereafter HOVON 132)12 (n = 126). The HOVON 102 trial evaluated the therapeutic value of clofarabine, and the HOVON 132 trial evaluated the value of lenalidomide added to intensive chemotherapy. For comparison, clinical data from these trials for 1293 patients with FLT3-WT AML were included in the analyses. FLT3-ITD status on DNA2 and RNA/cDNA12 (hereafter referred to as cDNA) was determined as described in the supplemental Data. Supplemental Tables 1 and 2 provide clinical and cytogenetic characteristics of the patients with AML. The FLT3-ITD AR is defined as the area under the curve (AUC) of all FLT3-ITD peaks divided by the AUC of the FLT3-WT peak2 ; the cutoff for high and low FLT3-ITD ARs is 0.50.4 The peak with the largest AUC was used for FLT3-ITD length. To compare measurements between 2 different laboratories, DNA and cDNA FLT3-ITD measurements for 12 patient samples were performed in both the Erasmus Medical Center (Erasmus MC) and Amsterdam University Medical Center (Amsterdam UMC). FLT3-ITD AR and length were compared using Spearman’s rank correlation, and survival analyses were compared using Kaplan-Meier estimates. For multivariable analysis, we used a Cox regression model with forward selection procedure. All study protocols were performed in accordance with the Declaration of Helsinki and approved by the institutional review boards of Erasmus MC Cancer Institute and Amsterdam UMC.
FLT3-ITD AR and FLT3-ITD length measurements (n = 12) between 2 laboratories were comparable (FLT3-ITD AR: RSpearman = 0.74 for DNA and RSpearman = 0.92 for cDNA; FLT3-ITD length, RSpearman = 1; supplemental Figure 1A-F; supplemental Table 3). Subsequently, FLT3-ITD was detected in 248 of 259 patients on both the DNA (median FLT3-ITD AR, 0.58; range, 0.01-17.7) and cDNA levels (median FLT3-ITD AR, 0.65; range, 0.01-14 283). FLT3-ITD was detected at the cDNA level in only 11 patients (4.2%) (supplemental Table 4). These samples frequently carried a minor FLT3-ITD clone (6 of 11 FLT3-ITD AR, <0.05; supplemental Table 4). The remaining samples included distinct FLT3-ITDs with total FLT3-ITD ARs ≥0.05, with no patients exceeding the 0.50 threshold for classification as adverse risk. None of the samples were solely detectable at the DNA level. FLT3-ITD AR strongly correlated between DNA and cDNA measurements (RSpearman = 0.86; 95% confidence interval [CI], 0.80-0.90; P < .001). DNA and cDNA discrepancies mainly included higher cDNA FLT3-ITD ARs (Figure 1A).
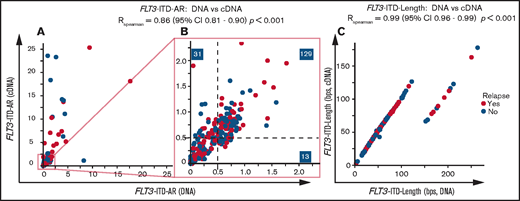
DNA vs cDNA FLT3-ITD measurements in relation to clinical outcome. Comparison of (A-B) DNA and cDNA FLT3-ITD AR and (C) FLT3-ITD length measurements within the HOVON 102 and HOVON 132 AML cohorts. Shown are samples with detected FLT3-ITD on both the DNA and cDNA levels and samples that have positive FLT3-ITD lengths (thus excluding the single case with a 3-bp deletion). For length comparison, only samples for which we could confidently identify the FLT3-ITD peak are shown. Panel A shows patients with a maximum FLT3-ITD AR of 25. Panel B shows patients with a maximum FLT3-ITD AR of 2.25. Correlation coefficients are calculated by using all data from patients with FLT3-ITD on both the DNA and cDNA levels using Spearman rank correlation.
DNA vs cDNA FLT3-ITD measurements in relation to clinical outcome. Comparison of (A-B) DNA and cDNA FLT3-ITD AR and (C) FLT3-ITD length measurements within the HOVON 102 and HOVON 132 AML cohorts. Shown are samples with detected FLT3-ITD on both the DNA and cDNA levels and samples that have positive FLT3-ITD lengths (thus excluding the single case with a 3-bp deletion). For length comparison, only samples for which we could confidently identify the FLT3-ITD peak are shown. Panel A shows patients with a maximum FLT3-ITD AR of 25. Panel B shows patients with a maximum FLT3-ITD AR of 2.25. Correlation coefficients are calculated by using all data from patients with FLT3-ITD on both the DNA and cDNA levels using Spearman rank correlation.
The discrepancies in detection and AR between cDNA and DNA measurements may be explained by higher messenger RNA (mRNA) expression of the FLT3-ITD allele, which could enhance detection at the cDNA level in 11 (4.2%) of 259 patients and classified 18 patients more often as FLT3-ITD AR ≥0.50 (12.8%; Figure 1B). Regarding the AR threshold of 0.05 for midostaurin eligibility as reported in the RATIFY trial,2 using cDNA for FLT3-ITD AR measurements increases the number of patients eligible for FLT3 TKIs to 14 (6.1%) compared with DNA measurements (supplemental Table 4).
FLT3-ITD lengths on DNA and cDNA were identical (RSpearman = 0.99; 95% CI, 0.96-0.99; P < .001; Figure 1C). We observed several FLT3-ITD lengths with an excess of 90 base pairs (bp) at the DNA level because of intron splicing.9 One sample displayed an FLT3-ITD transcript of 327 bp (3 bp shorter than WT13 ) explained by a previously unreported combination of an insertion of 4 bp and a 1 bp deletion (c.1770_1773delinsA; supplemental Figure 2). FLT3-ITD length and AR were not correlated (supplemental Figure 3).
Next, we determined potential differences in the prognostic significance of DNA and cDNA measurements. In the HOVON 102 AML cohort, both high DNA- and cDNA-based FLT3-ITD ARs were predictive for poor overall survival (OS) compared with FLT3-WT. In multivariable analyses using FLT3-ITD ARs, risk factors also included in the 2017 ELN classification and age (Figure 2A-B; supplemental Figure 4). In the HOVON 132 AML cohort, high FLT3-ITD AR as a single variable was not significantly associated with poor OS compared with patients who had FLT3-WT (Figure 2C-D).12 However, corrected for prognostically relevant cytogenetic factors, high FLT3-ITD AR, as determined on both the DNA and cDNA levels, was also predictive for poor OS compared with FLT3-WT (supplemental Figure 5). OS in the HOVON 132 AML cohort was in general better than that in the HOVON 102 AML cohort, which could be explained by the prognostic marker guided use of allogeneic transplantations in patients with high FLT3-ITD AR and in patients with measurable residual disease in first complete remission, whereas risk stratification in the HOVON 102 AML cohort was not based on FLT3-ITD AR.12
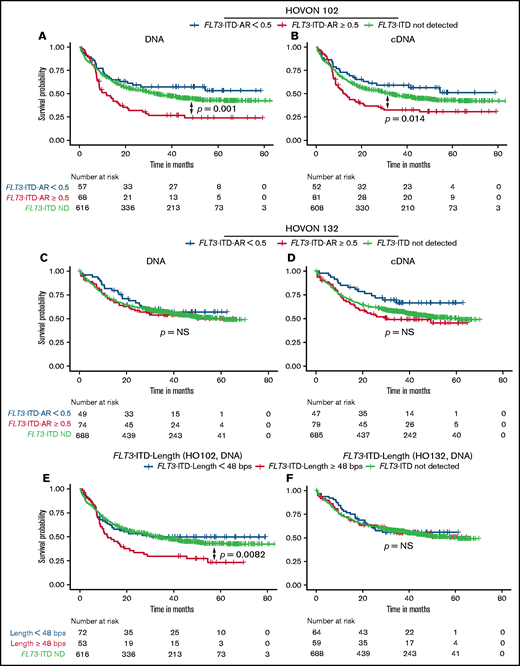
OS according to DNA or cDNA FLT3-ITD AR and length. OS analysis, stratified on FLT3-ITD ARs, based on patients treated within the HOVON 102 AML cohort: (A) DNA and (B) cDNA measurements. OS from the HOVON 132 AML cohort based on (C) DNA and (D) cDNA. OS according to DNA-based FLT3-ITD length with a cutoff of 48 bp in the (E) HOVON 102 AML cohort and (F) HOVON 132 AML cohort. ND, not detected.
OS according to DNA or cDNA FLT3-ITD AR and length. OS analysis, stratified on FLT3-ITD ARs, based on patients treated within the HOVON 102 AML cohort: (A) DNA and (B) cDNA measurements. OS from the HOVON 132 AML cohort based on (C) DNA and (D) cDNA. OS according to DNA-based FLT3-ITD length with a cutoff of 48 bp in the (E) HOVON 102 AML cohort and (F) HOVON 132 AML cohort. ND, not detected.
We next investigated the prognostic value of FLT3-ITD length as determined on DNA and cDNA. In our data, FLT3-ITD length ≥48 bp9 was a predictor for poor OS in the HOVON 102 AML cohort, in both univariable and multivariable analyses, but not in the HOVON 132 AML cohort (HOVON 102 AML cohort DNA: hazard ratio [HR], 2.10; 95% CI, 1.41-3.13; P < .001; Figure 2E-F; supplemental Figure 6). FLT3-ITD status stratified according to both FLT3-ITD AR and FLT3-ITD length remained an independent prognostic factor in multivariable analyses at both the DNA and cDNA levels (HOVON 102 AML cohort; supplemental Figure 7). In the HOVON 132 AML cohort, only a combined FLT3-ITD AR ≥0.5 and FLT3-ITD length ≥48 bp as measured on cDNA was predictive for worse OS (supplemental Figure 8) compared with patients without FLT3-ITD. Patients with FLT3-ITD ARs <0.50 had OS probabilities analogous to those of patients without FLT3-ITD, independent of FLT3-ITD length. Consistent over both AML cohorts, patients with a high FLT3-ITD AR and an FLT3-ITD length ≥48 bp displayed a higher HR for death compared with patients with a high FLT3-ITD AR and FLT3-ITD length <48 bp (HOVON 102 AML cohort DNA: HR, 3.32 [95% CI, 2.13-5.16] vs HR, 1.72 [95% CI, 0.99-3.00]; supplemental Figure 7A; HOVON 132 AML cohort cDNA: HR, 2.04 [95% CI, 1.28-3.26] vs HR, 1.53 [95% CI, 0.95-2.47]; supplemental Figure 8B), although these differences lack statistical significance (HOVON 102 AML cohort: P = .056; HOVON 132 AML cohort: P = .16). Collectively, these observations illustrate the potential additional prognostic value of FLT3-ITD length.
In conclusion, our study shows that in general FLT3-ITD DNA and cDNA measurements are concordant, with minor differences regarding detection and AR. However, we observed several differences between DNA and cDNA measurements of FLT3-ITD. First, cDNA measurements are more sensitive in selected patients with AML, exemplified by the identification of patients with FLT3-ITD who were missed on the DNA level. Second, cDNA FLT3-ITD AR measurements are regularly higher than DNA measurements. This primarily impacts treatment selection. The number of patients with AML who are discordant with respect to the clinically relevant 0.50 AR threshold was too low to perform any meaningful analyses. Third, cDNA and DNA measurements of FLT3-ITD AR have similar prognostic value, although their magnitude seems to be study dependent. These data support the current standard of genomic DNA–based FLT3-ITD AR measurement in adult patients with AML.2 Finally, FLT3-ITD length is not currently incorporated into stratification protocols, although we again demonstrated its additional prognostic value, which warrants prospective validation.
Although FLT3-ITD is a well-characterized molecular aberration, the above data indicate that its clinical significance may be affected by the genetic material used for FLT3-ITD detection, the clinical regimen, and prognostic marker guided treatment selection. With the emergence and introduction of FLT3-TKIs into standard of care,14,15 its prognostic value and role in selection of patients who benefit from targeted treatment remains to be prospectively evaluated.
Acknowledgments: The authors thank Birgit Lissenberg-Witte for statistical support and Willemijn van den Ancker for proofreading the manuscript.
Contribution: D.G.J.C. and P.J.M.V. conceived and designed the research; C.M.V., M.R., P.A.M., F.G.K., Z.J.K., B.V.-P., and E.V. performed experiments; P.G. and B.L. provided clinical data; D.G.J.C., P.G., and C.M.V. curated the data; D.G.J.C., C.M.V., B.V.-P., E.V., P.A.M., and Z.J.K. analyzed data; D.G.J.C., C.M.V., J.J.W.M.J., J.C., and P.J.M.V. interpreted results of experiments; D.G.J.C. prepared the figures and drafted the manuscript; and all authors approved the final version of the manuscript.
Conflict-of-interest disclosure: The authors declare no competing financial interests.
Correspondence: Peter J. M. Valk, Erasmus Medical Center Cancer Institute, Dr. Molewaterplein 40, 3015GD Rotterdam, The Netherlands; e-mail: p.valk@erasmusmc.nl.

