

Key Points
NK cell cytokine training is dependent on glycolysis, oxidative phosphorylation, and the metabolic regulator Srebp.
NK cell cytokine training is defective in PWO.

Abstract
Natural killer (NK) cells are a population of innate immune cells that can rapidly kill cancer cells and produce cytokines such as interferon-γ. A key feature of NK cells is their ability to respond without prior sensitization; however, it is now well established that NK cells can possess memory-like features. After activation with cytokines, NK cells demonstrate enhanced effector functions upon restimulation days or weeks later. This demonstrates that NK cells may be trained to be more effective killers and harnessed as more potent cancer immunotherapy agents. We have previously demonstrated that cellular metabolism is essential for NK cell responses, with NK cells upregulating both glycolysis and oxidative phosphorylation upon cytokine stimulation. Limiting NK cell metabolism results in reduced cytotoxicity and cytokine production. We have also demonstrated that defective NK cell responses in obesity are linked to defective cellular metabolism. In the current study, we investigated if cellular metabolism is required during the initial period of NK cell cytokine training and if NK cells from people with obesity (PWO) can be effectively trained. We show that increased flux through glycolysis and oxidative phosphorylation during the initial cytokine activation period is essential for NK cell training, as is the metabolic signaling factor Srebp. We show that NK cells from PWO, which are metabolically defective, display impaired NK cell training, which may have implications for immunotherapy in this particularly vulnerable group.
Introduction
Obesity is a global epidemic, with >600 million adults registering a body mass index (BMI) in the obese category (BMI >30 kg/m2).1 It is well established that obesity increases the risk of developing numerous chronic diseases, such as type 2 diabetes mellitus, cardiovascular disease, and many cancers.2-4 The mechanisms underpinning the increased prevalence of cancer in people with obesity (PWO) are multifactorial and include altered insulin signaling, hormonal imbalances, and significant dysregulation of the immune system.5,6 Our previous work has demonstrated obesity-related defects in several key populations of the immune system,7-9 including natural killer (NK) cells, the frontline anticancer cell population.10-12
NK cells have traditionally been considered part of the innate immune system because of their important role in rapidly responding to viral infection and in surveying for cancerous cells.13 However, more recently, it has become clear that NK cells can have longer-lasting roles during the course of an immune response and operate in parallel with the adaptive immune response.14,15 Memory-like NK cells have been identified in various contexts, where long-lived NK cells acquire enhanced functionality as a result of their previous immune activation in both mouse and human systems.16,17 For instance, NK cells acquire memory-like properties (termed NK cell training) in response to stimulation with cytokines, such as interleukin-12 (IL-12) and IL-18. Additionally, NK cells display enhanced interferon-γ (IFN-γ) production upon restimulation days or weeks later and increased cytotoxicity toward target tumor cells.17,18 For this reason, these cytokine-trained NK cells are being developed for cancer immunotherapy and are currently in phase 2 clinical trials for the treatment of acute myeloid leukemia.18
Cellular metabolism is important for the antitumor functions of NK cells.19 When activated by cytokines, NK cells engage a robust metabolic response involving the upregulation of both glycolysis and oxidative phosphorylation (OXPHOS).20-22 Directly limiting the flux through these metabolic pathways or disrupting the signaling pathways used for this metabolic response results in the inhibition of IFN-γ production and NK cell cytotoxicity in these cytokine-activated NK cells.20,23,24 Additionally, dysfunctional NK cell responses in disease states have been linked to failures in cellular metabolism. PWO have profoundly dysfunctional NK cells; they have reduced NK cell numbers and a decreased capacity to produce IFN-γ and kill target cells.12 Given that cytokine training of NK cells involves an initial cytokine stimulation for 12 to 18 hours that induces substantial increases in cellular metabolism, we considered whether this metabolic response is important for NK cell training and, if so, whether NK cell training is impaired in metabolically defective NK cells, such as those from PWO.
The current study shows that increased flux through glycolysis and OXPHOS during the initial cytokine activation period of 18 hours is essential for NK cell training in both mouse and human systems. Additionally, inhibition of Srebp (sterol response element binding protein), a signaling pathway that we have previously demonstrated21 promotes increased cellular metabolism in response to cytokines, also abolishes NK cell training. These findings highlight the importance of cellular metabolism for the initiation of NK cell training. As highlighted, our previous work has shown that NK cells from adults with obesity are metabolically paralyzed12 ; in the current study, we show that these metabolic defects may result in impaired NK cell training, which may have implications for immunotherapy in this particularly vulnerable group.
Methods
Study cohorts and ethical approval
A cohort of 24 adults (obese, n = 11; nonobese, n = 13) were recruited (Table 1). Inclusion criteria included ability to give informed consent, age 18 to 65 years, and BMI <28 kg/m2 for the nonobese control group and BMI >30 kg/m2 for the obese group. Exclusion criteria for both groups included current or recent (<2 weeks) infection, current smoker, and use of anti-inflammatory medications, including GLP-1 analog therapies. Ethical approval was obtained from both St Vincent’s University Medical Ethics Committee and Maynooth University Ethics Committee.
Cohort characteristics
| Controls n = 13 | POW n = 11 | P | |
|---|---|---|---|
| Median (range) age, y | 37 (32-51) | 41 (31-65) | .11 |
| Female sex, % | 60 | 70 | — |
| Median (range) BMI, kg/m2 | 25 (22-27) | 47 (37-62) | <.0001 |
| Median (range) HbA1c, mmol/mol | Not measured | 36 (26-67) | — |
| Metformin use, % | 0 | 20 | — |
HbA1c, hemoglobin A1c.
Mice
C57BL/6J mice were purchased from Harlan (Bicester, United Kingdom) or Taconic Laboratories (Germantown, NY) and maintained in compliance with Irish Department of Health and Children regulations and with the approval of the University of Dublin’s ethical review board.
Isolation of NK cells and flow cytometric analysis
NK cells were isolated from human peripheral blood mononuclear cells (PBMCs) using negative magnetic bead separation (Miltenyi Biotec). For flow cytometric staining, PBMCs or isolated NK cells were stained for 30 minutes at 4°C with specific surface monoclonal antibodies (mice: NK1.1 [clone PK136], NKp46 [clone 29A1.4], and CD3 [clone 145-2C11]; humans: CD56 [clone REA196] and CD3 [clone REA613]). Cell populations were acquired using either a FACSCanto (Becton Dickinson) or Attune NxT (Life Technologies) flow cytometer and analyzed using FlowJo software (TreeStar). Results are expressed as a percentage of the parent population as indicated and were determined using flow −1 and unstained controls.
NK cell cytokine training
NK cells from mouse splenocytes or human PBMCs were stimulated either with IL-15 (mice, 10 ng/mL; humans, 1 ng/mL), IL-12 (mice, 20 ng/mL; humans, 10 ng/mL), and IL-18 (both mice and humans, 50 ng/mL) or with IL-15 alone for 18 hours. Cells were washed to remove cytokines and cultured for 6 days in the presence of low-dose IL-15 (mice, 10 ng/mL; humans, 1 ng/mL). For metabolic inhibition experiments, specific inhibitors, including 2-deoxyglucose (2DG; Sigma-Aldrich; 2 mM), oligomycin (Sigma-Aldrich; 2 nM), 25-hydroxycholesterol (25HC; Sigma-Aldrich; 1 μg/mL), or PF429242 (AdooQ Bioscience; 10 μM), were added during the initial 18-hour training stimulation, before being washed and replaced with fresh media and low-dose IL-15 for an additional 6 days.
NK cell cytokine production analysis
Control or cytokine-trained NK cells were harvested on day 7 and then stimulated with IL-15 (100 ng/mL) and IL-12 (20 ng/mL) for 4 hours at 37°C in the presence of a protein transport inhibitor. Intracellular cytokine staining was performed using a true nuclear kit and monoclonal antibody specific for IFN-γ (mice, clone XMG1.2; humans, clone REA600; Miltenyi Biotec).
NK cell gene expression
Isolated NK cells from healthy controls (n = 5) and PWO (n = 5) were stimulated with IL-15 (1 ng/mL), IL-12 (10 ng/mL), and IL-18 (50 ng/mL) for 18 hours at 37°C. Isolation of messenger RNA was performed using the EZNA Total RNA Kit I (Omega Bio-tek) according to the manufacturer’s protocol. Synthesis of complementary DNA was performed using the qScript cDNA Synthesis Kit (Quantabio). Real-time quantitative reverse transcription polymerase chain reaction was performed using PerfeCTa SYBR Green FastMix Reaction Mix (Green FastMix ROX; Quantabio) and KiCqStart primer sets (Sigma-Aldrich).
NK cell cytotoxicity analysis
For the measurement of NK cell cytotoxicity, K562 target cells were stained with 10 μM of calcein-AM (BD Pharmingen) at 37°C for 30 minutes. After 3 washes with phosphate-buffered saline and a 1-hour rest, target cells were plated with either control or cytokine-trained NK cells at an NK cell/target cell ratio of 5:1, 2:1, or 1:1. For measurement of spontaneous release and maximum release, only calcein-stained target cells were added to the wells or a final concentration of 0.4% Triton X-100 lysis buffer was added to target cells, respectively. Cells were incubated for 4 hours at 37°C. After incubation, the plate was centrifuged at 200 g for 5 minutes, and 75 μL of supernatant was transferred to a black 96-well plate. Fluorescence was measured on the Molecular Probes Spectra Max M3 spectrometer with an excitation wavelength of 485 nm and an emission wavelength of 525 nm. All samples were measured in triplicate, and the average was used for further analysis.
Statistical analysis
GraphPad Prism 9 (GraphPad Software) was used for statistical analysis. A 1-way analysis of variance test was used for the comparison of >2 groups throughout, with the Tukey or Sidak test for multiple comparisons. A 2-tailed Student t test was used when there were only 2 groups for analysis. For comparison of relative values, a 1-sample Student t test was used to calculate P values with the theoretical value set as 1.00 or 0.00. A P value of ≤0.05 was considered statistically significant. In all figures, *P ≤ .05, **P ≤ .01, and ***P ≤ .001.
Results
Cytokine training increases NK cell effector functions in mice and humans
For cytokine training, mouse splenocytes or NK cells from human PBMCs were stimulated with IL-12, IL-15, and IL-18 for 18 hours and then washed and placed in low-dose IL-15 for an additional 6 days. We show that when restimulated for 4 hours with IL-12/IL-15, trained NK cells from mice produce significantly more IFN-γ (Figure 1A-B). Both trained and untrained NK cells were comparable in terms of basal cytokine production (Figure 1B). We also show that trained NK cells have increased cytotoxicity toward tumor target cells compared with untrained NK cells (Figure 1C-D). We also demonstrate increased cytokine production (IFN-γ) in trained NK cells from humans (Figure 1E-H).
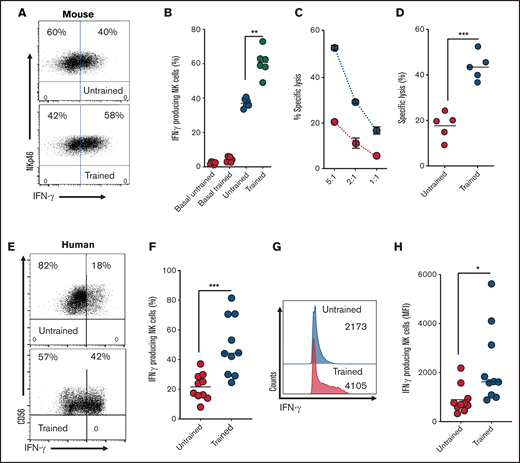
Cytokine-trained NK cells display increased effector functions in both mice and humans. (A-B) Representative dot plot and scatter graph showing IFN-γ production in untrained or trained mouse NK cells. (C) Representative line graph demonstrating the percentage of target cells (K562) lysed by untrained (red circles) or trained mouse NK cells (blue circles) at different effector/target ratios. (D) Scatter graph displaying pooled data demonstrating the percentage of target cells lysed by untrained or trained mouse NK cells at 5:1 target ratio. (E-F) Representative dot plot and scatter graph showing percentage of IFN-γ production in untrained or trained human NK cells. (G-H) Representative histogram and scatter graph showing mean fluorescence intensity (MFI) of IFN-γ production in untrained or trained human NK cells. Data pooled from a minimum of 5 independent experiments unless otherwise stated. Statistical comparisons using Student t test. *P < .05; **P ≤ .01; ***P < .001.
Cytokine-trained NK cells display increased effector functions in both mice and humans. (A-B) Representative dot plot and scatter graph showing IFN-γ production in untrained or trained mouse NK cells. (C) Representative line graph demonstrating the percentage of target cells (K562) lysed by untrained (red circles) or trained mouse NK cells (blue circles) at different effector/target ratios. (D) Scatter graph displaying pooled data demonstrating the percentage of target cells lysed by untrained or trained mouse NK cells at 5:1 target ratio. (E-F) Representative dot plot and scatter graph showing percentage of IFN-γ production in untrained or trained human NK cells. (G-H) Representative histogram and scatter graph showing mean fluorescence intensity (MFI) of IFN-γ production in untrained or trained human NK cells. Data pooled from a minimum of 5 independent experiments unless otherwise stated. Statistical comparisons using Student t test. *P < .05; **P ≤ .01; ***P < .001.
Limiting flux through glycolysis or OXPHOS impairs cytokine training of NK cells
We next investigated the importance of metabolic reprogramming for NK cell training by inhibiting specific pathways during the initial 18-hour stimulation. To investigate the importance of elevated glycolytic flux for mouse NK cell training, NK cells were stimulated for 18 hours in the presence of an inhibitor of glucose metabolism, 2DG.25 Of note, 2DG at a concentration of 2 mM was used, which is a dose that reduces glycolytic flux but is more than fivefold less than that required to ablate glycolysis altogether (supplemental Figure 1A). NK cells stimulated in the presence of 2DG, then cultured for 6 days in the absence of 2DG, failed to acquire the enhanced IFN-γ and cytotoxicity characteristic of trained NK cells (Figure 2A-D). Similarly, 2DG treatment of human NK cells during the initial cytokine stimulation inhibited NK cell training, with NK cells showing a reduction in IFN-γ production upon restimulation on day 6 (Figure 2E). We next investigated the importance of elevated rates of OXPHOS during initial activation for NK cell training. In these experiments, a concentration of oligomycin that limits but does not block OXPHOS was used.22 When flux through OXPHOS was limited with nanomolar concentrations of oligomycin during the initial activation period and not thereafter, enhanced IFN-γ and cytotoxicity characteristic of day-6 trained NK cells were inhibited in mouse NK cells (Figure 2F-I). Similarly, nanomolar oligomycin treatment during initial activation of human NK cells inhibited the training-induced increases in IFN-γ production (Figure 2J).
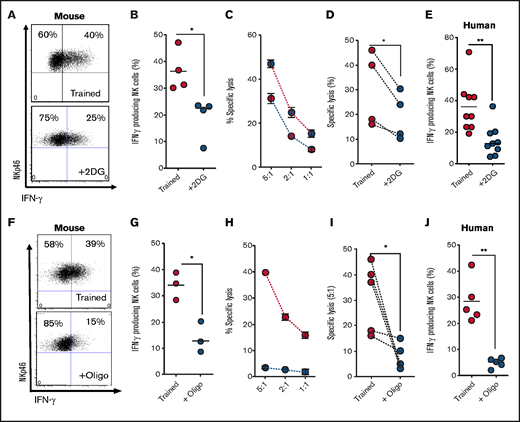
Metabolic inhibition limits NK cell cytokine training. (A-B) Representative dot plot and scatter graph showing impact of 2DG treatment in the initial 18 hours on IFN-γ production by trained mouse NK cells 6 days later. (C) Representative line graph demonstrating the percentage of target cells lysed by trained (red circles) or 2DG-treated (blue circles) mouse NK cells at different effector/target ratios. (D) Scatter graph displaying pooled data demonstrating the impact of initial 2DG on relative lysis of target cells by trained mouse NK cells at 5:1 target ratio on day 7. (E) Scatter graph showing impact of 2DG treatment in the initial 18 hours on IFN-γ production by trained human NK cells at day 7. (F-G) Representative dot plot and scatter graph showing impact of oligomycin treatment in the initial 18 hours on IFN-γ production by trained mouse NK cells at day 7. (H) Representative line graph demonstrating the percentage of target cells lysed by trained (red circles) or oligomycin-treated (blue circles) mouse NK cells at different effector/target ratios. (I) Scatter graph demonstrating the impact of oligomycin on lysis of target cells by trained mouse NK cells at 5:1 target ratio. (J) Scatter graph showing impact of 2DG on IFN-γ production by trained human NK cells. Data pooled from a minimum of 5 independent experiments unless otherwise stated. Statistical comparisons using Student t test. *P < .05; **P ≤ .01.
Metabolic inhibition limits NK cell cytokine training. (A-B) Representative dot plot and scatter graph showing impact of 2DG treatment in the initial 18 hours on IFN-γ production by trained mouse NK cells 6 days later. (C) Representative line graph demonstrating the percentage of target cells lysed by trained (red circles) or 2DG-treated (blue circles) mouse NK cells at different effector/target ratios. (D) Scatter graph displaying pooled data demonstrating the impact of initial 2DG on relative lysis of target cells by trained mouse NK cells at 5:1 target ratio on day 7. (E) Scatter graph showing impact of 2DG treatment in the initial 18 hours on IFN-γ production by trained human NK cells at day 7. (F-G) Representative dot plot and scatter graph showing impact of oligomycin treatment in the initial 18 hours on IFN-γ production by trained mouse NK cells at day 7. (H) Representative line graph demonstrating the percentage of target cells lysed by trained (red circles) or oligomycin-treated (blue circles) mouse NK cells at different effector/target ratios. (I) Scatter graph demonstrating the impact of oligomycin on lysis of target cells by trained mouse NK cells at 5:1 target ratio. (J) Scatter graph showing impact of 2DG on IFN-γ production by trained human NK cells. Data pooled from a minimum of 5 independent experiments unless otherwise stated. Statistical comparisons using Student t test. *P < .05; **P ≤ .01.
Srebp is required for NK cell training
Recently, we described the transcription factor Srebp as a central regulator of glucose metabolism in cytokine-activated NK cells.21 Srebp activation can be prevented using 25HC, which prevents Srebp translocation to the endoplasmic reticulum. Treatment of NK cells with 25HC during initial activation resulted in decreased IFN-γ production and reduced cytotoxicity against tumor target cells in day-6 trained mouse NK cells (Figure 3A-D). Likewise, 25HC treatment during initial activation reduced the increased IFN-γ production by day-6 trained human NK cells (Figure 3E). Although 25HC is a potent and physiological inhibitor of Srebp activation, it can also be an LXR agonist in some cell types. Therefore, to confirm the importance of Srebp-mediated metabolic responses for NK cell training, an alternative inhibitor with a distinct mechanism of action was used. PF429242 is an inhibitor of 1 site-1 protease, the activity of which is essential for Srebp cleavage and activation. When mouse or human NK cells were stimulated with the training cytokines in the presence of PF429242, there was a clear impairment of the training response on day 6 that was comparable to that observed with 25HC (Figure 3F-J). Taken together, these data demonstrate a requirement for Srebp activity during the initial activation period for the enhanced responses of day-6 trained NK cells.
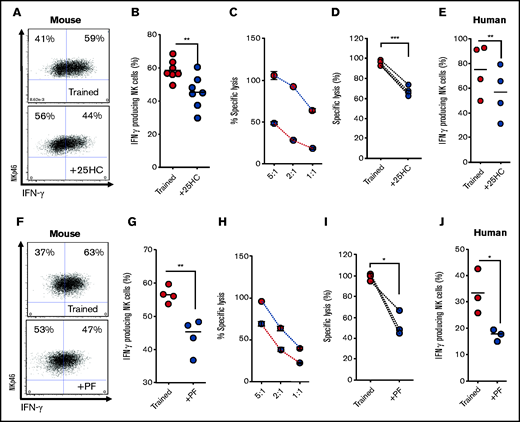
Inhibition of Srebp limits NK cell cytokine training. (A-B) Representative dot plot and scatter graph showing impact of 25HC treatment in the initial 18 hours on IFN-γ production by trained mouse NK cells 6 days later. (C) Representative line graph demonstrating the percentage of target cells lysed by trained (red circles) or 25HC-treated (blue circles) mouse NK cells at different effector/target ratios. (D) Scatter graph displaying pooled data demonstrating the impact of 25HC on lysis of target cells by trained mouse NK cells at 5:1 target ratio. (E) Scatter graph showing impact of 25HC treatment in the initial 18 hours on IFN-γ production by trained human NK cells on day 7. (F-G) Representative dot plot and scatter graph showing impact of PF429242 treatment in the initial 18 hours on IFN-γ production by trained mouse NK cells. (H) Representative line graph demonstrating the percentage of target cells lysed by trained (red circles) or PF429242 treated (blue circles) mouse NK cells at different effector/target ratios. (I) Scatter graph demonstrating the impact of PF429242 treatment in the initial 18 hours on relative lysis of target cells by trained mouse NK cells at 5:1 target ratio. (J) Scatter graph showing impact of PF429242 treatment in the initial 18 hours on IFN-γ production by trained human NK cells at day 7. Data pooled from a minimum of 3 independent experiments unless otherwise stated. Statistical comparisons using Student t test. *P < .05; **P ≤ .01; ***P < .001.
Inhibition of Srebp limits NK cell cytokine training. (A-B) Representative dot plot and scatter graph showing impact of 25HC treatment in the initial 18 hours on IFN-γ production by trained mouse NK cells 6 days later. (C) Representative line graph demonstrating the percentage of target cells lysed by trained (red circles) or 25HC-treated (blue circles) mouse NK cells at different effector/target ratios. (D) Scatter graph displaying pooled data demonstrating the impact of 25HC on lysis of target cells by trained mouse NK cells at 5:1 target ratio. (E) Scatter graph showing impact of 25HC treatment in the initial 18 hours on IFN-γ production by trained human NK cells on day 7. (F-G) Representative dot plot and scatter graph showing impact of PF429242 treatment in the initial 18 hours on IFN-γ production by trained mouse NK cells. (H) Representative line graph demonstrating the percentage of target cells lysed by trained (red circles) or PF429242 treated (blue circles) mouse NK cells at different effector/target ratios. (I) Scatter graph demonstrating the impact of PF429242 treatment in the initial 18 hours on relative lysis of target cells by trained mouse NK cells at 5:1 target ratio. (J) Scatter graph showing impact of PF429242 treatment in the initial 18 hours on IFN-γ production by trained human NK cells at day 7. Data pooled from a minimum of 3 independent experiments unless otherwise stated. Statistical comparisons using Student t test. *P < .05; **P ≤ .01; ***P < .001.
NK cell training is defective in POW
Our recent study showed that NK cell metabolism and effector function are severely impaired in PWO.12 We demonstrated that cytokine stimulation failed to induce increased glycolysis or OXPHOS in NK cells from PWO. Here, in a similar manner, we demonstrate reduced metabolic gene expression in NK cells from PWO after 18-hour stimulation with IL-12/IL-15/IL-18 (Figure 4A). These data include reduced expression of genes involved in glycolysis (GLUT1/SLC2A1, HKII and PFKM), Srebp1 (SREBP1), and Srebp target genes (FASN and ACAT2). The data presented here support a key role for cellular metabolism in facilitating NK cell training, suggesting NK cells from PWO may not be capable of normal cytokine training. Therefore, we next investigated whether NK cells from PWO undergo normal cytokine training. As predicted, NK cells from adults with obesity did not demonstrate elevated IFN-γ production after cytokine training compared with healthy controls (Figure 4B-C).
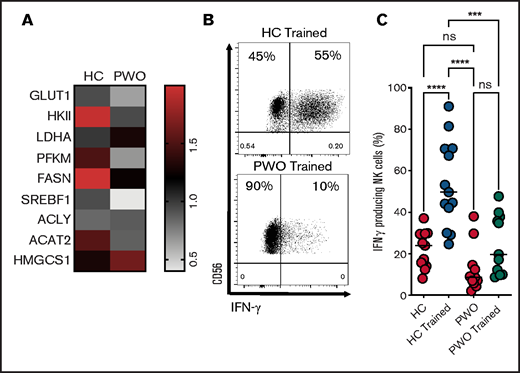
POW display defective NK cell cytokine training. (A) Heatmap displaying the expression of metabolism-related genes (measured by reverse transcription polymerase chain reaction) in healthy controls (HC; n = 5) and PWO (n = 5). (B-C) Representative dot plot and scatter graph showing impact of NK cells cytokine training on IFN-γ production in cohorts of HC and PWO. Data pooled from a minimum of 5 independent experiments unless otherwise stated. Statistical comparisons using analysis of variance with multiple comparisons. ***P < .001; ****P = < .0001. ns, not significant.
POW display defective NK cell cytokine training. (A) Heatmap displaying the expression of metabolism-related genes (measured by reverse transcription polymerase chain reaction) in healthy controls (HC; n = 5) and PWO (n = 5). (B-C) Representative dot plot and scatter graph showing impact of NK cells cytokine training on IFN-γ production in cohorts of HC and PWO. Data pooled from a minimum of 5 independent experiments unless otherwise stated. Statistical comparisons using analysis of variance with multiple comparisons. ***P < .001; ****P = < .0001. ns, not significant.
Discussion
NK cells constitute a critical player in host defense against viruses and malignancy because of their innate ability to kill target cells and initiate a wider immune response.26 Their importance in our defense against cancer is highlighted by the increased prevalence of cancers in humans deficient in NK cells.27 It was originally proposed that NK cells were solely effector cells without memory; however, several studies have now demonstrated that NK cells can gain the ability to form memory-like responses and be trained to be more effective in their responses.16-18 Using the system defined by Romee et al,17 we show that NK cells from both mice and humans exhibit increased effector function after an initial cytokine training period. This highlights their potential use as an immunotherapy. Phase 2 clinical trials investigating their use in myeloid leukemia have shown promising results, with enhanced NK cell responses resulting in positive clinical outcomes.18
A gap in our understanding is the molecular mechanisms required for NK cell cytokine training. Metabolic reprogramming is critical for NK cell effector function.28 Upon cytokine stimulation, NK cells engage in elevated rates of both glycolytic metabolism and OXPHOS.20 These pathways provide both the energy and the biological intermediates required for robust NK cell responses. Failure to maintain elevated levels of these metabolic pathways results in diminished NK cell responses. We investigated if these pathways are important for NK cell cytokine training by inhibiting them during the initial cytokine stimulation period. Inhibition of glycolysis using 2DG, which competitively inhibits glycolysis, resulted in diminished NK cell training. It is noted that 2DG can also inhibit other metabolic processes25 ; however, we and other have previously demonstrated that low-dose 2DG limits the rate of glycolysis in NK cells.20,21,29 Similarly, inhibition of OXPHOS also resulted in diminished NK cell cytokine training, further highlighting the importance of these pathways for NK cell responses. We have previously demonstrated an unexpected role for Srebp transcription factors as critical regulators of NK cell metabolism.21 We found that the inhibition of Srebp resulted in diminished NK cell training, further demonstrating the importance of Srebp for NK cell responses. There are a number of physiological inhibitors of Srebp activation that may affect NK cell function and training in vivo, including 25HC and 27HC, which have been found to be elevated systemically in patients with nonalcoholic fatty acid disease, chronic hepatitis C infection, and breast cancer.30-32 The enzymes that generate these oxidized cholesterol metabolites are cholesterol 25-hydroxylase and Cyp27a1, respectively; these have been found to be expressed in numerous tumor-associated cells, including tumor-associated myeloid cells and fibroblasts.33,34 Therefore, such metabolic perturbations that affect Srebp activation will prevent the innate training response in NK cells and the immunological advantages it affords. Recent work by Terrén et al35 investigated the metabolic requirements of cytokine-trained NK cells and demonstrated a bias toward glycolysis (although it is noted that the levels of 2DG used in this study were enough to completely shut down all glycolytic activity of the cell). This study did not investigate the requirements for training but instead examined the metabolism used by fully trained cells; however, it supports the importance of metabolism for NK cell activity, in line with our previous work.11,12,20,21,23
As outlined, PWO represent a major risk group for cancer,36,37 with elevated rates of certain cancers and poorer prognosis. This is in part due to defective antitumor immunity, including a loss of NK cell effector functions.5,12,38,39 Therefore, because of their increased effector functions and positive results in clinical trials, cytokine-trained NK cells represent an attractive therapeutic option for PWO. However, we have previously demonstrated that the cellular metabolism of several immune subsets is severely defective in obesity.11,12,40,41 NK cells from PWO fail to engage in metabolic reprogramming because of the lipid overload resulting from the obesogenic microenvironment, which underpins the reported defects in their functional responses.12 Having highlighted the critical importance of cellular metabolism for effective NK cell training, it is not surprising that NK cells from PWO could not be trained, probably because of their defective cellular metabolism. This finding calls into question the viability of autologous cytokine-trained NK cell therapies in PWO. Fortunately, allogeneic NK cell therapies have proved safe and effective, but future work should investigate if the obese microenvironment may render these less effective.
Acknowledgments
N.K.-M., D.O., and A.E.H. are funded by a grant from the Health Research Board (ILP-POR-2019-110). L.T., M.M.P., and A.E.H. are supported by a grant from the National Children’s Research Centre. C.D.B. is supported by a fellowship from Irish Research Council. Financial support for the Attune NxT was provided to the Department of Biology, Maynooth University, by Science Foundation Ireland (16/RI/3399). N.K.-M. and D.K.F. are supported by a grant from Science Foundation Ireland (13/CDA/2161).
Authorship
Contribution: N.K.-M., L.T., V.Z.-B., M.M.P., C.D.B., and C.C. performed experiments, analyzed the data, and helped write the paper; E.E. and D.O. recruited patients, analyzed the data, and helped write the paper; C.M.G., D.K.F., and A.E.H. designed the research, analyzed data, and wrote the manuscript.
Conflict-of-interest disclosure: The authors declare no competing financial interests.
Correspondence: Andrew E. Hogan, Lonsdale Institute for Human Health, Department of Biology, Maynooth University, Kildare, W23 F2H6, Ireland; e-mail: andrew.e.hogan@mu.ie.

