

Key Points
AML is characterized by low transferrin, high TSAT, and high hepcidin through iron redistribution from loss of bone marrow erythroblasts.
Elevated TSAT at diagnosis identifies patients with AML with better prognosis.

Abstract
Acute myeloid leukemia (AML) is a heterogeneous disease with poor prognosis and limited treatment strategies. Determining the role of cell-extrinsic regulators of leukemic cells is vital to gain clinical insights into the biology of AML. Iron is a key extrinsic regulator of cancer, but its systemic regulation remains poorly explored in AML. To address this question, we studied iron metabolism in patients with AML at diagnosis and explored the mechanisms involved using the syngeneic MLL-AF9–induced AML mouse model. We found that AML is a disorder with a unique iron profile, not associated with inflammation or transfusion, characterized by high ferritin, low transferrin, high transferrin saturation (TSAT), and high hepcidin. The increased TSAT in particular, contrasts with observations in other cancer types and in anemia of inflammation. Using the MLL-AF9 mouse model of AML, we demonstrated that the AML-induced loss of erythroblasts is responsible for iron redistribution and increased TSAT. We also show that AML progression is delayed in mouse models of systemic iron overload and that elevated TSAT at diagnosis is independently associated with increased overall survival in AML. We suggest that TSAT may be a relevant prognostic marker in AML.
Introduction
Acute myeloid leukemia (AML) is a heterogeneous disease with increasing incidence. Despite significant advances in supportive therapy and the recent introduction of new drugs, the overall survival of patients with AML remains low, particularly in older patients.1 The expansion and chemoresistance of AML cells depend on specific genetic alterations and cell-extrinsic factors that are increasingly being identified.2
Iron is essential to life, but may potentially generate toxic hydroxyl radicals through Fenton reactions. A balance in both iron concentration and state is therefore required to maintain cellular homeostasis. Leukemic cells depend on iron for DNA synthesis and proliferation yet iron metabolism remains ill-defined in AML. The link between iron and cancer is well recognized3 and epidemiological studies have found an association between higher transferrin saturation (TSAT) and risk of cancer.4,5 It is not clear, however, if this association is causative or if higher TSAT is a consequence of disease severity and/or blood transfusion. In AML, previous studies have proposed restricting iron availability through the use of iron chelators6-8 and targeting CD71-expressing leukemic cells through anti-CD71 antibodies.8,9 In contrast, a recent study showed that ferumoxytol, an iron oxide nanoparticle, has in vivo and in vitro antileukemic activity.10 In addition, iron has a significant role in shaping local microenvironments. Iron polarizes macrophages into a pro-inflammatory M1 subtype11; we have previously observed that the iron chelator deferoxamine (DFO) protects bone marrow (BM) endosteal blood vessels and nonmalignant hematopoietic stem cells in AML-burdened mice.12 At the same time, DFO did not improve survival or reduce leukemia burden.12 Hepcidin, the key systemic iron regulator, is increased in patients with AML undergoing hematopoietic stem cell transplantation,13 a clinical setting where analysis of iron metabolism is confounded by a history of red blood cell (RBC) transfusions. Altogether, there is a lack of understanding of if and how iron metabolism is altered by AML.14 We decided to address this question in the present study.
Methods
Human samples
BM aspirate and peripheral blood from patients were collected into tubes containing EDTA after informed consent. Collection tubes were centrifuged at 200g for 10 minutes. Supernatants were transferred into 15-mL tubes and centrifuged at 1000g for 10 minutes. Plasma and BM fluid were collected and stored at −80°C until further use. Clinical and laboratorial data of patients with a diagnosis of AML (supplemental Table 1) and anemia of inflammation (supplemental Table 2) were retrospectively obtained after review and approval by Centro Hospital Universitário São João’s Local Ethics Committee (approval 220-20). Peripheral blood from patients with AML or lymphoproliferative diseases (supplemental Table 3) were prospectively collected after informed consent. The study was reviewed and approved by Instituto Português de Oncologia do Porto’s Local Ethics Committee (approval 158/018).
Mice
Animals were housed at the i3S animal facility under specific pathogen-free conditions, in a temperature- and light-controlled environment, with free access to standard rodent chow (Teklad Global 14% Protein Rodent Maintenance Diet containing 175 mg/kg iron, Harlan Laboratories) and water. Hfe−/− mice were kindly donated by Helène Coppin (Toulouse, France) and backcrossed to C57BL/6 genetic background at the i3S animal house. C57BL/6J mice were obtained from the i3S animal facility and from Charles River (France). Blood was obtained by retro-orbital bleeding under terminal anesthesia with isoflurane. All animals received humane care according to the criteria outlined by the Federation of European Laboratory Animal Science Associations for the care and handling of laboratory animals (EU Directive 2010/63/EU). Experimental procedures were approved by the i3S Animal Ethics Committee (DD_2019_15) and Direção-Geral de Alimentação e Veterinária.
MLL-AF9 AML mouse model
The model was established as described previously.12,15 For the generation of primary MLL-AF9–driven AML, granulocyte-monocyte progenitors (GMPs) were sorted from lineage-depleted BM cell suspensions obtained from wild-type (WT), CD45.1 C57Bl/6, or mTmG donor mice using a FACS Aria II (BD Biosciences). GMPs were then transduced with retrovirus expressing the MLL-AF9 oncogene followed by IRES-GFP/dsRed; the transduction efficiency was determined by flow cytometry (using a FACS Canto II, BD Biosciences). pMIR/pMIG-FLAG-MLL-AF9 were a gift from Daisuke Nakada (Addgene plasmids #71444 and 71443). A total of 100-200 k transduced GMPs were injected intravenously into sublethally irradiated (450 rads) WT C57Bl/6 recipient mice and primary AML blasts were harvested from these animals upon full disease infiltration (about 3 months posttransplantation). A total of 100 000 leukemic cells were injected into nonirradiated secondary and tertiary recipients.
Mouse splenectomy
The spleens of 8-week-old female C57BL/6J mice were removed under isoflurane anesthesia. A longitudinal incision was made on the left dorsolateral side of the abdomen, caudal to the last rib. The peritoneum was opened, the spleen was carefully mobilized using forceps. Splenic blood vessels were ligated, and the spleen was removed. The peritoneal cavity was closed with a PGA 5.0 continuous suture and the skin closed with PGA 5.0 individual interrupted suture. After surgery, the animals were allowed to recover for 9 days before MLL-AF9 AML transplantation. Mice were monitored closely and euthanized at full infiltration.
Drug treatments
Induction chemotherapy was mimicked by treating young adults (8- to 10-week-old mice) infiltrated with AML (>day 20 posttransplant) with cytarabine (Ara-C; 100 mg/kg per day IV) for 5 days and doxorubicin (Doxo; 3 mg/kg per day I.V.) for 3 days. Ara-C and Doxo were obtained from the Instituto Português de Oncologia do Porto.
In the case of iron dextran treatment, mice received intraperitoneal (IP) injections of 1.25 mg iron dextran (FeDx; Sigma, #D8517) or 1.7 mg dextran control (Dx; Sigma, #D9260) every 4 days between days 7 and 27 after MLL-AF9 cell transplantation (total of 6 injections of FeDX or Dx).
Flow cytometry
Mouse femurs and tibias were dissected and crushed in phosphate-buffered saline containing 2% fetal bovine serum. BM cells were transferred through a 40-µm cell strainer into a 50-mL tube and centrifuged at 500g, 4°C for 5 minutes. Staining for intracellular markers was performed using Foxp3 Transcription Factor Staining Buffer Set (Thermo Fisher Scientific, #00-5523-00). Cells were incubated for 30 minutes at 4°C with the fluorochrome-conjugated antibodies (see supplemental Methods). Flow cytometric quantification of the labile iron pool (LIP) was achieved with Phen Green SK diacetate (#P14313, Invitrogen). Live and dead cells were distinguished using 4,6-diamidino-2-phenylindole (Invitrogen). Calibrite Beads (BD Biosciences) were used to determine absolute cell counts.16 Cells were analyzed with a Flow Cytometer (BD FACS Canto II, Biosciences) and data were analyzed with FlowJo (BD Biosciences).
For human flow cytometry, BM aspirates were processed according to EuroFlow recommendations. Cells were analyzed with a flow cytometer (BD FACS Canto II). Analysis of human BM erythropoiesis was performed as described previously17 using the software Infinicyt (Cytognos S.L.).
Hematologic and iron-related parameters
Complete blood counts and erythrocyte indices in peripheral blood anticoagulated with EDTA were determined in a XE-5000 hematology analyzer (Sysmex) within less than 2 hours of collection. Serum or plasma samples and bone marrow fluid were obtained by centrifugation to determine erythropoietin, iron, transferrin, and ferritin. The same sample was used also to determine soluble transferrin receptor. Erythropoietin was determined using a chemiluminescent immunoassay on the Immulite 2000 analyzer (Siemens Healthcare Diagnostics); iron and transferrin were determined by a colorimetric method and ferritin by immunoturbidimetric assay, using Olympus reagents and analyzer (Olympus Diagnostics); soluble transferrin receptor was determined by nephelometry techniques in the BNII nephelometer (Dade Behring). Internal and external controls and calibrators were used to ensure quality control in all the automatic analyzers, according to the local hospital laboratory procedures.
Human IL-6 and hepcidin quantification
Interleukin 6 (IL-6) was analyzed in plasma samples by a multiplexed immunoassay performed using a Human Premixed Multi-Analyte Kit (Magnetic Luminex Assay, cat. #LXSAHM-04, Kit Lot Number L129889, R&D Systems, Inc.) and analyzed in the Luminex 200TM xMAPTM Technology (Luminex Corp.). The results were quantified based on the median fluorescence intensity (MFI) data using a standard 5-parameter logistic curve fit created by the Luminex xPONENT Software (version 3.1).
Plasma hepcidin levels in human patient samples were measured using a solid phase enzyme-linked immunosorbent assay (ELISA) kit (#EIA-5782; DRG Hepcidin 25 [bioactive] HS ELISA; GmbH) based on the principle of competitive binding. The absorbance was determined at 450 nm with the Synergy Mx Microplate Reader (Gen5). Assay sensitivity is between 0.153 and 81 ng/mL.
Plasma levels of human erythroblast-derived erythroferrone (hERFE) were measured using the Intrinsic Erythroferrone IE ELISA kit (SKU #ERF‐001, Intrinsic Lifesciences). The absorbance was determined at 450 nm with the Synergy Mx Microplate Reader (Gen5). The hERFE levels in each sample were determined through the fitting of a 4‐parameter logistic curve, according to the manufacturer’s protocol.
Mouse serum analysis
Serum iron and total iron-binding capacity (TIBC) were analyzed using a A5800 clinical chemistry analyzer (Beckman Coulter). Mouse serum hepcidin was measured using a Hepcidin-Murine Compete ELISA kit (#HMC-001, Intrinsic Lifesciences) based on the principle of competitive binding. The absorbance was determined at 450 nm with the Synergy Mx Microplate Reader (Gen5). Assay sensitivity is between 0.14 and 1000 ng/mL.
Transmission electron microscopy and EDS
The transmission electron microscopy and energy-dispersive X-ray spectroscopy (EDS) analyses were performed at the Histology and Electron Microscopy Service at i3S, University of Porto, Portugal, with the assistance of Ana Rita Malheiro and Rui Fernandes, according to previously published methods.18 Details are provided in supplemental Methods.
NTBI determination
Non-transferrin bound iron (NTBI) determinations were carried out by the nitrilotriacetic acid–dependent, ultracentrifugation assay. Details are provided in supplemental Methods.
Perls staining
Femurs were fixed in neutral formalin 10%, incubated in EDTA-based decalcifying solution for 48 hours and embedded in paraffin. Spleen samples were fixed in neutral formalin 10% and embedded in paraffin. Following deparaffinization with xylene and hydration by a passage through a grade of alcohols, 3-µm-thick spleen and 4-µm-thick femur sections were stained with Perls’ Prussian blue reaction for ferric iron at IPATIMUP Diagnostics (Porto, Portugal). All slides were examined by the same observer (T.L.D.), in a blinded manner.
Tissue non-heme iron quantification
Non-heme iron content in spleen and liver samples was measured by the bathophenanthroline method as described before.19 Details are provided in supplemental Methods.
Statistical analysis
Data were analyzed using GraphPad Prism (GraphPad Software) and SPSS Statistics (IBM). Unpaired t test was used to compare group means. One-way analysis of variance with post hoc Tukey test or Bonferroni correction was used for multiple comparisons. For survival analysis, the log-rank test was performed. Differences were considered significant when P < .05 (*P < .05, **P < .01, ***P < .001, ****P < .0001).
Details for flow cytometry reagents and antibodies, The Cancer Genome Atlas and RNA-sequencing analysis, NTBI quantification, quantitative polymerase chain reaction (qPCR), electron microscopy, and EDS are provided in the supplemental Methods.
Results
Iron metabolism in human AML
We analyzed serum iron metabolism parameters of 84 patients with AML at diagnosis (supplemental Table 1) and observed a unique profile: high ferritin, low transferrin, normal to high serum iron, and elevated TSAT (median, 51.5%) (Figure 1A). The AML iron profile was not associated with a particular European Leukemia Net risk subgroup (supplemental Figure 1). Inflammation has been associated with myeloid malignancies,20 and ferritin is considered an acute-phase protein. The observed AML-related iron phenotype is, however, clearly distinct from the profile associated with anemia of inflammation (Figure 1B-C), which is characterized by low serum iron and low TSAT, as shown in a group of patients with rheumatological disorders and anemia (Figure 1B; supplemental Table 2). Although the altered iron kinetics in AML could, in principle, be explained by iron overload because frequent RBC transfusions,21 we did not find an association between the iron profile of AML at diagnosis and a history of RBC transfusions (23 patients) (Figure 1D).
![Iron metabolism in human AML at diagnosis. (A) Ferritin, serum iron, transferrin levels, and transferrin saturation (TSAT) were analyzed in a cohort of 84 AML patients (supplemental Table 1) at diagnosis. (B) An analogous evaluation was made in a group of 29 patients with rheumatological disorders (supplemental Table 2) and anemia of inflammation. (C) Summary of the key differences in iron profile observed in AML and in inflammation. (D) Comparison of the same parameters and in the same population described in panel A, according to the transfusional status (nontransfused [NT]; transfused [T]). (E) Iron-related parameters were analyzed in plasma collected from 11 patients with AML at diagnosis and from 12 patients with other conditions, mostly lymphoproliferative disorders (supplemental Table 3).](https://ash.silverchair-cdn.com/ash/content_public/journal/bloodadvances/5/16/10.1182_bloodadvances.2021004373/7/m_advancesadv2021004373f1.png?Expires=1769098108&Signature=C2NQWO6KZfr5U9Ipjldw~PH48fnhHlGxt1wT1Y4vvNMrSDrbY3xeAz~X2eISonmKLqPXb-mCx7IyGTwMKwRrNnpymJdRU8EZUr8sRUHrl~HQjV0rOqxvFXcc7OBZVpdZinpp~mDvNwf0AMrk5hMjqsjenF~2PaMy~IaX1-A4XlMMpyunNuQhR2c2hKg6U-KUhEXq1vYc9bJtnDaafLhLh0hD3rGpDCkHpuW5ksGs8ylLiC5vfC1AXFyCJ7pEGLtYhaYabsfsPYOyZWsQRXGIPydDEiF5b4jn-Dq-3bLvqfbJBWQ7aMeCqTkTZJqDzenUtzfxNbQ3RrXInvxrFuV8cA__&Key-Pair-Id=APKAIE5G5CRDK6RD3PGA)
Iron metabolism in human AML at diagnosis. (A) Ferritin, serum iron, transferrin levels, and transferrin saturation (TSAT) were analyzed in a cohort of 84 AML patients (supplemental Table 1) at diagnosis. (B) An analogous evaluation was made in a group of 29 patients with rheumatological disorders (supplemental Table 2) and anemia of inflammation. (C) Summary of the key differences in iron profile observed in AML and in inflammation. (D) Comparison of the same parameters and in the same population described in panel A, according to the transfusional status (nontransfused [NT]; transfused [T]). (E) Iron-related parameters were analyzed in plasma collected from 11 patients with AML at diagnosis and from 12 patients with other conditions, mostly lymphoproliferative disorders (supplemental Table 3).
Iron metabolism in human AML at diagnosis. (A) Ferritin, serum iron, transferrin levels, and transferrin saturation (TSAT) were analyzed in a cohort of 84 AML patients (supplemental Table 1) at diagnosis. (B) An analogous evaluation was made in a group of 29 patients with rheumatological disorders (supplemental Table 2) and anemia of inflammation. (C) Summary of the key differences in iron profile observed in AML and in inflammation. (D) Comparison of the same parameters and in the same population described in panel A, according to the transfusional status (nontransfused [NT]; transfused [T]). (E) Iron-related parameters were analyzed in plasma collected from 11 patients with AML at diagnosis and from 12 patients with other conditions, mostly lymphoproliferative disorders (supplemental Table 3).
To gain further insight into iron metabolism alterations in AML, we analyzed in more detail key iron-related parameters in 11 patients with newly diagnosed AML and 12 control patients with other hematological malignancies and inflammatory conditions (supplemental Table 3). We found that patients with AML had significantly higher ferritin (median 704.0 vs 136.1 ng/mL; P = .0003), lower transferrin (median 141.0 vs 268.0 mg/dL; P < .0001), higher erythropoietin (EPO) (272.0 vs 8.3 mUI/mL; P < .0001) and very high circulating hepcidin levels (median 152.0 vs 14.3 ng/mL; P< .0001), despite a modest increase in inflammatory C-reactive protein and IL-6 (Figure 1E).
Iron metabolism in the murine MLL-AF9 AML model
To explore the mechanism underlying the changes of iron metabolism in AML, we used the syngeneic MLL-AF9 AML mouse model. In this model, nonirradiated recipient mice are transplanted with AML cells expressing fluorescent proteins (EGFP or mTomato) or the congenic marker CD45.1 that facilitates identification and discrimination of transformed cells from nonmalignant counterparts by flow cytometry (Figure 2A) or imaging. MLL-AF9+ AML cells invade and expand primarily in the BM (Figure 2B) and spleen (Figure 2B, C), leading to hematopoietic failure. Typically, mice become fully infiltrated by leukemia from day 20 and succumb until day 35 if left untreated (Figure 2D). We analyzed these mice at clinically meaningful timepoints: at full infiltration and after treatment with induction chemotherapy (Figure 2E). The chemotherapy regimen was analogous to induction chemotherapy in patients and consisted of 5 days of cytarabine and 3 days of Doxo.
![Iron metabolism in the MLL-AF9 AML mouse model. (A) MLL-AF9+ AML cells express a fluorescent protein or a specific marker, such as CD45.1 that allows the easy identification of AML cells by flow cytometry. (B) Mice transplanted with MLL-AF9+ AML cells are primarily infiltrated by leukemic blasts in the BM and in the spleen (n = 3 mice). (C) The progressive infiltration of the spleen leads to increase weight that normalizes upon chemotherapy treatment. The y-axis denotes percentage (n = 12) (C, control), 3 (10%-30% AML), 17 (>80% AML), and 10 (postchemotherapy [chemo]) mice. (D) Disease progression and response to chemotherapy (arrows; purple line) can be monitored by flow cytometry of the peripheral blood (PB). n = 5-20 mice per time point. (E) Nonirradiated mice recipients were transplanted with 100 000 MLL-AF9+ AML cells and analyzed at full infiltration and after induction chemotherapy with cytarabine (Ara-C) and doxorubicin (Doxo). (F) Mice burden with AML had similar TIBC, SI, TSAT, and NTBI levels. After chemotherapy, mice had increased SI levels, elevated TSAT, and (G) presence of toxic NTBI. Each dot represents a mouse. (H) Circulating hepcidin levels were significantly increased in AML and after chemotherapy. (I) Hepatic Bmp6 expression was significantly increased after chemotherapy treatment, as assessed by qPCR. n = 4-6 mice per group. (J) Representative images of Perls’ staining of BM and spleen sections from control, AML-burdened, and chemotherapy-treated leukemic mice. Scale bar = 200 µm. (K) Quantification of nonheme iron levels in the liver and spleen. Each dot represents a mouse.](https://ash.silverchair-cdn.com/ash/content_public/journal/bloodadvances/5/16/10.1182_bloodadvances.2021004373/7/m_advancesadv2021004373f2.png?Expires=1769098108&Signature=2Y6DRsPAiD7DEKBevpMJ-3YMnAVPvMY3F5Toheo0jzf-lj0It0oewCgBMQUNnVBhNfY~YWSoOZPM4szNZBp1ypoEgnuK0sJ4paewaZN6XaqLxKcLeXyh7UK8eRmhcpr-ddvwl5N2uHgWSBDagrIzr4-hYtTwtmNxJSm3E6Xqr06nkg0ZRW4vGIlcmEF~t6tzX5Pgnbj8QP9KLOs7Fdtc76UocKKUhlXaGy4YhRmx44zX1wZHB3zd~4CUA5~kOIJYMOFiSezZ1iqF2LNNg5kFOfdt6z4pf7SbxU4ChJg0cXAHRtg0pEx6XweiToRi~DxhtOAEzuVugzU~FqSPJ~RsEw__&Key-Pair-Id=APKAIE5G5CRDK6RD3PGA)
Iron metabolism in the MLL-AF9 AML mouse model. (A) MLL-AF9+ AML cells express a fluorescent protein or a specific marker, such as CD45.1 that allows the easy identification of AML cells by flow cytometry. (B) Mice transplanted with MLL-AF9+ AML cells are primarily infiltrated by leukemic blasts in the BM and in the spleen (n = 3 mice). (C) The progressive infiltration of the spleen leads to increase weight that normalizes upon chemotherapy treatment. The y-axis denotes percentage (n = 12) (C, control), 3 (10%-30% AML), 17 (>80% AML), and 10 (postchemotherapy [chemo]) mice. (D) Disease progression and response to chemotherapy (arrows; purple line) can be monitored by flow cytometry of the peripheral blood (PB). n = 5-20 mice per time point. (E) Nonirradiated mice recipients were transplanted with 100 000 MLL-AF9+ AML cells and analyzed at full infiltration and after induction chemotherapy with cytarabine (Ara-C) and doxorubicin (Doxo). (F) Mice burden with AML had similar TIBC, SI, TSAT, and NTBI levels. After chemotherapy, mice had increased SI levels, elevated TSAT, and (G) presence of toxic NTBI. Each dot represents a mouse. (H) Circulating hepcidin levels were significantly increased in AML and after chemotherapy. (I) Hepatic Bmp6 expression was significantly increased after chemotherapy treatment, as assessed by qPCR. n = 4-6 mice per group. (J) Representative images of Perls’ staining of BM and spleen sections from control, AML-burdened, and chemotherapy-treated leukemic mice. Scale bar = 200 µm. (K) Quantification of nonheme iron levels in the liver and spleen. Each dot represents a mouse.
Iron metabolism in the MLL-AF9 AML mouse model. (A) MLL-AF9+ AML cells express a fluorescent protein or a specific marker, such as CD45.1 that allows the easy identification of AML cells by flow cytometry. (B) Mice transplanted with MLL-AF9+ AML cells are primarily infiltrated by leukemic blasts in the BM and in the spleen (n = 3 mice). (C) The progressive infiltration of the spleen leads to increase weight that normalizes upon chemotherapy treatment. The y-axis denotes percentage (n = 12) (C, control), 3 (10%-30% AML), 17 (>80% AML), and 10 (postchemotherapy [chemo]) mice. (D) Disease progression and response to chemotherapy (arrows; purple line) can be monitored by flow cytometry of the peripheral blood (PB). n = 5-20 mice per time point. (E) Nonirradiated mice recipients were transplanted with 100 000 MLL-AF9+ AML cells and analyzed at full infiltration and after induction chemotherapy with cytarabine (Ara-C) and doxorubicin (Doxo). (F) Mice burden with AML had similar TIBC, SI, TSAT, and NTBI levels. After chemotherapy, mice had increased SI levels, elevated TSAT, and (G) presence of toxic NTBI. Each dot represents a mouse. (H) Circulating hepcidin levels were significantly increased in AML and after chemotherapy. (I) Hepatic Bmp6 expression was significantly increased after chemotherapy treatment, as assessed by qPCR. n = 4-6 mice per group. (J) Representative images of Perls’ staining of BM and spleen sections from control, AML-burdened, and chemotherapy-treated leukemic mice. Scale bar = 200 µm. (K) Quantification of nonheme iron levels in the liver and spleen. Each dot represents a mouse.
At full infiltration, no differences in TIBC, serum iron, or TSAT were detected (Figure 2F). In contrast, AML-burdened mice treated with chemotherapy had significantly lower TIBC, higher serum iron, and very high TSAT (mean, 94.6%). As expected, we detected toxic NTBI in sera after chemotherapy treatment (Figure 2G). This is consistent with the detection of NTBI after myeloablative chemotherapy22 and hematopoietic stem cell transplantation23 in clinical studies, which may contribute to tissue damage and infection. We also found higher levels of circulating hepcidin in mice infiltrated with AML and after chemotherapy (Figure 2H). We detected a marked increase in the hepatic expression of Bmp6 in AML-infiltrated mice treated with chemotherapy (Figure 2I). BMP6 is the key endogenous regulator of hepcidin production driven by systemic iron overload,24 which suggests that the increased circulating iron leads to increased hepcidin after chemotherapy.
We also analyzed iron deposition in 3 major sites of iron storage and recycling: the liver, spleen, and BM. Perls’ staining revealed a loss of Prussian blue-positive cells in the BM and spleen of mice with AML, and a recovery after chemotherapy (Figure 2J). Quantification of non-heme iron revealed no differences in the liver but a decrease in the spleen iron content of AML-burdened mice (Figure 2K). These data show that in the mouse model, iron is decreased in the BM and spleen, tissues are infiltrated by AML cells, and is not significantly deposited in the liver.
Loss of BM erythroblasts in AML drive iron redistribution
The observation of increased TSAT in patients with AML (Figure 1A) was not replicated in the mouse model (Figure 2F). A key difference between adult mice and humans is the significant contribution of the spleen to mouse erythropoiesis,25 both at steady state and upon acute hematopoietic stress. This contrasts with human extramedullary erythropoiesis, which only develops in a significant manner under chronic BM stress, such as myelofibrosis. As expected, patients with AML (supplemental Table 4) had decreased BM erythroblasts (Figure 3A-B; supplemental Figure 2), consistent with an infiltrated BM that is unresponsive to EPO. Furthermore, ERFE levels were very low in leukemia patients (Figure 3C), despite the severe anemia and high EPO levels (Figure 1E). Noteworthy was that no significant correlations were found between BM infiltration and peripheral reticulocyte, RBC counts, or iron parameters (supplemental Figure 3).
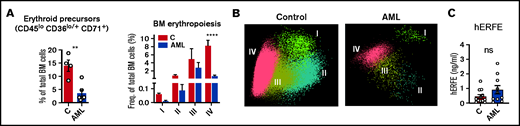
Loss of BM erythroblasts in patients with AML. (A) Flow cytometry analysis of human BM erythroid precursors and of different erythropoiesis stages (I-IV). n = 4 control and 6 patients with AML . (B) Representative automatic population separator diagrams showing multiparametric analysis of flow cytometry data of human erythropoiesis in control and AML patients, based on the markers shown in supplemental Figure 2. (C) Comparison of plasma human erythroferrone (hERFE) in patients with AML at diagnosis (n = 10) and “control” patients (n = 12) with other conditions, mostly lymphoproliferative disorders (supplemental Table 3).
Loss of BM erythroblasts in patients with AML. (A) Flow cytometry analysis of human BM erythroid precursors and of different erythropoiesis stages (I-IV). n = 4 control and 6 patients with AML . (B) Representative automatic population separator diagrams showing multiparametric analysis of flow cytometry data of human erythropoiesis in control and AML patients, based on the markers shown in supplemental Figure 2. (C) Comparison of plasma human erythroferrone (hERFE) in patients with AML at diagnosis (n = 10) and “control” patients (n = 12) with other conditions, mostly lymphoproliferative disorders (supplemental Table 3).
Interestingly, AML-burdened mice had hyperleukocytosis with lymphopenia and thrombocytopenia but normal RBC and reticulocyte counts (Figure 4A), suggesting normal RBC output in AML. Analysis of the BM and spleen confirmed a depletion of BM erythroblasts (Figure 4B-C), but enhanced erythropoiesis in the spleen of leukemic mice (Figure 4D-E). Likewise, messenger RNA expression of erythroid-derived Erfe was significantly increased in the spleen but not in BM of leukemic mice (Figure 4F). Erythropoiesis was not observed in the liver (supplemental Figure 4), showing that the spleen is the main site of erythropoiesis in mice infiltrated with AML.
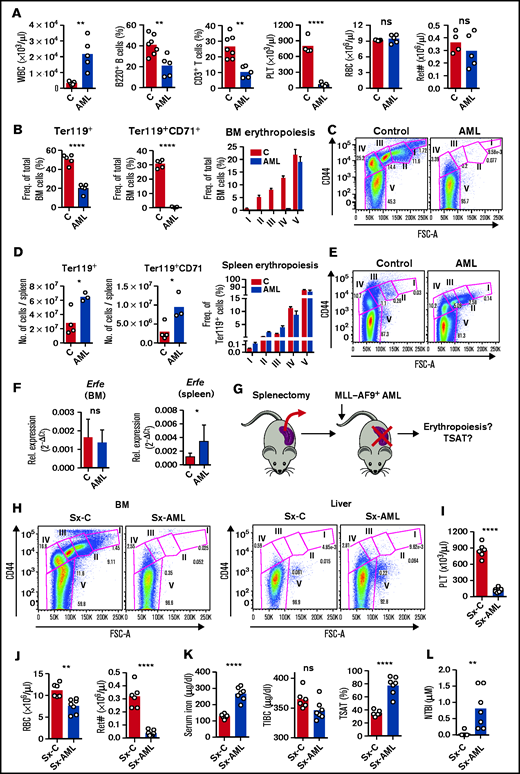
AML-induced loss of erythroblasts causes iron redistribution. (A) Peripheral blood counts for white blood cells (WBC), phenotypically defined B and T cells, platelets (PLT), red blood cells (RBCs), and reticulocyte absolute numbers (Ret#). Each dot represents a mouse. (B) Flow cytometry analysis of BM Ter119+ and Ter119+CD71+ erythroid progenitors and of different erythropoiesis stages (I-V). n = 4 control and 3 AML mice. (C) Representative FACS plots of BM erythropoiesis in control and AML-burdened mice. (D) Flow cytometry analysis of spleen Ter119+ and Ter119+CD71+ erythroid progenitors and of different erythropoiesis stages (I-V). n = 4 control and 3 AML mice. (E) Representative FACS plots of BM erythropoiesis in control and AML-burdened mice. Bone marrow and splenic Erfe (F) expression in control and AML-burdened mice, as assessed by qPCR. n = 7-10 control and 9-10 AML mice wild-type B6 mice were splenectomized (Sx), transplanted (Sx-AML), or not transplanted (Sx-C) (G) with MLL-AF9+ AML and analyzed at full infiltration. (H) Representative FACS plots of BM and liver erythropoiesis in splenectomized mice. Peripheral blood counts for PLT (I) and for RBCs and Ret# (J) in splenectomized mice. Sx-AML had increased SI and TSAT (K) and presence of toxic NTBI (L). Each dot represents a mouse.
AML-induced loss of erythroblasts causes iron redistribution. (A) Peripheral blood counts for white blood cells (WBC), phenotypically defined B and T cells, platelets (PLT), red blood cells (RBCs), and reticulocyte absolute numbers (Ret#). Each dot represents a mouse. (B) Flow cytometry analysis of BM Ter119+ and Ter119+CD71+ erythroid progenitors and of different erythropoiesis stages (I-V). n = 4 control and 3 AML mice. (C) Representative FACS plots of BM erythropoiesis in control and AML-burdened mice. (D) Flow cytometry analysis of spleen Ter119+ and Ter119+CD71+ erythroid progenitors and of different erythropoiesis stages (I-V). n = 4 control and 3 AML mice. (E) Representative FACS plots of BM erythropoiesis in control and AML-burdened mice. Bone marrow and splenic Erfe (F) expression in control and AML-burdened mice, as assessed by qPCR. n = 7-10 control and 9-10 AML mice wild-type B6 mice were splenectomized (Sx), transplanted (Sx-AML), or not transplanted (Sx-C) (G) with MLL-AF9+ AML and analyzed at full infiltration. (H) Representative FACS plots of BM and liver erythropoiesis in splenectomized mice. Peripheral blood counts for PLT (I) and for RBCs and Ret# (J) in splenectomized mice. Sx-AML had increased SI and TSAT (K) and presence of toxic NTBI (L). Each dot represents a mouse.
Erythroblasts are the largest consumers of iron in the body, a requirement for hemoglobin synthesis. We hypothesized that the loss of erythroblasts in AML drives iron redistribution and TSAT increase, which would not be observed in mice because of compensatory splenic erythropoiesis. We therefore predicted that splenectomized leukemic mice (Sx-AML) would phenocopy patients with AML (Figure 4G). At full infiltration, BM erythroblasts were depleted and no erythropoietic compensation was observed in the liver of Sx-AML animals (Figure 4H). Analysis of the peripheral blood revealed thrombocytopenia (Figure 4I), anemia and significant reticulocytopenia in Sx-AML mice (Figure 4J), consistent with loss of erythropoiesis. Importantly, Sx-AML mice had increased TSAT (Figure 4K) and detectable NTBI (Figure 4L), demonstrating that, as predicted, in the absence of compensatory extramedullary erythropoiesis, the loss of BM erythroblasts causes iron redistribution in AML.
AML cells accumulate iron
We have shown that iron redistribution is partly corrected by chemotherapy (Figure 2J-K), which also leads to a dramatic increase in circulating iron (Figure 2F-G). This suggests that: (1) AML cells sequester a significant amount of the iron that is not being used for erythropoiesis; and (2) iron is released from dying cells after chemotherapy. To address the iron status of AML cells, we measured intracellular iron levels and the expression of iron-related genes/proteins. Transferrin receptor 1 (CD71) is expressed at very high levels in erythroblasts but is not lineage-specific and is also expressed in proliferating cells, such as AML cells (Figure 5A). Noteworthy, CD71 surface expression was lower in AML cells in comparison with proliferating Ki-67hi nonmalignant cells, suggesting decreased iron demand in leukemic cells (Figure 5B). Consistently, increased intracellular iron levels in AML cells were detected using electron microscopy and elemental analysis (EDS) (Figure 5C) and quantification of the LIP with Phen Green SK labeling26 using flow cytometry (Figure 5D). Furthermore, we detected increased expression of heme oxygenase 1 (Hmox1) and ferritin light chain 1 (Ftl1) in AML cells (Figure 5E), which is consistent with increased intracellular iron levels.27 In particular, a decreased heavy (Fth1) to light (Ftl1) ferritin chain ratio (Figure 5E) is indicative of increased LIP and is not altered in inflammation.28,29 We did not detect significant expression of NTBI transporters (zinc-regulated, iron-regulated transporter-like proteins 14 and 8) or of the divalent metal transporter 1 in AML cells (supplemental Figure 5). Possibly contributing to intracellular iron accumulation, we also found very low expression of the iron exporter ferroportin (FPN) at the cell surface of AML cells (Figure 5F).
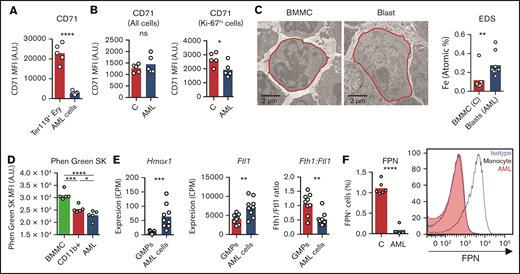
AML cells accumulate iron. (A) FACS analysis of the mean fluorescence intensity (MFI) of surface CD71 in nonmalignant Ter119+ erythroid precursors and AML blasts in the BM. n = 5 mice per group. (B) Analysis of CD71 MFI in all or in proliferating Ki-67hi control nonmalignant BM cells and AML blasts isolated from the BM. n = 5 mice per group. (C) Representative TEM images of BM cells from control and leukemic mice and EDS quantification of atomic iron (Fe) in selected cells. n = 7-9 cells from 3 mice per group. (D) FACS quantification of the labile iron pool (LIP) in BM mononuclear cells (BMMC) or CD11b+ cells from control mice or leukemic cells from AML-burdened mice. The fluorescent indicator Phen Green SK is quenched by iron (lower Phen Green SK MFI corresponds to higher LPI). Each dot represents a mouse. Expression of heme oxygenase 1 (Hmox1), (E) ferritin light chain 1 (Ftl1), and ratio between ferritin heavy chain 1 (Fth1) and Ftl1 expression in nonmalignant GMPs and AML cells (GSE105159). Each dot represents a mouse. (F) Flow cytometry analysis of ferroportin (FPN) in nonmalignant monocytes and AML cells. Right, representative histogram. Each dot represents a mouse.
AML cells accumulate iron. (A) FACS analysis of the mean fluorescence intensity (MFI) of surface CD71 in nonmalignant Ter119+ erythroid precursors and AML blasts in the BM. n = 5 mice per group. (B) Analysis of CD71 MFI in all or in proliferating Ki-67hi control nonmalignant BM cells and AML blasts isolated from the BM. n = 5 mice per group. (C) Representative TEM images of BM cells from control and leukemic mice and EDS quantification of atomic iron (Fe) in selected cells. n = 7-9 cells from 3 mice per group. (D) FACS quantification of the labile iron pool (LIP) in BM mononuclear cells (BMMC) or CD11b+ cells from control mice or leukemic cells from AML-burdened mice. The fluorescent indicator Phen Green SK is quenched by iron (lower Phen Green SK MFI corresponds to higher LPI). Each dot represents a mouse. Expression of heme oxygenase 1 (Hmox1), (E) ferritin light chain 1 (Ftl1), and ratio between ferritin heavy chain 1 (Fth1) and Ftl1 expression in nonmalignant GMPs and AML cells (GSE105159). Each dot represents a mouse. (F) Flow cytometry analysis of ferroportin (FPN) in nonmalignant monocytes and AML cells. Right, representative histogram. Each dot represents a mouse.
Increased TSAT at diagnosis is associated with improved survival in AML
The results given show that AML cells accumulate iron. This led us to hypothesize that increased circulating iron, as measured by TSAT, may have an impact on clinical outcomes in AML. We therefore analyzed our initial cohort of patients with AML (Figure 1A) and observed that, although ferritin levels were not associated with differences in overall survival (OS) (Figure 6A), patients with AML with higher TSAT had a significantly better OS (Figure 6B). TSAT at diagnosis remained an independent prognostic factor for OS in a multivariate analysis including all patients (supplemental Table 5) or only patients undergoing intensive chemotherapy treatment (supplemental Table 6). Consistently, analysis of AML samples from The Cancer Genome Atlas revealed that lower FTH1 to FTL ratio, a surrogate of LIP,28,29 was associated with improved OS (Figure 6C).
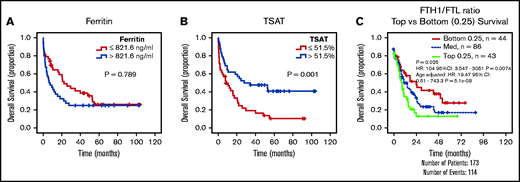
Increased TSAT at diagnosis is associated with increased OS. Kaplan-Meier curves showing no association between overall survival (OS) (A) and ferritin levels (cutoff: median of 821 ng/mL), but OS advantage (B) for patients with AML with elevated TSAT (cutoff: median of 51.5%). n = 84 patients. (C) Kaplan-Meier curve showing improved OS of patients with AML with lower heavy (FTH1) to light ferritin chain (FTL) expression ratio, a surrogate for increased LIP. Data from TCGA.
Increased TSAT at diagnosis is associated with increased OS. Kaplan-Meier curves showing no association between overall survival (OS) (A) and ferritin levels (cutoff: median of 821 ng/mL), but OS advantage (B) for patients with AML with elevated TSAT (cutoff: median of 51.5%). n = 84 patients. (C) Kaplan-Meier curve showing improved OS of patients with AML with lower heavy (FTH1) to light ferritin chain (FTL) expression ratio, a surrogate for increased LIP. Data from TCGA.
To investigate whether increased TSAT prolongs survival in AML, we used 2 different mouse models of systemic iron overload with highly increased TSAT (Figure 7A-B). WT AML cells were transplanted into mice treated with iron-dextran (or dextran) or into mice deficient for the human homeostatic iron regulator protein (HFE). We found that survival was prolonged in mice treated with iron dextran (Figure 7C) and in Hfe−/− recipient mice (Figure 7D), suggesting that increased TSAT is not only associated with, but is also involved in improving OS in AML.

Prolonged survival in leukemic mice with elevated TSAT. (A) Mice transplanted with AML were treated with dextran (Dx) or iron dextran (FeDx). On a separate cohort, WT or Hfe−/− mice were transplanted with MLL-AF9+ AML. (B) FeDx-treated mice and Hfe−/−mice had increased TSAT. Kaplan-Meier curve showing improved survival of leukemic FeDx (C) and Hfe−/− mice (D). n = 5-8 mice per group.
Prolonged survival in leukemic mice with elevated TSAT. (A) Mice transplanted with AML were treated with dextran (Dx) or iron dextran (FeDx). On a separate cohort, WT or Hfe−/− mice were transplanted with MLL-AF9+ AML. (B) FeDx-treated mice and Hfe−/−mice had increased TSAT. Kaplan-Meier curve showing improved survival of leukemic FeDx (C) and Hfe−/− mice (D). n = 5-8 mice per group.
Discussion
In the present study, we show that patients with AML uniquely have increased ferritin, low transferrin, high hepcidin, and increased TSAT (Figure 1A, E). This is consistent with the early studies by Finch and others,30–32 who have also observed low transferrin and increased TSAT in AML.33 Notably, the iron profile of patients with AML reported here cannot be explained by inflammation, secondary iron overload, or a combination of both. In fact, anemia associated with inflammation is typically characterized by low TSAT. Moreover, discrimination between patients with AML who received RBC transfusions and those who did not showed no differences in the parameters analyzed (Figure 1D), confirming that elevated TSAT at diagnosis is not a consequence of secondary iron overload in AML.
The combination of low transferrin, high TSAT, and high ferritin is also observed in hemochromatosis. However, the HFE variant most commonly associated with hemochromatosis is not overrepresented in AML,34 the iron status is comparable between patients with AML with and without HFE variants,35 and we found high levels of hepcidin in AML patients at diagnosis (Figure 1E), which is not compatible with hemochromatosis. In patients with AML , the increase in hepcidin is likely a consequence of increased TSAT and mild inflammation because the production of erythroblast-derived ERFE is not significantly altered (Figure 3C).
To uncover the mechanism underlying the iron profile associated with AML, we used the MLL-AF9 AML mouse model. We observed that although leukemic mice had no anemia and normal TSAT, splenectomized leukemic mice phenocopied the anemia and iron profile observed in patients and had increased TSAT (Figure 2F). This is consistent with the loss of BM erythroblasts being the main culprit of elevated TSAT in AML.
Interestingly, we did not detect significant correlations between BM blast counts and peripheral iron or erythroid parameters (supplemental Figure 3). This may be explained by nonlinear loss of erythroblasts and challenges the hypothesis of simple nonmalignant cell displacement (and consequent iron redistribution). Such displacement theory in AML has been challenged in the case of hematopoietic stem cells,12,36 whose loss is also dependent on niche remodeling, or for platelets and neutrophils,37 whose loss is affected by thrombopoietin scavenging. Analogous mechanisms may be at play in this situation, such as loss of erythroblastic islands. Future studies should explore these mechanisms.
Previous studies have reported elevated TSAT and presence of NTBI in leukemia patients undergoing myeloablative therapy.22,23 Consistently, we detected increased hepcidin, TSAT, and NTBI in chemotherapy-treated leukemic animals (Figure 2F-H), which likely results from a combination of erythropoiesis blockade and iron released by leukemia cells. Furthermore, chemotherapy treatment led to a redistribution of iron back to the tissue-resident macrophages of the BM and spleen (Figure 2J-K), suggesting that iron is released by AML cells. In line with this, we found an increased iron content in AML cells (Figure 5A-E), which also express low levels of FPN at the cell surface (Figure 5F). The latter is compatible with previous reports.10,38 It remains to be explored if the lower expression of FPN in leukemic blasts is the consequence of a disrupted oncogenic transcriptional program, of hepcidin-induced degradation or a combination of both.
AML cells can actively take up and accumulate iron required for cell function and proliferation. Interestingly, we did not detect improvements in survival or reduction of leukemia burden in mice treated with DFO in our previous work.12 In contrast, a recent study showed that iron nanoparticles have an antileukemic effect in AML patient-derived xenografts.10 Furthermore, it has been suggested that iron can potentiate the effect of anticancer drugs in AML (see the abstract in Seligman et al39) and multiple myeloma.40 We experimentally tested whether increased systemic iron influenced AML progression. We found that Hfe−/− mice and animals treated with iron dextran presented delayed AML progression in vivo (Figure 7). These results fit with our observation that patients with AML with elevated TSAT at diagnosis have better OS (Figure 6). TSAT at diagnosis may thus be clinically relevant in AML. The prognostic role of TSAT at diagnosis and its possible inclusion in risk stratification of AML should be further explored in future, larger prospective studies. Future studies should also explore the mechanism underlying the potential antileukemic effect of iron, which may be direct and mediated by oxidative stress, as suggested by the treatment with iron nanoparticles,10 or indirect via the modulation of the microenvironment (eg, endothelial cells) or of immune cells (eg, macrophages).
High peritransplantation labile plasma iron (a form of NTBI) levels in leukemia patients have been associated with increased nonrelapsed mortality.41 In contrast, our observations suggest that elevated TSAT at diagnosis is associated with improved survival. This apparent paradox may be explained by the 2 distinct temporal and clinical scenarios (ie, at diagnosis when the patient is treatment-naïve, which may reflect the natural history of the disease, and before allogeneic transplantation when the patient may be severely transfusion overloaded). Indeed, increased free iron may have an antileukemic effect at diagnosis but may also promote bacterial proliferation and tissue damage during transplantation. Although counterintuitive, strategies that increase the antileukemic activity of iron during AML progression (such as iron nanoparticles10) and that scavenge iron in the transplantation setting (as previously suggested41) may be equally beneficial. Future studies should further explore the bimodal effect of iron at different AML stages.
In conclusion, we demonstrate that iron metabolism is dysregulated in AML. Specifically, the three main findings of our study are that (1) AML is characterized by increased ferritin, low transferrin, high hepcidin, and increased TSAT; (2) the loss of erythroblasts drives iron redistribution in AML; and (3) TSAT at diagnosis may be a useful prognostic marker to guide clinical decision in AML.
Acknowledgments
The authors acknowledge the support of the i3S Scientific Platform Histology and Electron Microscopy Service, member of the national infrastructure PPBI - Portuguese Platform of Bioimaging (PPBI-POCI-01-0145-FEDER-022122).
Funding for this project was provided by an EHA Research Grant award granted by the European Hematology Association (to D.D.). This study was also supported by research funding from National Funds through FCT/MCTES – Portuguese Foundation for Science and Technology within the scope of the project UIDB/50006/2020 to AMNS and the Portuguese Society of Hematology, Fundação Amélia de Mello, and National Blood Foundation (to D.D.).
Authorship
Contribution: M.L., T.L.D., L.M., J.R., M.O., and D.D. performed animal experiments; T.L.D. performed quantitative polymerase chain reaction experiments and tissue iron quantification; M.L., M.J.T., N.G., S.M., and J.T.G. performed serum and plasma quantifications; S.C., M.Q., J.M.M., and D.D. collected patient samples and performed analysis; E.A. and F.T. established a cohort of patients with iron quantifications and performed analysis; G.M. and D.D. performed fluorescent-activated cell sorting analysis of human samples; A.S. performed non-transferrin bound iron quantifications; I.Y.K., M.Z., S.V., and E.D.H. performed RNA-sequencing and The Cancer Genome Atlas data analysis; D.D. and G.P. conceived the project and analyzed data; and D.D. wrote the manuscript with contributions from all authors.
Conflict-of-interest disclosure: All of the authors declare no competing financial interests.
Correspondence: Delfim Duarte, i3S - Instituto de Investigação e Inovação em Saúde, Rua Alfredo Allen, 208, 4200-135 Porto, Portugal; e-mail: delfimd@med.up.pt.

