

Key Points:
We describe the generation of murine cell lines (HPCLSK), which reliably mimic hematopoietic/leukemic progenitor cells.
HPCLSK BCR/ABLp210Cdk6−/− cell line uncovers a novel role for CDK6 in homing.

Abstract
Studies of molecular mechanisms of hematopoiesis and leukemogenesis are hampered by the unavailability of progenitor cell lines that accurately mimic the situation in vivo. We now report a robust method to generate and maintain LSK (Lin−, Sca-1+, c-Kit+) cells, which closely resemble MPP1 cells. HPCLSKs reconstitute hematopoiesis in lethally irradiated recipient mice over >8 months. Upon transformation with different oncogenes including BCR/ABL, FLT3-ITD, or MLL-AF9, their leukemic counterparts maintain stem cell properties in vitro and recapitulate leukemia formation in vivo. The method to generate HPCLSKs can be applied to transgenic mice, and we illustrate it for CDK6-deficient animals. Upon BCR/ABLp210 transformation, HPCLSKsCdk6−/− induce disease with a significantly enhanced latency and reduced incidence, showing the importance of CDK6 in leukemia formation. Studies of the CDK6 transcriptome in murine HPCLSK and human BCR/ABL+ cells have verified that certain pathways depend on CDK6 and have uncovered a novel CDK6-dependent signature, suggesting a role for CDK6 in leukemic progenitor cell homing. Loss of CDK6 may thus lead to a defect in homing. The HPCLSK system represents a unique tool for combined in vitro and in vivo studies and enables the production of large quantities of genetically modifiable hematopoietic or leukemic stem/progenitor cells.
Introduction
Adult hematopoietic stem cells (HSCs) represent 0.005% to 0.01% of all nucleated cells in the bone marrow (BM). They are unique in their ability to continuously self-renew, differentiate into distinct lineages of mature blood cells,1,2 and regenerate a functional hematopoietic system following transplantation into immunocompromised mice.3-6 Most hematopoietic malignancies originate in stem/progenitor cells upon acquirement of genetic/epigenetic defects. These so-called leukemic stem cells (LSCs) maintain key characteristics of regular HSCs, including the ability of self-renewing and multipotency.7-9
Although hematopoietic cell differentiation is a dynamic and continuous process, cell-surface marker expression defining distinct subsets and developmental stages is an inevitable tool in HSC characterization.2 A common strategy is to further define murine lineage–negative, c-Kit and Sca-1–positive (LSK) cells by their CD48, CD135, CD150, and CD34 expression. This marker combination stratifies the most dormant HSCs into the increasingly cycling multipotent progenitors (MPP) 1 and 2 and the myeloid or lymphoid-prone MPP3 and 4.10-12 Leukemia, analogous to normal hematopoiesis, is hierarchically organized; LSCs residing in the BM initiate and maintain the disease and give rise to their more differentiated malignant progeny. Therapeutically, LSCs are often resistant to many current cancer treatments and thus cause disease relapse.9,13-17 Understanding potential Achilles’ heels in LSCs to develop new curative therapeutic approaches is of fundamental interest and represents a major frontier of cancer biology.
Modeling hematopoietic disease development and defining therapeutic intervention sites require the availability of multipotential hematopoietic cell lines. HSCs can be maintained and expanded to a limited extent in vitro: the vast majority of their progeny differentiates in culture. Numerous attempts have been made to increase the number of long-term HSCs in culture, including the use of high levels of cytokines and growth factors or ill-defined factors secreted by feeder cells.18-32
Alternatively, immortalization using genetic manipulation was employed to establish stem cell–like cell lines. One major limitation of these cell lines is the failure to reconstitute a fully functional hematopoietic system upon transplantation.33,34 One of the most successful immortalized murine multipotent hematopoietic cell lines is the erythroid, myeloid, and lymphocytic line derived by retroviral expression of a truncated, dominant-negative form of the human retinoic acid receptor. However, erythroid, myeloid, and lymphocytic cells are phenotypically and functionally heterogeneous and display a block in the differentiation of myeloid cells.35-42
An alternative route for immortalization of murine multipotent hematopoietic cells was employing Lhx2,43-47 a LIM-homeobox domain transcription factor binding a variety of transcriptional cofactors. Lhx2 is expressed in embryonic hematopoietic locations, such as the aorta-gonad-mesonephros region, yolk sac, and fetal liver, but is absent in BM, spleen, and thymus of adult mice.48-50 Lhx2 upregulates key transcriptional regulators for HSCs, including Hox and Gata, while downregulating differentiation-associated genes.43 Lhx2 is aberrantly expressed in human chronic myelogenous leukemia, suggesting a role for Lhx2 in the growth of immature hematopoietic cells.51 Enforced expression of Lhx2 in BM-derived murine HSCs and embryonic stem cells (ES)/induced pluripotent cells resulted in ex vivo expansion of engraftable HSC-like cells45,47,52 strictly dependent on stem cell factor (SCF) and yet undefined autocrine loops providing additional secreted molecule(s).44 These cells generate functional progeny and in the long term repopulate stem cell–deficient hosts.45,47,52
The cyclin-dependent kinase 6 (CDK6) has been recently described as a critical regulator of HSC quiescence and is essential in BCR/ABLp210 LSCs.53,54 Besides its main characteristic, CDK6 and its close homolog CDK4 control cell-cycle progression, CDK6 functions as a transcriptional regulator.55-57 CDK6 is recognized as being a key oncogenic driver in hematopoietic malignancies and therefore represents a promising target for cancer therapy and intervention.53,58,59 More recent evidence highlights the importance of CDK6 during stress, including oncogenic transformation when CDK6 counteracts p53 effects.60 Furthermore, CDK6 plays a crucial role in several myeloid diseases, including Jak2V617F+ myeloproliferative neoplasm, chronic myeloid leukemia, and acute myeloid leukemia, by regulating stem cell quiescence, apoptosis, differentiation, and cytokine secretion.53,61,62
Using the long-term culture system, it was possible to generate HPCLSKs from the transgenic mouse line Cdk6−/−, which represents a powerful tool to analyze specific functions of CDK6 in progenitor cells and allows mechanistic and therapeutic studies tailored specifically to leukemic stem/progenitor cells.
Materials and methods
HPCLSK cell line generation
BM of 2 to 5 C57BL/6N (Ly5.2+) mice was isolated, pooled, and sorted for LSK cells. Sorted LSK cells were cultured in 48-well plates for 48 hours in a 1:1 ratio of Stem Pro-34 SFM (Gibco/Thermo Scientific, Waltham, MA) and Iscove modified Dulbecco medium (IMDM; Sigma-Aldrich, St. Louis, MO) supplemented with 0.75 × 10⁻⁴ M 1-thiolglycerol (Sigma), 1% penicillin/streptomycin (Sigma), 2 mM l-glutamine (Sigma), 25 U heparin (Sigma), 10 ng fibroblast growth factor (mFGF) acidic (R&D Systems, Minneapolis, MN), 10 ng murine insulin-like growth factor II (mIGF-II) (R&D), 20 ng murine thrombopoetin (mTPO) (R&D), 10 ng murine interleukin-3 (mIL-3) (R&D), 20 ng human interleukin-6 (hIL-6) (R&D), and SCF (generated in-house) used at 2% final concentration. LSK cells were transduced with a Lhx2 pMSCV-puromycin (Clontech/Takara, Mountain View, CA) vector46 in 1% peqGOLD Universal Agarose (Peqlab/VWR, Darmstadt, Germany) coated 48-well plates and transfected 4 times on days 3 to 6 with the Lhx2-containing viral supernatant. At day 7, cells were transferred to 1% agarose-coated 24-well plates in IMDM with 5% fetal calf serum, 1.5 × 10⁻⁴ M 1-thiolglycerol, penicillin/streptomycin, 2 mM l-glutamine, referred hereafter as IMDM culture medium. In addition, the IMDM culture medium was supplemented with 12.5 ng/mL interleukin-6 (IL-6; R&D) and 2% SCF. At day 10, 1.5 µg/mL puromycin (InvivoGen, San Diego, CA) was added to the medium to select for the Lhx2 expressing LSK cells. The same reagents were subsequently used for all the experiments.
HPCLSK cell line culture
HPCLSK cell lines were kept on 1% agarose-coated culture plates. Solidified plates were stored in a 5% CO2 humidified incubator with 1 mL IMDM culture media per well. HPCLSK cells were plated in IMDM culture media supplemented with 12.5 ng/mL IL-6 and 2% SCF on the agarose plates. Cells were continuously kept at a density between 0.8 and 2 × 10⁶ cells per mL.
Results
Generation of murine hematopoietic progenitor HPCLSK cell lines
To meet the increasing need of studying hematopoietic stem/progenitor cells, we sought to establish a robust method to generate murine stem-cell lines by modifying a strategy that was originally described by the Carlsson laboratory.45,46 Sorted murine Ly5.2+ LSK cells were maintained in cytokine- and growth factor–supplemented serum-free medium for 2 days. Thereafter, the cells were infected with a retroviral construct encoding Lhx2 coupled to a puromycin selection marker and switched to SCF, IL-6, and 5% serum-containing IMDM culture medium on agarose-coated plates to prevent attachment-induced differentiation. Puromycin selection was initiated 10 days after sorting. Within 4 weeks continuously proliferating, HPCLSK cell lines establish and can be stored long term by cryopreservation (Figure 1A). LSK cells can be classified into dormant HSCs and 4 subsequent MPP populations based on their surface markers.10-12 HPCLSK cell lines express c-Kit and Sca-1 but lack expression of the myeloid and lymphoid lineage markers Gr-1 (neutrophil), CD11b (monocyte/macrophage), CD3 (T cell), CD19 (B cell), and Ter119 (erythroid). According to the CD34, CD48, and CD150 expression, HPCLSKs categorize as MPP2, a population able to give rise to myeloid and lymphoid cells.10-12 Despite the MPP2 surface expression markers, transcriptome analysis of HPCLSKs revealed a predominant overlap with the MPP1 signature pointing to an even more immature state. Upon long-term culture, a uniform cellular morphology is maintained within the cell lines (Figure 1B; supplemental Figure 1A-D). Comparison with other progenitor cell lines, including the BM-derived BM-HPC5, BM-HPC9, and the ES-derived HPC-7 cell line,45,46 showed that HPCLSKs have the most immature profile. The other cell lines are either positive for lineage markers or lack Sca-1 expression. The ES-derived HPC-7 cell line stains positive for c-Kit, Sca-1, CD48, and CD150 and lacks lineage markers. It is also limited in its differentiation capacity63,64 (supplemental Figure 1E).

Establishing murine hematopoietic progenitor HPCLSKlines. (A) Schematic workflow of HPCLSK cell line establishment. LSKs were sorted from murine BM, transfected with Lhx2 including a puromycin selection marker and kept in SCF and IL-6 on 1% agarose-coated plates. StemPro-34 SFM: serum free media. (B) Principal component analysis (PCA) of the expression profiles of HPCLSKs (n = 3) compared with murine HSCs (batch-corrected top 500 variance genes are plotted). (C) Immunoblot of lysates from 3-hour starved HPCLSK cells followed by treatment with IL-7, EPO, TPO, GM-CSF, SCF, IL-6, or IL-3 (100 ng/mL each) for 15 minutes. The presence of total and phosphorylated STAT5, STAT3, AKT, and ERK was detected. HSC70 serves as a loading control. st, starved. A representative blot of 2 independent experiments is shown. (D) Colonies with different morphologies were counted. Seeding density of 1250 HPCLSKs or 240 000 BM cells per 35-mm dish. Error bars represent mean ± standard deviation (SD), n ≥ 3. (E) Images of colonies formed by HPCLSK cells 10 days after cytokine cocktail treatment (EPO, GM-CSF, holo-transferrin, IL-7, SCF, IL-6, IL-3) in semisolid methylcellulose gels. BFU-E, burst-forming unit-erythroid; CFU-GEMM, CFU-granulocyte erythrocyte monocyte megakaryocyte; CFU-GM, colony-forming unit-granulocyte macrophage.
Establishing murine hematopoietic progenitor HPCLSKlines. (A) Schematic workflow of HPCLSK cell line establishment. LSKs were sorted from murine BM, transfected with Lhx2 including a puromycin selection marker and kept in SCF and IL-6 on 1% agarose-coated plates. StemPro-34 SFM: serum free media. (B) Principal component analysis (PCA) of the expression profiles of HPCLSKs (n = 3) compared with murine HSCs (batch-corrected top 500 variance genes are plotted). (C) Immunoblot of lysates from 3-hour starved HPCLSK cells followed by treatment with IL-7, EPO, TPO, GM-CSF, SCF, IL-6, or IL-3 (100 ng/mL each) for 15 minutes. The presence of total and phosphorylated STAT5, STAT3, AKT, and ERK was detected. HSC70 serves as a loading control. st, starved. A representative blot of 2 independent experiments is shown. (D) Colonies with different morphologies were counted. Seeding density of 1250 HPCLSKs or 240 000 BM cells per 35-mm dish. Error bars represent mean ± standard deviation (SD), n ≥ 3. (E) Images of colonies formed by HPCLSK cells 10 days after cytokine cocktail treatment (EPO, GM-CSF, holo-transferrin, IL-7, SCF, IL-6, IL-3) in semisolid methylcellulose gels. BFU-E, burst-forming unit-erythroid; CFU-GEMM, CFU-granulocyte erythrocyte monocyte megakaryocyte; CFU-GM, colony-forming unit-granulocyte macrophage.
HPCLSK cells are able to differentiate to myeloid and lymphoid cells in vitro
To explore signaling patterns, HPCLSK cells were treated with cytokines for 15 minutes. Erythropoietin (EPO), granulocyte-macrophage colony-stimulating factor (GM-CSF), or IL-3 resulted in phosphorylation and activation of STAT5, STAT3, AKT, and ERK signaling, whereas IL-6 induced predominantly STAT3 phosphorylation. STAT3, AKT, and ERK were also activated upon SCF treatment albeit to a lesser extent in line with signaling in stem/progenitor cells (Figure 1C). In line, HPCLSK cells formed erythroid (BFU-E), myeloid (CFU-GM, CFU-GEMM), and pre-B (CFU-pre-B) cell colonies in methylcellulose-enriched cytokines (EPO, GM-CSF, IL-7, SCF, IL-6, IL-3) comparable to primary BM-derived cells (Figure 1D-E). We confirmed expression of erythroid (Ter119/CD71), myeloid (CD11b/Gr-1), or B-cell (B220/CD93) markers on these colonies (supplemental Figure 1G). In comparison, the ability to form colonies and to in vitro differentiate HPC-7 and BM-HPC5 cells was reduced in accordance with an impaired cytokine–induced activation of STAT5, STAT3, AKT, and ERK (supplemental Figure 1F,H-J).
HPCLSKs are multipotent in vivo
As HPCLSKs differentiate into myeloid and lymphoid lineages in vitro, we explored the potential of the cells to protect mice from radiation-induced death in vivo. Lethally irradiated Ly5.1+ mice received 1 × 10⁷ Ly5.2+ BM-HPC5 or HPCLSK cells per tail vein injection. Ly5.2+ BM cells were used as controls. Noninjected irradiated mice died within 10 days, briefly thereafter followed by BM-HPC5 recipients. Injection of HPCLSKs and primary BM cells rescued the mice because of the efficient repopulation of the hematopoietic system (Figure 2A-B). After 40 days, white blood cell (WBC) and red blood cell counts were comparable between HPCLSKs and BM-injected controls (Figure 2C). Blood counts remained stable over a 6-month period after which the experiment was terminated (supplemental Figure 2A). HPCLSKs had efficiently homed to the BM, blood, spleen, and thymus, comparable to the BM control, and no alterations of the spleen weight was detectable (Figure 2D-E). Fluorescence-activated cell sorting analysis confirmed the efficient repopulation of the hematopoietic system. Numbers of myeloid and lymphoid progenitors in the BM and differentiated blood cells (Gr-1+ granulocytes, CD11b+ monocytes, Gr-1/CD11b+ eosinophils/neutrophils, and B220+ B cells) were comparable to BM-injected mice. Only HPCLSK-derived CD4+ or CD8+ T cells were significantly lower in the blood but were present in the thymus in similar numbers as in the BM-injected control (Figure 2F).

HPCLSKcell lines can repopulate the hematopoietic system. (A) Experimental scheme: Ly5.1+-recipient mice were lethally irradiated (10 Gy) 24 hours prior to IV injection of 1 × 10⁷ Ly5.2+ BM (positive control), BM-HPC5, or HPCLSK cells. Forty days later, some mice of the BM and HPCLSK-injected group were euthanized, and hematopoietic organs were analyzed. The remaining injected mice were analyzed for their long-term survival. (B) Survival of BM- (n = 7), BM-HPC5- (n = 8), and HPCLSKs- (n = 10) injected mice compared with radiation control (n = 9), log-rank (Mantel-Cox) test. ***P <.0001. (C) WBCs and red blood cells in peripheral blood of BM- and HPCLSK-injected recipients were compared 40 days after treatment. Data are presented as mean ± standard error of the mean (SEM; *P <.01, Student t test or Mann-Whitney test for platelets) in 6 to 12 mice per group. (D) Comparison of Ly5.2+ BM vs HPCLSK cells’ engraftment in the blood, BM, spleen, and thymus of lethally irradiated Ly5.1+ mice after 40 days. Data are presented as mean ± SD, n ≥ 4. (E) Spleen weights of mice 40 days after lethal irradiation and BM or HPCLSK injection. Data represent mean ± SD, n ≥ 5. (F) Composition of the engrafted Ly5.2+ HPCLSK cells in blood, BM, and thymus after 40 days. ST-HSC, MPP (Lin−, Sca-1+, c-Kit+, CD150−, CD48+), LSKs (Lin−, Sca-1+, c-Kit+), MCP (myeloid committed progenitor, Lin−, IL-7R−, Sca-1−, c-Kit+), GMP (granulocyte-monocyte progenitor, Lin−, IL-7R−, Sca-1−, c-Kit+, CD16/32+, CD34+), CMP (common myeloid progenitor, Lin−, IL-7R−, Sca-1−, c-Kit+, CD16/32−, CD34+), MEP (megakaryocyte-erythrocyte progenitor, Lin−, IL-7R−, Sca-1−, c-Kit+, CD16/32−, CD34−), CLP (common lymphoid progenitor, Lin−, IL7-R+, c-Kitmid, Sca-1mid); and in vivo differentiated populations: erythroblast (CD71/CD44+), granulocyte (Gr-1+), monocyte (CD11b+), eosinophil/neutrophil (Gr-1/CD11b+), T cell (CD4 or CD8+), and B cell (B220+) are depicted as fold change compared with BM-injected mice. n = 6 to 12 per group, *P <.05; **P <.01; ***P <.001 by Student t test. Ctrl, control; inj., injected; ns, not significant; rad, radiation; RBC, red blood cell.
HPCLSKcell lines can repopulate the hematopoietic system. (A) Experimental scheme: Ly5.1+-recipient mice were lethally irradiated (10 Gy) 24 hours prior to IV injection of 1 × 10⁷ Ly5.2+ BM (positive control), BM-HPC5, or HPCLSK cells. Forty days later, some mice of the BM and HPCLSK-injected group were euthanized, and hematopoietic organs were analyzed. The remaining injected mice were analyzed for their long-term survival. (B) Survival of BM- (n = 7), BM-HPC5- (n = 8), and HPCLSKs- (n = 10) injected mice compared with radiation control (n = 9), log-rank (Mantel-Cox) test. ***P <.0001. (C) WBCs and red blood cells in peripheral blood of BM- and HPCLSK-injected recipients were compared 40 days after treatment. Data are presented as mean ± standard error of the mean (SEM; *P <.01, Student t test or Mann-Whitney test for platelets) in 6 to 12 mice per group. (D) Comparison of Ly5.2+ BM vs HPCLSK cells’ engraftment in the blood, BM, spleen, and thymus of lethally irradiated Ly5.1+ mice after 40 days. Data are presented as mean ± SD, n ≥ 4. (E) Spleen weights of mice 40 days after lethal irradiation and BM or HPCLSK injection. Data represent mean ± SD, n ≥ 5. (F) Composition of the engrafted Ly5.2+ HPCLSK cells in blood, BM, and thymus after 40 days. ST-HSC, MPP (Lin−, Sca-1+, c-Kit+, CD150−, CD48+), LSKs (Lin−, Sca-1+, c-Kit+), MCP (myeloid committed progenitor, Lin−, IL-7R−, Sca-1−, c-Kit+), GMP (granulocyte-monocyte progenitor, Lin−, IL-7R−, Sca-1−, c-Kit+, CD16/32+, CD34+), CMP (common myeloid progenitor, Lin−, IL-7R−, Sca-1−, c-Kit+, CD16/32−, CD34+), MEP (megakaryocyte-erythrocyte progenitor, Lin−, IL-7R−, Sca-1−, c-Kit+, CD16/32−, CD34−), CLP (common lymphoid progenitor, Lin−, IL7-R+, c-Kitmid, Sca-1mid); and in vivo differentiated populations: erythroblast (CD71/CD44+), granulocyte (Gr-1+), monocyte (CD11b+), eosinophil/neutrophil (Gr-1/CD11b+), T cell (CD4 or CD8+), and B cell (B220+) are depicted as fold change compared with BM-injected mice. n = 6 to 12 per group, *P <.05; **P <.01; ***P <.001 by Student t test. Ctrl, control; inj., injected; ns, not significant; rad, radiation; RBC, red blood cell.
To determine cell numbers required for hematopoietic repopulation in mice, we gradually lowered the cell number used for injection. An amount of 2.5 × 10⁶ of HPCLSKs sufficed to allow for an 80% survival of the animals for a period of at least 8 months, after which the experiment was terminated. Injection of 1 × 10⁶ HPCLSKs did not induce long-term survival but significantly prolonged the lifespan of lethally irradiated animals (median survival: 51 days compared with 8.5 days) (supplemental Figure 2B-C).
To analyze the influence of a high passage number and cryopreservation on the self-renewal capacity of HPCLSKs, we performed serial replating experiments. Untransformed HPCLSK cell lines after cryopreservation and with a passage number of 70 to 100 have been seeded in semisolid methylcellulose media with cytokines and replated for 3 rounds (supplemental Figure 2D). Even after the third round, the number of colonies is not reduced, and their immature status analyzed by LSK staining stays comparable to the BM control (supplemental Figure 2D-F).
These experiments led us to conclude that HPCLSKs possess the ability for long-term replenishment of the hematopoietic system.
Generation of leukemic HPCLSKs as a model for LSCs
LSCs differ from the bulk of leukemic cells and possess the ability for self-renewal. To establish LSC models, we infected HPCLSKs with a retrovirus encoding for oncogenes either inducing myeloid (BCR/ABLp210, MLL-AF9, Flt3-ITD;NRasG12D) or lymphoid (BCR/ABLp185) leukemia (Figure 3A). Analysis of signaling pathways in the GFP+ leukemic lines showed that the cells faithfully reflected the signaling patterns downstream of the respective oncogene. As described, BCR/ABL predominantly induced phosphorylation of CRKL and STAT5.65,66 Flt3-ITD;NRasG12D was associated with a pronounced JAK2, STAT5, AKT, and ERK signaling activation67 and MLL-AF9 upregulated c-MYC68 (Figure 3B).

Successful generation of leukemic HPCLSKcell lines with various oncogenes. (A) Experimental design: HPCLSK cell lines were retrovirally transduced with different oncogenes. (B) Immunoblot showing increase of CRKL, FLT3, JAK2, STAT5, ERK, and AKT phosphorylation and upregulation of cABL, c-MYC, and p53 in transformed HPCLSK cells compared with untransformed (−) cells to the corresponding oncogenes. HSC70 serves as a loading control. Representative blot from at least 3 independent experiments is shown. (C) Flow cytometry analysis of untransformed and BCR/ABLp210 transformed HPCLSK cells in IMDM/SCF/IL-6 and SCF/IL-6 deprived medium (IMDM). After 1 month in culture, HPCLSK BCR/ABLp210 cells show reduced expression of stem cell markers (c-Kit, Sca-1) and differentiate into myeloid (CD11b, Gr-1), but not lymphoid (CD19, CD3) cells as indicated by the numbers in quadrants. The data are expressed as mean ± SD of 3 independent measurements. (D) Representative flow cytometry plots of LSK (upper), myeloid (middle), and lymphoid staining (lower) of MLL-AF9 (in the presence of SCF and IL-6), Flt3-ITD;NrasG12D, and BCR/ABLp185 transformed HPCLSK and pre-pro-B BCR/ABLp185 cell lines in the absence of SCF and IL-6.
Successful generation of leukemic HPCLSKcell lines with various oncogenes. (A) Experimental design: HPCLSK cell lines were retrovirally transduced with different oncogenes. (B) Immunoblot showing increase of CRKL, FLT3, JAK2, STAT5, ERK, and AKT phosphorylation and upregulation of cABL, c-MYC, and p53 in transformed HPCLSK cells compared with untransformed (−) cells to the corresponding oncogenes. HSC70 serves as a loading control. Representative blot from at least 3 independent experiments is shown. (C) Flow cytometry analysis of untransformed and BCR/ABLp210 transformed HPCLSK cells in IMDM/SCF/IL-6 and SCF/IL-6 deprived medium (IMDM). After 1 month in culture, HPCLSK BCR/ABLp210 cells show reduced expression of stem cell markers (c-Kit, Sca-1) and differentiate into myeloid (CD11b, Gr-1), but not lymphoid (CD19, CD3) cells as indicated by the numbers in quadrants. The data are expressed as mean ± SD of 3 independent measurements. (D) Representative flow cytometry plots of LSK (upper), myeloid (middle), and lymphoid staining (lower) of MLL-AF9 (in the presence of SCF and IL-6), Flt3-ITD;NrasG12D, and BCR/ABLp185 transformed HPCLSK and pre-pro-B BCR/ABLp185 cell lines in the absence of SCF and IL-6.
In the presence of SCF and IL-6, HPCLSK BCR/ABLp210 retained the expression of stem cell markers (Figure 3C). All transformed HPCLSK cell lines, except MLL/AF9, are able to grow without SCF. A small fraction of transformed HPCLSK cells differentiated and upregulated the respective lineage markers (Figure 3D). Except for MLL-AF9, all oncogenes tested formed growth factor–independent colonies in methylcellulose gel (supplemental Figure 3A).
To determine their leukemic potential in vivo, transformed HPCLSKs were injected IV into NSG and HPCLSKs BCR/ABLp185+ also in sublethally irradiated (4.5 Gy) C57BL/6N recipient mice (Figure 4A left; supplemental Figure 4A,F). HPCLSKs BCR/ABLp185 inflicted disease within 12 days in NSG and 15 days in sublethally irradiated mice, followed by NSG mice with HPCLSKs BCR/ABLp210 and HPCLSKs Flt3-ITD;NRasG12D, which succumbed to disease within 50 days. The longest disease latency was observed upon injection of HPCLSKs MLL-AF9, which induced disease after 3 months (Figure 4A right). All diseased animals displayed elevated WBC counts and blastlike cells in the blood and suffered from splenomegaly (Figure 4B,D; supplemental Figure 4B,G-H). GFP+-transformed HPCLSK cells were detected in the blood, spleen, and BM of the diseased mice (Figure 4C; supplemental Figure 4I). HPCLSKs BCR/ABLp210, HPCLSKs MLL-AF9, and HPCLSKs FLT3/NRasG12D-injected NSGs suffered from myeloid leukemia with an average of 92% CD11b+ cells, whereas HPCLSKs BCR/ABLp185-injected C57BL/6N developed predominantly GFP+ B cells with a percentage mean of 51% of CD19+ cells (Figure 4E; supplemental Figure 4C-E,J). These experiments determine HPCLSK cells as a valid model system studying leukemogenesis in vivo downstream of several oncogenic drivers.

In vivo lymphoid and myeloid leukemia model. (A) Left: Schematic representation of the experimental setup. Oncogene-expressing HPCLSK cell lines were injected IV in NSG recipients, and moribund mice were analyzed. Healthy HPCLSK injected animals were sacrificed and examined after 150 days. Right: Disease-free survival following IV injection of 2 × 10⁶ HPCLSK BCR/ABLp210 (n = 9), or 5 × 10⁶ HPCLSK MLL-AF9 (n = 7), HPCLSK Flt3-ITD;NRasG12D (n = 5), and HPCLSK BCR/ABLp185 (n = 9) cells compared with injection of 5 × 10⁶ untransformed HPCLSK cells (n = 5). (B) WBC count of moribund mice, 1-way analysis of variance (Kruskal-Wallis test) with Dunn's multiple comparison test, *P <.05. Data are presented as mean ± SEM. (C) Detection of transformed GFP+ HPCLSK cells (with the respective oncogene) in blood, spleen, and BM of diseased NSG recipients. Data represent mean ± SD in 4 to 8 mice per group. (D) Top: Representative blood smears from transformed HPCLSK-injected mice show leukocytosis with circulating blasts (hematoxylin-eosin, original magnification ×400). Bottom: Macroscopic view of representative spleens from transformed HPCLSK-injected recipient mice compared with untransformed HPCLSK-injected mice, n ≥ 5. Scale bar, 1 cm. (E) Left: Quantification of transformed GFP+ LSKs and differentiated cells (CD19+ B cells and CD11b+ myeloid cells) by flow cytometry in spleens of diseased NSG recipient mice. Error bars represent the mean ± SD, n = 4 to 8 per oncogene. Right: Representative flow cytometry plots for myeloid (CD11b and Gr-1) and lymphoid (CD19 and CD3 or B220) cells of spleens of the diseased mice injected with different oncogene-expressing HPCLSKs.
In vivo lymphoid and myeloid leukemia model. (A) Left: Schematic representation of the experimental setup. Oncogene-expressing HPCLSK cell lines were injected IV in NSG recipients, and moribund mice were analyzed. Healthy HPCLSK injected animals were sacrificed and examined after 150 days. Right: Disease-free survival following IV injection of 2 × 10⁶ HPCLSK BCR/ABLp210 (n = 9), or 5 × 10⁶ HPCLSK MLL-AF9 (n = 7), HPCLSK Flt3-ITD;NRasG12D (n = 5), and HPCLSK BCR/ABLp185 (n = 9) cells compared with injection of 5 × 10⁶ untransformed HPCLSK cells (n = 5). (B) WBC count of moribund mice, 1-way analysis of variance (Kruskal-Wallis test) with Dunn's multiple comparison test, *P <.05. Data are presented as mean ± SEM. (C) Detection of transformed GFP+ HPCLSK cells (with the respective oncogene) in blood, spleen, and BM of diseased NSG recipients. Data represent mean ± SD in 4 to 8 mice per group. (D) Top: Representative blood smears from transformed HPCLSK-injected mice show leukocytosis with circulating blasts (hematoxylin-eosin, original magnification ×400). Bottom: Macroscopic view of representative spleens from transformed HPCLSK-injected recipient mice compared with untransformed HPCLSK-injected mice, n ≥ 5. Scale bar, 1 cm. (E) Left: Quantification of transformed GFP+ LSKs and differentiated cells (CD19+ B cells and CD11b+ myeloid cells) by flow cytometry in spleens of diseased NSG recipient mice. Error bars represent the mean ± SD, n = 4 to 8 per oncogene. Right: Representative flow cytometry plots for myeloid (CD11b and Gr-1) and lymphoid (CD19 and CD3 or B220) cells of spleens of the diseased mice injected with different oncogene-expressing HPCLSKs.
HPCLSKs from a transgenic mouse strain HPCLSKsCdk6−/−
CDK6 plays a key role as a transcriptional regulator for HSC activation, and its function extends to LSCs.53 To gain insights into distinct functions of CDK6 in HSCs/LSCs, we generated HPCLSK cell lines from Cdk6−/− transgenic mice.69 CDK4 does not compensate for the loss of CDK6 in those lines (supplemental Figure 5A). HPCLSKsCdk6−/− grow under normal HPCLSK culture conditions albeit with a reduced cell proliferation and slightly increased apoptosis when compared with wild-type HPCLSKs (Figure 5A; supplemental Figure 5B). An amount of 5 × 10⁶ HPCLSKsCdk6+/+ or Cdk6−/− were capable equally well to rescue lethally irradiated mice for up to 40 days (supplemental Figure 5C). In a murine CML model, BCR/ABLp210Cdk6−/− BM cells induced disease significantly slower and with a drastically reduced disease phenotype.53 To investigate whether this phenotype can be recapitulated with HPCLSKs, we generated HPCLSKs BCR/ABLp210Cdk6+/+ and Cdk6−/− by retroviral infection. Irrespective of the presence of CDK6, HPCLSK BCR/ABLp210 cells grow in the absence of any cytokine and retain the expression of LSK markers (supplemental Figure 5D). In line with murine CML models, HPCLSKs BCR/ABLp210Cdk6−/− form fewer growth factor–independent colonies when compared with Cdk6+/+ controls 7 days after plating, yet the difference did not reach significance (Figure 5B).53 HPCLSK BCR/ABLp210-derived colonies displayed Gr-1 and CD11b marker expression. However, HPCLSKs BCR-ABLp210Cdk6−/− show a trend to higher Gr-1 and lower CD11b expression compared with wild type (supplemental Figure 5E). To study the leukemic potential of HPCLSKs BCR/ABLp210Cdk6−/− in vivo, we injected 1 × 10⁶ cells IV into NSG mice. HPCLSKs BCR/ABLp210Cdk6+/+ inflict disease within 14 days with severe signs of leukemia, including splenomegaly (Figure 5C; supplemental Figure 5F). In contrast, HPCLSKs BCR/ABLp210Cdk6−/− failed to induce disease within this period, and only two-thirds of the mice started to show signs of disease ∼80 days after injection, whereas one-third of the animals did not develop any sign of leukemia within 7 months. Analysis of diseased mice shows a reduced infiltration of HPCLSKs BCR/ABLp210Cdk6−/− into the BM and spleen, and the percentage of BCR/ABLp210 GFP+ cells in the blood is comparable to Cdk6+/+ control cells (Figure 5D; supplemental Figure 5G). These results underline the crucial role of CDK6 in BCR/ABLp210 LSCs and verify the potential of our novel cellular HPCLSK system to charter leukemic phenotypes.
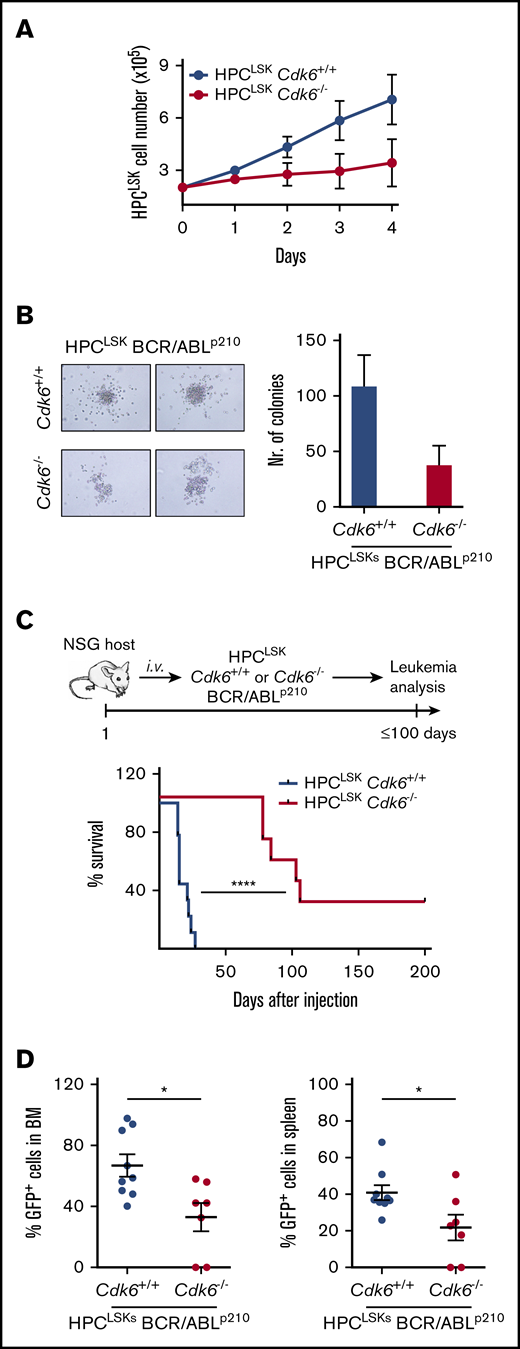
Generation of HPCLSKcell lines from Cdk6−/−mice. (A) Cell proliferation curve of HPCLSKCdk6+/+ and Cdk6−/− cell lines. Data are presented as mean ± SEM of 3 different cell lines per genotype. (B) Colony formation assay of HPCLSKs BCR/ABLp210Cdk6+/+ and Cdk6−/−. Representative macroscopic images of colonies formed within 7 days in semisolid methylcellulose gels without cytokines are depicted. Data are presented as mean ± SEM of 2 independent experiments with 2 to 3 different cell lines per genotype. (C) Top: Schematic representation of the experimental setup; bottom: HPCLSKs BCR/ABLp210Cdk6+/+ and Cdk6−/− have been injected IV in NSG recipient mice. Disease-free survival following IV injection of 1 × 10⁶ HPCLSKs BCR/ABLp210Cdk6+/+ (n = 9, 3 different cell lines per genotype) and Cdk6−/− (n = 7, 3 different cell lines per genotype). Statistical differences were calculated using the log-rank test (****P < .0001). (D) Quantification of BCR/ABLp210 GFP+ cells by flow cytometry in BM and spleen of diseased NSG recipient mice. Error bars represent mean ± SEM (n = 7 to 9 per group, 3 different cell lines; *P <.05 by Student t test).
Generation of HPCLSKcell lines from Cdk6−/−mice. (A) Cell proliferation curve of HPCLSKCdk6+/+ and Cdk6−/− cell lines. Data are presented as mean ± SEM of 3 different cell lines per genotype. (B) Colony formation assay of HPCLSKs BCR/ABLp210Cdk6+/+ and Cdk6−/−. Representative macroscopic images of colonies formed within 7 days in semisolid methylcellulose gels without cytokines are depicted. Data are presented as mean ± SEM of 2 independent experiments with 2 to 3 different cell lines per genotype. (C) Top: Schematic representation of the experimental setup; bottom: HPCLSKs BCR/ABLp210Cdk6+/+ and Cdk6−/− have been injected IV in NSG recipient mice. Disease-free survival following IV injection of 1 × 10⁶ HPCLSKs BCR/ABLp210Cdk6+/+ (n = 9, 3 different cell lines per genotype) and Cdk6−/− (n = 7, 3 different cell lines per genotype). Statistical differences were calculated using the log-rank test (****P < .0001). (D) Quantification of BCR/ABLp210 GFP+ cells by flow cytometry in BM and spleen of diseased NSG recipient mice. Error bars represent mean ± SEM (n = 7 to 9 per group, 3 different cell lines; *P <.05 by Student t test).
CDK6-dependent transcript alterations
To study CDK6-dependent gene regulation in untransformed and BCR/ABLp210 transformed HPCLSKs, we performed RNA-Seq analysis. Untransformed HPCLSKs lacking CDK6 show an altered gene regulation with 1335 genes upregulated and 661 genes downregulated when compared with HPCLSKsCdk6+/+ (Figure 6A). These differences decreased upon transformation; cytokine-independent HPCLSKs BCR/ABLp210 showed 85 upregulated and 468 genes downregulated in the absence of CDK6 compared with controls. Overall, 80% and 40% of genes found to be upregulated or downregulated in HPCLSK BCR/ABLp210Cdk6−/− cells were also deregulated in Cdk6−/− untransformed HPCLSK cells, defining a transformation-independent gene signature downstream of CDK6 (Figure 6B). Gene ontology (GO) enrichment analyses of CDK6-dependent genes revealed an association with immune response, cell adhesion, cell death, and myeloid cell differentiation irrespective of the transformation status (Figure 6C). The differential gene expression in our murine HPCLSK BCR/ABLp210 cells was compared with CDK6-associated gene expression changes in human CML samples. To do so, we stratified a dataset from 76 human CML patients into CDK6high and CDK6low samples based on quartile expression of CDK6 and subsequently calculated the differential gene expression. We identified 101 genes that are regulated in a CDK6-dependent manner in murine and human BCR/ABLp210 cells (Figure 6D). In human and mouse, CDK6-dependent deregulated genes belong to pathways pointing at apoptosis/stress response, cell differentiation, and homing.

CDK6-dependent transcriptomic alterations. (A) Volcano plots summarizing CDK6-mediated differential gene expression between untransformed (left) and BCR/ABLp210 (right) HPCLSKs. Each dot represents a unique gene; red dots indicate statistically significant deregulated genes (FDR < 0.05 and FC ± 1.5). FC, fold change; FDR, false discovery rate. (B) Venn diagrams showing overlaps between upregulated genes (upper) or downregulated genes (lower) in untransformed HPCLSKsCdk6−/− and Cdk6−/− BCR/ABLp210 HPCLSKs compared with controls. (C) GO enrichment analyses of CDK6 regulated genes in untransformed (left) and BCR/ABLp210 (middle) HPCLSKs and of commonly CDK6 regulated genes in these cell types (right). (D) Heatmaps summarizing expression of 101 genes, which are commonly regulated in a CDK6-dependent manner in murine and human BCR/ABLp210 cells. Each row represents a unique gene, and each column represents a unique sample. Colors range from blue (low expression) to red (high expression). Results from GO enrichment analyses of these genes are shown in the bar chart (right). diff., differentiation; neg., negative; pos., positive; reg., regulation.
CDK6-dependent transcriptomic alterations. (A) Volcano plots summarizing CDK6-mediated differential gene expression between untransformed (left) and BCR/ABLp210 (right) HPCLSKs. Each dot represents a unique gene; red dots indicate statistically significant deregulated genes (FDR < 0.05 and FC ± 1.5). FC, fold change; FDR, false discovery rate. (B) Venn diagrams showing overlaps between upregulated genes (upper) or downregulated genes (lower) in untransformed HPCLSKsCdk6−/− and Cdk6−/− BCR/ABLp210 HPCLSKs compared with controls. (C) GO enrichment analyses of CDK6 regulated genes in untransformed (left) and BCR/ABLp210 (middle) HPCLSKs and of commonly CDK6 regulated genes in these cell types (right). (D) Heatmaps summarizing expression of 101 genes, which are commonly regulated in a CDK6-dependent manner in murine and human BCR/ABLp210 cells. Each row represents a unique gene, and each column represents a unique sample. Colors range from blue (low expression) to red (high expression). Results from GO enrichment analyses of these genes are shown in the bar chart (right). diff., differentiation; neg., negative; pos., positive; reg., regulation.
Validation of CDK6 dependent pathways in LSCs
In line with the deregulated pathways in human and mouse resulting from the RNA-Seq analysis, we recently demonstrated that CDK6 regulates apoptosis during BCR/ABLp185 transformation.60 To validate this aspect in our HPCLSK system, we serum-starved HPCLSKs BCR/ABLp210Cdk6+/+ and Cdk6−/− for 90 minutes and performed an apoptosis staining by flow cytometry (Figure 7A). As expected, HPCLSKs BCR/ABLp210Cdk6−/− showed increased response to stress. In addition to apoptosis, cell differentiation was one of the most significant deregulated pathways detected by the transcriptome analysis. Colonies from HPCLSKs BCR/ABLp210Cdk6−/− showed a bias to the granulocytic direction by increased Gr-1 expression (supplemental Figure 5E). In the RNA-Seq analysis and validated by quantitative polymerase chain reaction (qPCR), Csf3r, an essential receptor for granulocytic differentiation, is upregulated in HPCLSK BCR/ABLp210Cdk6−/− cells compared with controls (Figure 7B). Furthermore, cytokine-independent HPCLSKs BCR/ABLp210Cdk6−/− show increased MFI levels of Gr-1 and reduced MFI levels of CD11b compared with Cdk6+/+ controls (Figure 7C). Together, these data demonstrate that loss of CDK6 shows an advantage for granulocytic differentiation.

CDK6 is required for homing to the BM of HPCLSKBCR/ABLp210cells. (A) Sytox staining for apoptotic cells of HPCLSK BCR/ABLp210 cells starved for 90 minutes in 0.5% fetal calf serum medium. Numbers represent mean ± SD (n = 3 different cell lines per genotype; *P < .05 by Student t test). (B) qPCR validation of RNA-Seq data of the target gene Csf3r (mean ± SEM; n = 3 different cell lines per genotype; *P < .05 by Student t test). (C) Mean fluorescence intensity (MFI) of myeloid markers (CD11b, Gr-1) of BCR/ABLp210 HPCLSKs (mean ± SEM; n = 3 different cell lines per genotype; *P <.05 by Student t test). (D) Validation of selected genes (Pik3r6, Gp1ba, Fzd6, Mmp2) found deregulated in GO analysis of the RNA-Seq experiment by qPCR and nested qPCR (mean ± SEM; n = 3 different cell lines per genotype; *P < .05 by Student t test). (E) Left: Experimental scheme of HPCLSKs BCR/ABLp210 homing assay in wild-type recipient mice. Right: Percentage HPCLSKs BCR/ABLp210 cells in spleen and BM detected by flow cytometry is shown (mean ± SEM; n = 4 to 7 per group, 2 to 3 independent cell lines, *P < .05 by Student t test). wt, wild type.
CDK6 is required for homing to the BM of HPCLSKBCR/ABLp210cells. (A) Sytox staining for apoptotic cells of HPCLSK BCR/ABLp210 cells starved for 90 minutes in 0.5% fetal calf serum medium. Numbers represent mean ± SD (n = 3 different cell lines per genotype; *P < .05 by Student t test). (B) qPCR validation of RNA-Seq data of the target gene Csf3r (mean ± SEM; n = 3 different cell lines per genotype; *P < .05 by Student t test). (C) Mean fluorescence intensity (MFI) of myeloid markers (CD11b, Gr-1) of BCR/ABLp210 HPCLSKs (mean ± SEM; n = 3 different cell lines per genotype; *P <.05 by Student t test). (D) Validation of selected genes (Pik3r6, Gp1ba, Fzd6, Mmp2) found deregulated in GO analysis of the RNA-Seq experiment by qPCR and nested qPCR (mean ± SEM; n = 3 different cell lines per genotype; *P < .05 by Student t test). (E) Left: Experimental scheme of HPCLSKs BCR/ABLp210 homing assay in wild-type recipient mice. Right: Percentage HPCLSKs BCR/ABLp210 cells in spleen and BM detected by flow cytometry is shown (mean ± SEM; n = 4 to 7 per group, 2 to 3 independent cell lines, *P < .05 by Student t test). wt, wild type.
Finally, the reduced percentages of HPCLSKs BCR/ABLp210Cdk6−/− in the BM and spleen upon IV injection (Figure 5D) together with the RNA-Seq analysis point toward a hampered homing capacity of HPCLSK BCR/ABLp210Cdk6−/− cells. We validated several deregulated genes found in the transcriptome analysis, which can be linked to homing by qPCR analysis (Figure 7D; supplemental Figure 6A) and performed an in vivo homing assay. Therefore, we injected 1 × 10⁶ HPCLSKs BCR/ABLp210 with and without CDK6 into aged- and sex-matched female C57BL/6N mice and profiled the number of BCR/ABLp210 GFP+ cells after 18 hours in the BM and spleen by flow cytometry. HPCLSKs BCR/ABLp210Cdk6−/− showed a significantly diminished homing capability to the BM compared with HPCLSKs BCR/ABLp210Cdk6+/+ (Figure 7E). In line with our previous publication,53 the homing capacity of untransformed HPCLSKsCdk6−/− is slightly but not significantly reduced compared with controls (supplemental Figure 6B-D).
Taken together, the validated data describe essential roles of CDK6 in LSCs and support the strong reliability of our murine cellular system. Moreover, we here describe a prominent function for CDK6 in regulating BCR/ABLp210 leukemic cell homing.
Discussion
Functional and molecular studies on hematopoietic stem cells and LSCs have provided numerous insights into the mechanisms of hematopoietic diseases. However, progress is restricted by the limited availability of hematopoietic stem/progenitor cells and the difficulty of in vitro culturing. We present a robust procedure to generate an unlimited source of functional mouse HSC/HPC lines called HPCLSK that possess characteristics of MPPs and can serve as a source of lymphoid and myeloid LSC lines. HPCLSKs are multipotent cells that retain lymphoid and myeloid differentiation potential and can repopulate lethally irradiated mice without supporter BM cells. More than 90% of HPCLSKs are Lin−/c-Kit+/Sca-1+ and express CD34, CD48, and CD150, which is characteristic of MPP2. The result of the transcriptome analysis and the fact that HPCLSK cells are able to replenish the hematopoietic system long term (followed up to 7 months) strongly argues that HPCLSK cells are functionally grouped to MPP1, which corresponds to the earliest proliferating stem/progenitor cell. As HPCLSKs represent a continuous proliferating cell line, it might explain why they also express CD48 SLAM (signaling lymphocyte activation molecule) marker on their cell surface. CD48 is expressed throughout all the short-term progenitors but is excluded from the long-term HSCs.11,70 Altogether, HPCLSK cells should be categorized as MPP1 with a slight bias toward MPP2 direction.
Our approach is robust and simple and requires no coculture system or feeder layer and no extensive amounts of cytokines. We have established >50 distinct HPCLSK cell lines with an efficiency of 100%, using either mouse strains of various genetic backgrounds or transgenic mice as a source. HPCLSK cells can be genetically modified by retroviral transduction or CrispR/Cas9 technologies, so are a versatile tool in HSC and LSC research.
Our method is based on the enforced expression of Lhx2, a transcription factor for mouse HPC immortalization.43,45-47,52 Improvements to the original protocol include fluorescence-activated cell sorting of LSKs to avoid 5-fluorouracil treatment, the use of serum low-media with a defined cocktail of cytokines, precoating of plates to avoid adherence-induced myeloid differentiation, and the maintenance of high HPCLSK cell density.4,45,46,71-73
Lhx2-immortalized HPCs have been reported to induce a transplantable myeloproliferative disorder resembling human chronic myeloid leukemia in long-term engrafted mice.74 We did not observe this even after long-term repopulation in lethally irradiated Ly5.1 or in immunosuppressed NSG mice. The difference probably stems from our use of sorted LSKs instead of total BM to overexpress Lhx2, as the myeloid disorder may originate from a more differentiated myeloid progenitor.
We have used HPCLSKs as a source to generate LSCs and obtained leukemic HPCLSK lines harboring BCR/ABL, MLL-AF9, and Flt3-ITD;NRasG12D oncogenes. Removal of SCF and IL-6 in vitro induced myeloid differentiation, indicating that the self-renewal program depends on the presence of low-level cytokines and downstream signaling events that are provided in vivo by the BM niche.
The cell-cycle kinase CDK6 is a transcriptional regulator and is particularly important in hematopoietic malignancies. In HSCs, its actions are largely independent of its kinase activity. It is essential for HSC activation in the most dormant stem cell population under stress situations, including transplantation and oncogenic stress. The impact of CDK6 extends to LSCs, as BCR/ABLp210 transformed BM cells fail to induce disease in vivo in the absence of CDK6. To investigate how CDK6 drives leukemogenesis in progenitor cells, we generated HPCLSKsCdk6−/− from Cdk6-deficient mice and transformed them with BCR/ABLp210. The absence of CDK6 was associated with a reduced incidence of leukemia and with significantly delayed disease development, thereby mimicking the effects seen in primary BM transplantation assays.53 RNA-Seq and subsequent pathway analysis show deregulated stress response, cell adhesion, and apoptotic processes/cell death in the absence of CDK6. This result is consistent with our recent observations that CDK6 antagonizes p53 responses and regulates survival. In the absence of CDK6, hematopoietic cells need to overcome oncogenic-induced stress by mutating p53 or activating alternative survival pathways, as in the case of CDK6-deficient JAK2V617F-positive LSKs.59,60 Another feature shared by CDK6-deficient JAK2V617F+ LSKs and CDK6-deficient HPCLSK BCR/ABL is an altered cytokine secretion, as revealed by pathway enrichment analysis in both systems.59
HSCs show homing and cell adhesion, which allow them to migrate to the BM and replenish hematopoietic lineages.75 GO pathway analysis revealed deregulated cell adhesion and cell migration pathways in HPCLSK cell lines and in human patient samples. Our bioinformatic data show that loss of CDK6 from transformed cells leads to a significantly reduced capacity to home to the BM, which slows the onset of leukemic disease. The common CDK6-dependent gene signature between HPCLSKs BCR/ABLp210 and human CML patient samples underlines the translational relevance of our model system. A large subset of CDK6-regulated genes is also found in patients, which we could validate with specific assays using our HPCLSKs BCR/ABLp210. The data strengthen our confidence in our murine cellular system and show that results from HPCLSK experiments can be translated to the human situation. HPCLSK lines thus represent a quick and simple alternative to the lymphoid progenitor Ba/F3 or the myeloblast-like 32D cells to explore the potential transforming ability of mutations found in hematopoietic malignancies.
Raw and processed data were submitted to the Gene Expression Omnibus database (accession number GSE154464).
Acknowledgments
The authors thank P. Kudweis, S. Fajmann, M. Ensfelder-Koparek, and P. Jodl for excellent technical support and M. Dolezal for critical discussion of bioinformatical analysis. The schematic art pieces used in the visual abstract were provided by SMART (Servier Medical Art, licensed under a Creative Common Attribution 3.0 Generic License; http://servier.com).
This work was supported by the European Research Council under the European Union's Horizon 2020 research and innovation programme grant agreement no. 694354 and by the Austrian Science Foundation via grant P 31773 (K.K.).
Authorship
Contribution: E.D. and I.M.M. designed and conducted experiments and collected and analyzed data; T.B., B.M., and I.M. collected and analyzed data; R.G., M.Z., and G.H. performed bioinformatical analysis; L.C. was involved in conception and design of the study, contributed essential material, and reviewed the manuscript; K.K. designed and supervised experiments; A.H.-K. reviewed the manuscript and supervised experiments; V.S. designed and supervised the study; and V.S., E.D., I.M.M., and K.K. wrote the manuscript.
Conflict-of-interest disclosure: The authors declare no competing financial interests.
Correspondence: Veronika Sexl, Department of Biomedical Sciences, Institute of Pharmacology and Toxicology, University of Veterinary Medicine Vienna, Veterinaerplatz 1, A-1210 Vienna, Austria; e-mail: veronika.sexl@vetmeduni.ac.at.

