

Key Points
Tryptophan metabolism is abnormal in patients with FA after bone marrow transplant, resulting in surges in serotonin.
Hyperserotonemia may contribute to metabolic dysfunction and morbidity in FA and indicate alterations in platelet function.

Abstract
Fanconi anemia (FA) is a complex genetic disorder associated with progressive marrow failure and a strong predisposition to malignancy. FA is associated with metabolic disturbances such as short stature, insulin resistance, thyroid dysfunction, abnormal body mass index (BMI), and dyslipidemia. We studied tryptophan metabolism in FA by examining tryptophan and its metabolites before and during the stress of hematopoietic stem cell transplant (HSCT). Tryptophan is an essential amino acid that can be converted to serotonin and kynurenine. We report here that serotonin levels are markedly elevated 14 days after HSCT in individuals with FA, in contrast to individuals without FA. Kynurenine levels are significantly reduced in individuals with FA compared with individuals without FA, before and after HSCT. Most peripheral serotonin is made in the bowel. However, serotonin levels in stool decreased in individuals with FA after transplant, similar to individuals without FA. Instead, we detected serotonin production in the skin in individuals with FA, whereas none was seen in individuals without FA. As expected, serotonin and transforming growth factor β (TGF-β) levels were closely correlated with platelet count before and after HSCT in persons without FA. In FA, neither baseline serotonin nor TGF-B correlated with baseline platelet count (host-derived platelets), only TGF-B correlated 14 days after transplant (blood bank-derived platelets). BMI was negatively correlated with serotonin in individuals with FA, suggesting that hyperserotonemia may contribute to growth failure in FA. Serotonin is a potential therapeutic target, and currently available drugs might be beneficial in restoring metabolic balance in individuals with FA.
Introduction
Fanconi anemia (FA) is a complex genetic disorder frequently associated with progressive marrow failure and a strong predisposition to early malignancies, particularly squamous cell carcinomas and hepatocellular carcinomas. The FA phenotype also includes metabolic disturbances such as abnormal body mass index (BMI), dyslipidemia, short stature, insulin resistance, and thyroid dysfunction. Metabolic aspects of the clinical phenotype are poorly explained by the defective DNA repair genes associated with the disease.
Tryptophan is an essential amino acid necessary for protein synthesis. Tryptophan metabolism has been closely linked to alterations in the microbiome, and dysregulation of the tryptophan pathway has significant implications for host immune regulation, gut inflammation, and overall health.1-4 Tryptophan is metabolized into multiple biologically active molecules, including serotonin and kynurenine, which have widespread systemic activity (Figure 1).1,4-10 Serotonin is a biogenic monoamine that exists in 2 distinct compartments in the body: within the central nervous system (CNS) and outside of the CNS in the periphery. Perhaps the best known biological function of serotonin is its role as a neurotransmitter.11-13 However, the vast majority of serotonin in the body exists outside of the CNS.14-17 More than 90% of total serotonin is produced by enterochromaffin cells in the gastrointestinal tract and remains in the periphery.1,7,18-22 Peripheral serotonin is involved in a diverse range of processes, including regulation of metabolism, lipolysis, gluconeogenesis, insulin responsiveness, and thyroid function.7,17,22-25
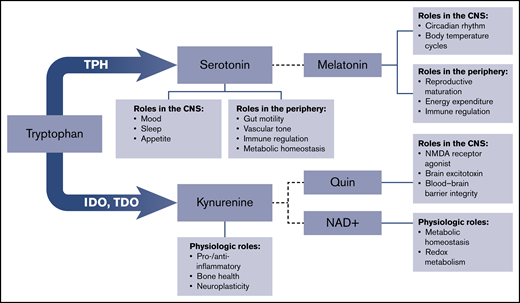
Schematic of tryptophan metabolism. Tryptophan metabolism to kynurenine is catalyzed by indolamine 2,3-dioxygenase (IDO) and tryptophan 2,3-dioxygenase (TDO). Additional enzymes downstream produce melatonin, quinolinic acid (Quin), and nicotinamide adenine dinucleotide (NAD+). NMDA, N-methyl-d-aspartate.
Schematic of tryptophan metabolism. Tryptophan metabolism to kynurenine is catalyzed by indolamine 2,3-dioxygenase (IDO) and tryptophan 2,3-dioxygenase (TDO). Additional enzymes downstream produce melatonin, quinolinic acid (Quin), and nicotinamide adenine dinucleotide (NAD+). NMDA, N-methyl-d-aspartate.
An exploration of tryptophan metabolism in individuals undergoing the stress of hematopoietic stem cell transplant (HSCT) identified alterations in tryptophan and serotonin metabolism specific to persons with FA. Alterations in tryptophan metabolism may contribute to the poorly understood metabolic abnormalities associated with the FA phenotype. Short stature and low body weight, often refractory to attempts to increase weight with optimized nutrition, are important causes of increased morbidity and decreased quality of life in individuals with FA.26,27 Moreover, a proportion of patients with FA have an elevated BMI.28,29 Our findings identify candidate therapeutic targets that may normalize metabolism, improve growth, and potentially reduce the risk of cancer in persons with FA.
Methods
Specimens
Blood and stool samples were collected and stored in the Cincinnati Children’s Hospital Medical Center biological sample repository after informed consent was obtained. Sample collection, storage, and use were approved by the institutional review board of Cincinnati Children’s Hospital Medical Center.
Patient demographic characteristics
Patient demographic characteristics are summarized in Table 1.
Patient cohort demographic characteristics
| FA | Other diagnoses | ||
|---|---|---|---|
| Total, n | 23 | 29 | |
| Sex | |||
| Male | 11 (48%) | 20 (69%) | |
| Female | 12 (52%) | 9 (31%) | |
| Age, y | |||
| Range | 5-27 | 1-18 | |
| Median | 7 | 6 | |
| Preparative regimen, n | Bu/Cy/ATG (2), Bu/Cy/Flu/ATG (21) | Bu/Cy (1), Bu/Cy/ATG (5), Bu/Flu (2), Bu/Flu/ATG (1), Bu/Flu/Cam (2), Bu/Thio/Flu (2), Cam/Flu/Mel (10), Cy/ATG (2), Cy + TBI (3), Flu/Mel (1) | |
| Stem cell source | Bone marrow, 1 (4%); PBSCs, 22 (96%) | Bone marrow, 24 (83%); cord blood, 2 (7%); PBSCs, 3 (10%) | |
| Stem cell donor type | Related, 2 (9%); unrelated, 21 (91%) | Related, 12 (34%); unrelated, 17 (49%) | |
| GVHD prophylaxis | Calcineurin inhibitor, 5 (22%); T cell–depleted graft alone, 18 (78%) | Calcineurin inhibitor, 29 (100%) | |
| Additional information, (n) | Complementation groups represented (n): A (6), B (1), C (6), E (2), G (1), I (1), J (1), O (1), normal FISH/unknown (4) | Diagnoses represented (n): AA (5), ALL (2), AML (4), β-thalassemia (3), CGD (1), DBA (1), sickle cell disease (5), HLH (2), Hurler’s disease (1), pancytopenia (1), SCID (1), TCLL (1), WAS (2) | |
AA, aplastic anemia; ALL, acute lymphocytic leukemia; AML, acute myelogenous leukemia; ATG, anti-thymocyte globulin; Bu, busulfan; Cam, Campath (alemtuzumab); CGD, chronic granulomatous disease; Cy, cyclophosphamide; DBA, Diamond-Blackfan anemia; FISH, fluorescence in situ hybridization; Flu, fludarabine; GVHD, graft-versus-host disease; HLH, hemophagocytic lymphoproliferative histiocytosis; Mel, melphalan; SCID, severe combined immunodeficiency; TBI, total body irradiation; TCLL, T-cell leukemia; Thio, thiotepa; WAS, Wiskott-Aldrich syndrome.
Measurement of tryptophan and metabolites
Plasma levels of tryptophan and metabolites were measured by using an enzyme-linked immunosorbent assay according to manufacturer’s instructions and diluted as follows: tryptophan (KA1916; Abnova), 1:2 dilution; serotonin (ADI-900-175; Enzo), 1:16; melatonin (150-0001; Enzo), 1:2; kynurenine (E01K0010; BlueGene Biotech), 1:2; and transforming growth factor β1 (TGF-β1) (DB100B; R&D Systems), 1:40.
Measurement of expression of indoleamine 2,3-dioxygenase, tryptophan hydroxylase 1, and serotonin transporter by RT-qPCR
Total RNA was isolated from peripheral blood mononuclear cells (PBMCs) by using RNeasy Mini Kit (Qiagen, 74104) and first-strand complementary DNA synthesis performed by using SuperScript III Reverse Transcriptase (18080-093; Invitrogen) according to manufacturers’ guidelines. Quantitative reverse transcription polymerase chain reaction (RT-qPCR) was performed by using the TaqMan Gene Expression Assay platform with the following primer sets and master mix: tryptophan hydroxylase 1 (TPH1) (Hs00188220_m1; Thermo Fisher Scientific); indoleamine 2,3-dioxygenase (IDO1) (Hs00984148_m1; Thermo Fisher Scientific); SerT (SLC64A) (Hs00984349_m1; Thermo Fisher Scientific); Euk 18s ribosomal RNA endogenous control (4319413E; Thermo Fisher Scientific); and TaqMan Universal PCR Master Mix, No AmpErase UNG (4324018; Thermo Fisher Scientific). A 50-µL reaction was performed by using 2 µg complementary DNA according to manufacturer’s guidelines in MicroAmp Optical 96-well reaction plates (N8010560; Applied Biosystems) on an Applied Biosystems 7300 Real-Time PCR System.
Immunohistochemistry
Samples of formalin-fixed paraffin-embedded skin biopsies were sectioned at 4.5 µm onto positive charged slides and baked at 60°C for 30 minutes. Slides were stained with serotonin (11161; Progen) at 1:200 using Protease 1 (Roche) as enzyme pretreatment. Slides were stained by using the Ventana BenchMark ULTRA platform (Roche). Micrographs were obtained with an Olympus BX53 microscope (Olympus America), using Olympus plan 40× lens, 0.65 aperture. Images were captured by using an Olympus UC90 camera (Olympus America,), uploaded to CellSens software (Olympus America).
Nuclear magnetic resonance
Plasma samples were thawed on ice before data collection. Once thawed, 400 μL of plasma were filtered at 12 000gn for 60 to 90 minutes at 4°C by using prewashed 3 kDa spin filters (Nanosep 3K; Pall Life Sciences). Nuclear magnetic resonance (NMR) sample was prepared, mixing 200 µL of plasma filtrate with 400 µL of NMR buffer (100 mM phosphate buffer in deuterium oxide, pH 7.3, and 1.0 mM 3-trimethylsilyl 2,2,3,3-d4 propionate). Next, 550 μL samples in 103.5 mm × 5 mm NMR tubes (Bruker) were used. One-dimensional 1H NMR spectra were acquired on a Bruker Avance III 600 MHz spectrometer. Data were collected at a calibrated temperature of 298 K using a noesygppr1d pulse sequence in the Bruker pulse sequence library. Experiments were run with 8 dummy scans and 256 acquisition scans with an acquisition time (AQ) of 3.41 seconds, a relaxation delay (D1) of 3.0 seconds for a total repetition cycle (AQ + D1) of 5.7 seconds, and with a mixing time (D8) of 10 milliseconds. For a representative sample, 2-dimensional 11HH total correlation spectroscopy data and 1H-13C heteronuclear single quantum coherence data were collected for assignment of metabolites. Metabolites found in plasma were assigned based on one-dimensional 1H, two-dimensional total correlation spectroscopy, and heteronuclear single quantum coherence NMR experiments. Peaks were assigned by comparing the chemical shifts and spin–spin couplings with reference spectra found in databases such as the Human Metabolome Database, the Biological Magnetic Resonance Data Bank, and Chenomx NMR Suite profiling software (Chenomx Inc. version 8.1).
Statistical analysis
Continuous data were summarized according to their median values. Differences between continuous outcomes between groups were compared by using the Wilcoxon rank sum test, and differences between time points within the same set of patients were compared by using the Wilcoxon signed-rank test. Correlation was calculated by using the Spearman method.
Results
Altered tryptophan metabolism after HSCT
Our previous metabolomics studies exploring the relationship between microbiome diversity, gastrointestinal dysbiosis, and HSCT showed that tryptophan levels increased significantly after HSCT, both in urine and stool, prompting further exploration of tryptophan metabolism during bone marrow transplant.30 We measured tryptophan levels in serum samples from pediatric patients in a separate, larger cohort of individuals who underwent HSCT; their characteristics are described in Table 1. Verifying our previous results, serum tryptophan increased from baseline (before the start of the HSCT conditioning regimen) to day 14 posttransplant (Figure 2A), an observation that was not dependent on diagnosis (Figure 2B). We next measured serotonin, a metabolite of tryptophan (Figure 1), in the serum of the same larger patient cohort and similarly found a significant change in serotonin from baseline to day 14 (Figure 2C). Normal serum serotonin values range between 50 and 220 ng/mL. A risk factor evaluation of the cohort for variables associated with serotonin revealed that serum serotonin increased markedly after HSCT but only in patients with FA (Figure 2D), whereas patients with other diagnoses exhibited a reduction in serum serotonin from baseline to day 14. These findings were further investigated by measuring serum serotonin values later posttransplant (ie, at day 42). Although serum serotonin values in patients with FA were beginning to gradually decrease, they remained markedly elevated compared with patients with other diagnoses, whose serum serotonin was unchanged compared with day 14 (Figure 2E).
![Serum tryptophan and serum serotonin during bone marrow transplant. Note the logarithmic scales. (A) Tryptophan levels in the serum of pediatric patients undergoing bone marrow transplant (BMT) increased from baseline to day 14 posttransplant (11.87 μg/mL [10.36-16.35] vs 14.74 μg/mL [10.69-20.40]; P = .012) when the cohort is pooled. Trendlines show the change during transplant for each individual patient. (B) Patients without FA exhibit increased serum tryptophan levels from baseline to day 14 posttransplant (10.98 μg/mL [8.71-15.01] vs 15.66 μg/mL [11.81-25.44]; P = .029), whereas patients with FA were stable (12.28 μg/mL [10.16-16.75] vs 17.73 μg/mL [12.37-25.35]; P = .061), with no difference between the 2 groups at either time point (baseline, 10.98 μg/mL vs 12.28 μg/mL [9.92-17.00], P = .37; day 14, 15.66 μg/mL vs 17.73 μg/mL [12.30-25.20], P = .27). (C) Serum serotonin increased significantly after HSCT when patients with and without FA are pooled (128.09 ng/mL [41.00-259.65] vs 212.27 ng/mL [64.10-1949.59]; P = .029). (D) Patients without FA exhibit a decrease in serum serotonin during transplant (187.95 ng/mL [58.75-342.95] vs 75.66 ng/mL [28.36-151.37]; P = .019), whereas patients with FA display a marked increase in serum serotonin during transplant (89.24 ng/mL [40.24-192.03] vs 2063.96 ng/mL [1143.87-3181.55]; P < .0001). Trendlines show the change during transplant for individual patients in each group. (E) Serum serotonin values were further evaluated at day 42, showing a gradual decrease in serotonin for patients with FA (1320 ng/mL [484.78-2653.79]; P = .024) compared with day 14, whereas patients with other diagnoses were unchanged (67.01 ng/mL [23.07-166.77]; P = .74). (F) Serum serotonin levels at day 14 in patients with other diagnoses (without FA) were similar to those without FA who also received CD34+-selected grafts, whereas patients with FA who all received CD34+-selected grafts were significantly higher at day 14 compared with non-FA CD34+-selected graft recipients (2063.96 ng/mL [1143.87-3181.55] vs 43.14 ng/mL [25.91-156.50]; P < .0001). (G) Serum serotonin is lower at baseline in patients with bone marrow failure (not FA) than in those with FA (8.58 ng/mL [2.93-23.25] vs 89.24 ng/mL [40.24-192.03]; P < .0001) and remains essentially unchanged in patients with bone marrow failure (not FA) after HSCT (8.58 ng/mL [2.93-23.25] vs 9.12 ng/mL [1.98-13.30]; P = .69).](https://ash.silverchair-cdn.com/ash/content_public/journal/bloodadvances/5/1/10.1182_bloodadvances.2020002794/2/m_advancesadv2020002794f2.png?Expires=1763501767&Signature=GEVaGJJjpqQEGioGFGOCrrxQ8VBMN4kF88kig657zGvB5X-g4bvl~WZwJ1CAKHBZ3QjDIQxe8jVEcSVzvVjRfxxodhuX5TGqh4LWXJwPxKc73MLqmIqymXAG0BSiE7aMasZI4hVT9~m4doXMny55bNYw5XgQa13bSdyjcTpGTQAudEejQZVELa~fW3oOPBUDDRkQjJY~qhPvewrqWhNmRD6-3x-Slantw8bzKZN2nbjPaBMX6ZzCULZiLasG8iAGAisIDHbftVrlfR-8iX9YC9Q~1JYPG3Ud54dZL9-k2IWlspBZzS~DER5~RDeLpRHPLVFzSX9DfgBkAvo9eYBXqg__&Key-Pair-Id=APKAIE5G5CRDK6RD3PGA)
Serum tryptophan and serum serotonin during bone marrow transplant. Note the logarithmic scales. (A) Tryptophan levels in the serum of pediatric patients undergoing bone marrow transplant (BMT) increased from baseline to day 14 posttransplant (11.87 μg/mL [10.36-16.35] vs 14.74 μg/mL [10.69-20.40]; P = .012) when the cohort is pooled. Trendlines show the change during transplant for each individual patient. (B) Patients without FA exhibit increased serum tryptophan levels from baseline to day 14 posttransplant (10.98 μg/mL [8.71-15.01] vs 15.66 μg/mL [11.81-25.44]; P = .029), whereas patients with FA were stable (12.28 μg/mL [10.16-16.75] vs 17.73 μg/mL [12.37-25.35]; P = .061), with no difference between the 2 groups at either time point (baseline, 10.98 μg/mL vs 12.28 μg/mL [9.92-17.00], P = .37; day 14, 15.66 μg/mL vs 17.73 μg/mL [12.30-25.20], P = .27). (C) Serum serotonin increased significantly after HSCT when patients with and without FA are pooled (128.09 ng/mL [41.00-259.65] vs 212.27 ng/mL [64.10-1949.59]; P = .029). (D) Patients without FA exhibit a decrease in serum serotonin during transplant (187.95 ng/mL [58.75-342.95] vs 75.66 ng/mL [28.36-151.37]; P = .019), whereas patients with FA display a marked increase in serum serotonin during transplant (89.24 ng/mL [40.24-192.03] vs 2063.96 ng/mL [1143.87-3181.55]; P < .0001). Trendlines show the change during transplant for individual patients in each group. (E) Serum serotonin values were further evaluated at day 42, showing a gradual decrease in serotonin for patients with FA (1320 ng/mL [484.78-2653.79]; P = .024) compared with day 14, whereas patients with other diagnoses were unchanged (67.01 ng/mL [23.07-166.77]; P = .74). (F) Serum serotonin levels at day 14 in patients with other diagnoses (without FA) were similar to those without FA who also received CD34+-selected grafts, whereas patients with FA who all received CD34+-selected grafts were significantly higher at day 14 compared with non-FA CD34+-selected graft recipients (2063.96 ng/mL [1143.87-3181.55] vs 43.14 ng/mL [25.91-156.50]; P < .0001). (G) Serum serotonin is lower at baseline in patients with bone marrow failure (not FA) than in those with FA (8.58 ng/mL [2.93-23.25] vs 89.24 ng/mL [40.24-192.03]; P < .0001) and remains essentially unchanged in patients with bone marrow failure (not FA) after HSCT (8.58 ng/mL [2.93-23.25] vs 9.12 ng/mL [1.98-13.30]; P = .69).
Serum tryptophan and serum serotonin during bone marrow transplant. Note the logarithmic scales. (A) Tryptophan levels in the serum of pediatric patients undergoing bone marrow transplant (BMT) increased from baseline to day 14 posttransplant (11.87 μg/mL [10.36-16.35] vs 14.74 μg/mL [10.69-20.40]; P = .012) when the cohort is pooled. Trendlines show the change during transplant for each individual patient. (B) Patients without FA exhibit increased serum tryptophan levels from baseline to day 14 posttransplant (10.98 μg/mL [8.71-15.01] vs 15.66 μg/mL [11.81-25.44]; P = .029), whereas patients with FA were stable (12.28 μg/mL [10.16-16.75] vs 17.73 μg/mL [12.37-25.35]; P = .061), with no difference between the 2 groups at either time point (baseline, 10.98 μg/mL vs 12.28 μg/mL [9.92-17.00], P = .37; day 14, 15.66 μg/mL vs 17.73 μg/mL [12.30-25.20], P = .27). (C) Serum serotonin increased significantly after HSCT when patients with and without FA are pooled (128.09 ng/mL [41.00-259.65] vs 212.27 ng/mL [64.10-1949.59]; P = .029). (D) Patients without FA exhibit a decrease in serum serotonin during transplant (187.95 ng/mL [58.75-342.95] vs 75.66 ng/mL [28.36-151.37]; P = .019), whereas patients with FA display a marked increase in serum serotonin during transplant (89.24 ng/mL [40.24-192.03] vs 2063.96 ng/mL [1143.87-3181.55]; P < .0001). Trendlines show the change during transplant for individual patients in each group. (E) Serum serotonin values were further evaluated at day 42, showing a gradual decrease in serotonin for patients with FA (1320 ng/mL [484.78-2653.79]; P = .024) compared with day 14, whereas patients with other diagnoses were unchanged (67.01 ng/mL [23.07-166.77]; P = .74). (F) Serum serotonin levels at day 14 in patients with other diagnoses (without FA) were similar to those without FA who also received CD34+-selected grafts, whereas patients with FA who all received CD34+-selected grafts were significantly higher at day 14 compared with non-FA CD34+-selected graft recipients (2063.96 ng/mL [1143.87-3181.55] vs 43.14 ng/mL [25.91-156.50]; P < .0001). (G) Serum serotonin is lower at baseline in patients with bone marrow failure (not FA) than in those with FA (8.58 ng/mL [2.93-23.25] vs 89.24 ng/mL [40.24-192.03]; P < .0001) and remains essentially unchanged in patients with bone marrow failure (not FA) after HSCT (8.58 ng/mL [2.93-23.25] vs 9.12 ng/mL [1.98-13.30]; P = .69).
We considered whether the association with FA might be confounded by other aspects of transplantation specific to patients with FA. All persons with FA undergoing transplant at our institution receive stem cell grafts depleted of T cells by CD34+ stem cell selection. We considered whether the increase in serotonin might be associated with CD34+ stem cell selection. To test this theory, serum serotonin levels at day 14 after HSCT in patients with FA were compared with those without FA who also received T cell–depleted, CD34+-selected grafts (Figure 2F). There were no differences in serum serotonin levels between non-FA patients who did and did not receive a CD34+-selected graft. However, serotonin levels were significantly increased in FA patients receiving a CD34+-selected graft relative to non-FA patients receiving a CD34+-selected graft. We also considered whether increased serotonin might occur in all patients with bone marrow failure and not just in those with FA. To test this theory, we measured serum serotonin in a separate cohort of 26 patients with bone marrow failure syndromes. Diagnoses included aplastic anemia (n = 12), Diamond-Blackfan anemia (n = 3), dyskeratosis congenita (n = 5), paroxysmal nocturnal hemoglobinuria (n = 2), severe congenital neutropenia (n = 2), and Shwachman-Diamond syndrome (n = 2). These patients with bone marrow failure other than FA had no change in serotonin levels at day 14 compared with baseline (Figure 2G). These results suggest that the observed differences in serotonin posttransplant are due to differences inherent in the FA phenotype, rather than differences in graft type or transplant strategy.
At baseline, serum serotonin levels were lower in bone marrow failure patients without FA compared with patients with FA, and they remained low in bone marrow failure patients without FA at day 14 after HSCT, perhaps reflecting thrombocytopenia, in contrast to the marked elevation seen in FA. Additional studies exploring correlations between serum serotonin values in FA and a range of variables, including age, sex, FA complementation group, transfusion dependence, and preparative regimen, revealed no relationship (data not shown).
The 2 primary metabolites of tryptophan are serotonin, catalyzed by TPH1, and kynurenine, catalyzed by the enzyme IDO (Figure 1). We measured expression of TPH1 in PBMCs by RT-qPCR and saw increased gene expression of TPH1 in patients with FA compared with those with other diagnoses at both baseline (testing host PBMCs) and day 14 (testing donor PBMCs); there was no significant change during bone marrow transplant in either group (Figure 3A).
![Tryptophan metabolism enzymes, kynurenine, and serotonin transporter gene expression during bone marrow transplant. Note the logarithmic scales. (A) Expression of TPH1, the rate-limiting enzyme responsible for conversion of tryptophan to serotonin, is elevated in patients with FA at both time points (baseline, 16.17 cycles [12.43-17.56] vs 20.52 cycles [18.97-21.93], P < .00001; day 14, 15.92 cycles [12.42-19.07] vs 22.33 cycles [20.15-23.16], P < .00001), with no significant change during transplant. (B) Production of kynurenine from tryptophan is significantly decreased in FA compared with other diagnoses at baseline (0.48 ng/mL [0.37-0.85] vs 1.09 ng/mL [0.79-1.28]; P = .0001) and remains low during transplant (0.48 ng/mL [0.37-0.85] vs 0.39 ng/mL [0.34-0.43]; P = .0048). (C) Expression of IDO, the rate-limiting enzyme responsible for conversion of tryptophan to kynurenine, is comparable in patients with and without FA at baseline (17.85 cycles [8.75-20.19] vs 17.51 cycles [15.98-18.51]; P = .51). At day 14, IDO decreases in patients without FA (17.51 cycles [15.98-18.51] vs 19.45 cycles [17.84-20.09]; P = .038), with no significant change during transplant in individuals with FA (17.85 cycles [8.75-20.19] vs 11.73 cycles [9.52-18.53]; P = .46). (D) Expression of SERT, a byproduct of SLC6A4 gene, is comparable between patients with and without FA at baseline (17.74 cycles [11.34-23.07] vs 19.16 cycles [16.57-21.58]; P = .33). SERT increases significantly in patients with FA by day 14 (17.74 cycles [11.34-23.07] vs 11.15 cycles [9.24-18.68]; P = .036) and is increased compared with patients without FA (11.15 cycles [9.24-18.68] vs 19.91 cycles [17.56-21.91]; P = .0014).](https://ash.silverchair-cdn.com/ash/content_public/journal/bloodadvances/5/1/10.1182_bloodadvances.2020002794/2/m_advancesadv2020002794f3.png?Expires=1763501767&Signature=BaMkVn5tMBTgBvO9K8j0zj22Or1KYEUU8VZ9nvt7JAYQ3EkZTXfaPxQNmwwptVQ1Om5Cl3-S59Qy9h612jf9wkP2ttArjQDFG5m6wsl9mBR46KTgYI-2FnIoxH3BQ2StFr6KUNTA6DrDXdEeX-v8lLHxz1OEj81R6i5hD16adJO7H3M4Z5DNZbmKbhWIGGps7SogtEJDQJUmh6eA7xv-H-JrWlRKcLXtXaUHGAWzOOkeXYdfrbaqnAmyuKB1X~QhAYvkw~8c-ipzCyX~A8vRPTRJZxNAECaUdZWl96bhAOCsgXpnUQtwPQZpIRmRz11e-JB5UxjBqTy0rvaN631XmA__&Key-Pair-Id=APKAIE5G5CRDK6RD3PGA)
Tryptophan metabolism enzymes, kynurenine, and serotonin transporter gene expression during bone marrow transplant. Note the logarithmic scales. (A) Expression of TPH1, the rate-limiting enzyme responsible for conversion of tryptophan to serotonin, is elevated in patients with FA at both time points (baseline, 16.17 cycles [12.43-17.56] vs 20.52 cycles [18.97-21.93], P < .00001; day 14, 15.92 cycles [12.42-19.07] vs 22.33 cycles [20.15-23.16], P < .00001), with no significant change during transplant. (B) Production of kynurenine from tryptophan is significantly decreased in FA compared with other diagnoses at baseline (0.48 ng/mL [0.37-0.85] vs 1.09 ng/mL [0.79-1.28]; P = .0001) and remains low during transplant (0.48 ng/mL [0.37-0.85] vs 0.39 ng/mL [0.34-0.43]; P = .0048). (C) Expression of IDO, the rate-limiting enzyme responsible for conversion of tryptophan to kynurenine, is comparable in patients with and without FA at baseline (17.85 cycles [8.75-20.19] vs 17.51 cycles [15.98-18.51]; P = .51). At day 14, IDO decreases in patients without FA (17.51 cycles [15.98-18.51] vs 19.45 cycles [17.84-20.09]; P = .038), with no significant change during transplant in individuals with FA (17.85 cycles [8.75-20.19] vs 11.73 cycles [9.52-18.53]; P = .46). (D) Expression of SERT, a byproduct of SLC6A4 gene, is comparable between patients with and without FA at baseline (17.74 cycles [11.34-23.07] vs 19.16 cycles [16.57-21.58]; P = .33). SERT increases significantly in patients with FA by day 14 (17.74 cycles [11.34-23.07] vs 11.15 cycles [9.24-18.68]; P = .036) and is increased compared with patients without FA (11.15 cycles [9.24-18.68] vs 19.91 cycles [17.56-21.91]; P = .0014).
Tryptophan metabolism enzymes, kynurenine, and serotonin transporter gene expression during bone marrow transplant. Note the logarithmic scales. (A) Expression of TPH1, the rate-limiting enzyme responsible for conversion of tryptophan to serotonin, is elevated in patients with FA at both time points (baseline, 16.17 cycles [12.43-17.56] vs 20.52 cycles [18.97-21.93], P < .00001; day 14, 15.92 cycles [12.42-19.07] vs 22.33 cycles [20.15-23.16], P < .00001), with no significant change during transplant. (B) Production of kynurenine from tryptophan is significantly decreased in FA compared with other diagnoses at baseline (0.48 ng/mL [0.37-0.85] vs 1.09 ng/mL [0.79-1.28]; P = .0001) and remains low during transplant (0.48 ng/mL [0.37-0.85] vs 0.39 ng/mL [0.34-0.43]; P = .0048). (C) Expression of IDO, the rate-limiting enzyme responsible for conversion of tryptophan to kynurenine, is comparable in patients with and without FA at baseline (17.85 cycles [8.75-20.19] vs 17.51 cycles [15.98-18.51]; P = .51). At day 14, IDO decreases in patients without FA (17.51 cycles [15.98-18.51] vs 19.45 cycles [17.84-20.09]; P = .038), with no significant change during transplant in individuals with FA (17.85 cycles [8.75-20.19] vs 11.73 cycles [9.52-18.53]; P = .46). (D) Expression of SERT, a byproduct of SLC6A4 gene, is comparable between patients with and without FA at baseline (17.74 cycles [11.34-23.07] vs 19.16 cycles [16.57-21.58]; P = .33). SERT increases significantly in patients with FA by day 14 (17.74 cycles [11.34-23.07] vs 11.15 cycles [9.24-18.68]; P = .036) and is increased compared with patients without FA (11.15 cycles [9.24-18.68] vs 19.91 cycles [17.56-21.91]; P = .0014).
Levels of the other primary metabolite of tryptophan, kynurenine, were measured in serum at baseline and day 14 (Figure 3B). Kynurenine levels were reduced in individuals with FA compared with those without FA at baseline and were similarly reduced at day 14 after transplant. Kynurenine levels decreased significantly between baseline and day 14 in all individuals.
Levels of IDO expression were measured in PBMCs from individuals with and without FA (Figure 3C). We found no difference in expression of IDO between individuals with and without FA at baseline (host PBMCs). IDO expression decreased in individuals without FA during transplant but was unchanged in patients with FA. The observation of notably lower kynurenine levels in the presence of unchanged expression of IDO in FA suggests that IDO expression in tissues other than PBMCs may be important in regulating kynurenine production, or that kynurenine production is modified by other mechanisms.
Because serotonin transporters regulate serotonin entry into the cell,31-33 we considered whether expression of the serotonin transporter (SERT) might be increased in patients with FA in response to higher circulating levels of serotonin. RT-qPCR was used to measure expression of SLC6A4, the gene encoding the sodium-dependent transmembrane SERT, in PBMCs at baseline and day 14 in our original cohort (Figure 3D). SERT RNA expression was not significantly different between FA and those without FA in host-derived PBMCs at baseline. Expression increased, however, in those with FA between baseline and day 14, and was significantly higher than in those without FA; this action was perhaps in response to higher levels of serotonin at day 14 in those with FA.
Platelets play a primary role in storage and transport of serotonin.34,35 Platelets also house the majority of circulating TGF-β, and increased TGF-β signaling has been associated with marrow failure and clastogen sensitivity in FA.36-40 Baseline platelet counts were lower in patients with FA relative to those without FA (Figure 4A). Platelet counts were modestly increased in patients with FA at day 14 relative to non-FA patients. We discovered, as expected, a significant positive correlation between serum serotonin and platelet count at baseline (r = 0.75; P < .0001) (Figure 4B) and at day 14 (r = 0.55; P = .0031) (Figure 4C) in patients who do not have FA. However, unexpectedly, there was no correlation between serotonin and platelet count in individuals with FA at baseline (Figure 4D), or day 14 (Figure 4E), after transfused platelets had been administered (baseline, r = –0.14, P = .51; day 14, r = 0.34, P = .12). Platelet transfusion need was comparable in patients with and without FA during bone marrow transplant (median platelet units received, 3.5 units [3-4.25] vs 3 units [2-5]; P = .70) and did not correlate with serum serotonin values (data not shown). These data suggest that the differences in serotonin observed in FA patients 14 days after HSCT are not due to differences in platelet-released serotonin, suggesting another source of serotonin in FA.
![Correlation of circulating platelet count with serum serotonin and serum TGF-β during bone marrow transplant. Note the logarithmic scales; Spearman’s correlation plots are displayed with linear regression line. (A) Median platelet count was significantly different between non-FA patients and patients with FA at baseline (178,000 platelets [102 000-312 000] vs 21 000 platelets [15 500-28 500]; P < .00001) and day 14 (52 000 platelets [32 000-63 500] vs 78 000 platelets [56 500-107 000]; P < .00001). (B) Serum serotonin and platelet count at baseline were significantly positively correlated in patients without FA (Spearman’s correlation coefficient, 0.75; P < .0001). (C) Serum serotonin and platelet count were also significantly positively correlated at day 14 in patients without FA (Spearman’s correlation coefficient, 0.55; P = .0031). (D-E) In patients with FA, there is no correlation between serotonin and platelet count at baseline, when platelets are host derived (Spearman’s correlation coefficient, −0.14; P = .51) (D), nor at day 14 when platelets are generally derived from the blood bank (Spearman’s correlation coefficient, 0.34; P = .12) (E). (F) Serum TGF-β increased from baseline to day 14 in patients with FA (6081.80 pg/mL [3658.49-9638.97] vs 10 745.70 pg/mL [7672.90-15 739.20]; P = .0056) but decreased in patients with other diagnoses during transplant (16 057.94 pg/mL [5804.21-20 798.64] vs 3442.77 pg/mL [2401.36-4838.18]; P = .00038). (G) Serum TGF-β and platelet count at baseline were strongly positively correlated in patients without FA (Spearman’s correlation coefficient, 0.94; P < .0001). (H) TGF-β and platelet count are also correlated at day 14 in patients without FA (Spearman’s correlation coefficient, 0.40; P = .045). (I) In contrast, serum TGF-β and circulating platelet count at baseline (host-derived platelets) show no correlation in patients with FA (Spearman’s correlation coefficient, −0.0074; P = .97). (J) At day 14 (blood bank–derived platelets), there is a strong positive correlation between serum TGF-β and platelet count in patients with FA (Spearman’s correlation coefficient, 0.83; P < .0001).](https://ash.silverchair-cdn.com/ash/content_public/journal/bloodadvances/5/1/10.1182_bloodadvances.2020002794/2/m_advancesadv2020002794f4.png?Expires=1763501767&Signature=bFdJBblsKW4gep59qhwhtpaNvdK7bEXu3O9PDmS5BLOTeemHX~T~Xko5ttNx9cnccIS-Qram-3Saf~9a4JUtbvKgmQ-bHwmsbrdYqqpha2HRExvtuIQL3nA7p-bs~oBsL8KMmp1Q7X-I4lFvZSyEOlL9cUy~kGq6oATom7IpVjwaibUEjywKwi4nAq1ucsA54wZ2G6PvHFIA1nlJY2GOOZlPcEeUJNW5RIIhn9mtKKHusZri00rVBRVMc05GatdbZHjZxddTUrNTwXDk1E7~VpTSpSTDXaGFnA66lDm9GeIsJSbfkrBO~InMQdk1W8TuFF6oc2VU1grrVN-h2EZlSQ__&Key-Pair-Id=APKAIE5G5CRDK6RD3PGA)
Correlation of circulating platelet count with serum serotonin and serum TGF-β during bone marrow transplant. Note the logarithmic scales; Spearman’s correlation plots are displayed with linear regression line. (A) Median platelet count was significantly different between non-FA patients and patients with FA at baseline (178,000 platelets [102 000-312 000] vs 21 000 platelets [15 500-28 500]; P < .00001) and day 14 (52 000 platelets [32 000-63 500] vs 78 000 platelets [56 500-107 000]; P < .00001). (B) Serum serotonin and platelet count at baseline were significantly positively correlated in patients without FA (Spearman’s correlation coefficient, 0.75; P < .0001). (C) Serum serotonin and platelet count were also significantly positively correlated at day 14 in patients without FA (Spearman’s correlation coefficient, 0.55; P = .0031). (D-E) In patients with FA, there is no correlation between serotonin and platelet count at baseline, when platelets are host derived (Spearman’s correlation coefficient, −0.14; P = .51) (D), nor at day 14 when platelets are generally derived from the blood bank (Spearman’s correlation coefficient, 0.34; P = .12) (E). (F) Serum TGF-β increased from baseline to day 14 in patients with FA (6081.80 pg/mL [3658.49-9638.97] vs 10 745.70 pg/mL [7672.90-15 739.20]; P = .0056) but decreased in patients with other diagnoses during transplant (16 057.94 pg/mL [5804.21-20 798.64] vs 3442.77 pg/mL [2401.36-4838.18]; P = .00038). (G) Serum TGF-β and platelet count at baseline were strongly positively correlated in patients without FA (Spearman’s correlation coefficient, 0.94; P < .0001). (H) TGF-β and platelet count are also correlated at day 14 in patients without FA (Spearman’s correlation coefficient, 0.40; P = .045). (I) In contrast, serum TGF-β and circulating platelet count at baseline (host-derived platelets) show no correlation in patients with FA (Spearman’s correlation coefficient, −0.0074; P = .97). (J) At day 14 (blood bank–derived platelets), there is a strong positive correlation between serum TGF-β and platelet count in patients with FA (Spearman’s correlation coefficient, 0.83; P < .0001).
Correlation of circulating platelet count with serum serotonin and serum TGF-β during bone marrow transplant. Note the logarithmic scales; Spearman’s correlation plots are displayed with linear regression line. (A) Median platelet count was significantly different between non-FA patients and patients with FA at baseline (178,000 platelets [102 000-312 000] vs 21 000 platelets [15 500-28 500]; P < .00001) and day 14 (52 000 platelets [32 000-63 500] vs 78 000 platelets [56 500-107 000]; P < .00001). (B) Serum serotonin and platelet count at baseline were significantly positively correlated in patients without FA (Spearman’s correlation coefficient, 0.75; P < .0001). (C) Serum serotonin and platelet count were also significantly positively correlated at day 14 in patients without FA (Spearman’s correlation coefficient, 0.55; P = .0031). (D-E) In patients with FA, there is no correlation between serotonin and platelet count at baseline, when platelets are host derived (Spearman’s correlation coefficient, −0.14; P = .51) (D), nor at day 14 when platelets are generally derived from the blood bank (Spearman’s correlation coefficient, 0.34; P = .12) (E). (F) Serum TGF-β increased from baseline to day 14 in patients with FA (6081.80 pg/mL [3658.49-9638.97] vs 10 745.70 pg/mL [7672.90-15 739.20]; P = .0056) but decreased in patients with other diagnoses during transplant (16 057.94 pg/mL [5804.21-20 798.64] vs 3442.77 pg/mL [2401.36-4838.18]; P = .00038). (G) Serum TGF-β and platelet count at baseline were strongly positively correlated in patients without FA (Spearman’s correlation coefficient, 0.94; P < .0001). (H) TGF-β and platelet count are also correlated at day 14 in patients without FA (Spearman’s correlation coefficient, 0.40; P = .045). (I) In contrast, serum TGF-β and circulating platelet count at baseline (host-derived platelets) show no correlation in patients with FA (Spearman’s correlation coefficient, −0.0074; P = .97). (J) At day 14 (blood bank–derived platelets), there is a strong positive correlation between serum TGF-β and platelet count in patients with FA (Spearman’s correlation coefficient, 0.83; P < .0001).
We next measured serum TGF-β (Figure 4F) and found that TGF-β levels were lower at baseline in patients with FA compared with those without FA, likely related to thrombocytopenia. However, TGF-β levels increased between baseline and day 14 after transplant in patients with FA, whereas they decreased in those without FA. As expected, we found a positive correlation between serum TGF-β and platelet count at baseline in patients without FA (Spearman’s correlation coefficient, 0.94; P < .0001) (Figure 4G) and at day 14 in patients without FA (Spearman’s correlation coefficient, 0.40; P = .045) (Figure 4H). In contrast, patients with FA do not show any correlation between serum TGF-β and platelet count at baseline (host-derived platelets) (Spearman’s correlation coefficient, −0.0074; P = .97) (Figure 4I). However, at day 14, with primarily donor platelets, there was a significant positive correlation between serum TGF-β and platelet count in patients with FA (Spearman’s correlation coefficient, 0.83; P < .0001) (Figure 4J).
Source of peripheral serotonin in FA
Peripheral serotonin is generally almost entirely produced by enterochromaffin cells in the gut,1,7,16,19-22,41 and thus we expected to detect increased levels of serotonin in the stool of patients with FA. Unexpectedly, baseline levels of stool serotonin were lower in patients with FA compared with patients without FA (Figure 5A). Moreover, levels of serotonin were similarly reduced 14 days after transplant compared with baseline in patients with FA and those without. These data led us to consider other locations for the production of serotonin in patients with FA. The skin is known to express the necessary enzymes to make peripheral serotonin and is generally understood to be abnormal in FA, with prominent pigmentary abnormalities.28,42,43 We performed immunohistochemical staining for serotonin on 3 routine skin biopsy samples collected at the time of surveillance bone marrow biopsies from patients with FA and 3 normal, age-matched control subjects. Basal and some suprabasal keratinocytes stained positively for serotonin in all FA skin biopsy samples, but staining was absent in the age-matched control samples (Figure 5B-G). We additionally evaluated the presence of TPH1 according to immunohistochemistry in the skin of these 3 patients with FA and normal, age-matched control subjects and found expression to be comparable among all individuals (Figure 5H-M).
![Stool serotonin measured during bone marrow transplant and skin biopsy samples from patients with FA and normal matched control subjects stained for serotonin and TPH1. (A) Note the logarithmic scale. All patients undergoing bone marrow transplant display a marked decrease in stool serotonin (388.98 ng/mL [336.61-743.74] vs 113.97 ng/mL [45.76-183.10]; P = .0001), including those with FA (284.98 ng/mL [81.53-419.38] vs 61.20 ng/mL [15.62-111.70]; P = .0026). Immunohistochemical staining for serotonin of skin biopsy samples at original magnification 400× from 3 different patients with FA (B-D) display marked cytoplasmic positivity within the epidermis at the level of the basal keratinocytes. (E-G) Identical staining of normal human skin biopsy samples was negative for serotonin. Immunohistochemical staining for TPH1 of skin biopsy samples from 3 patients with FA (H-J) and 3 normal human skin biopsy samples (K-M) display focal positivity within the keratinocytes of the epidermis. Original magnification 400× for panels B through M. Both positive and negative control tissue stained appropriately.](https://ash.silverchair-cdn.com/ash/content_public/journal/bloodadvances/5/1/10.1182_bloodadvances.2020002794/2/m_advancesadv2020002794f5.png?Expires=1763501767&Signature=cYq3p5ulZBkkGSSd1OV3BXbtKfK1UAiS0wzdzvFXPmvwr3ulG1-s1jrKUKRtEv1zzNlT9CHmaIah9wP0Vmw9SOQS5OmAK-nVjjgOLoUwDnWma-HyS~j40sBrXDs~RbsiAXc5hHP75bEUw4x5yMu4B9ohIFiNO-AP4ARojofVejYX1216mQeUqtsJ9iqkVJaJZzlxiG2K31lpiF5qPRlNDFU--5kilpOk0UQaeNksa6FU5PZR~G~UWMfg~Vsat06n~BiuAjUw0GviG7Qvi1QLcK2hzwqbZU1Ll2VxK31yjgca2amdFAJbY9cHVMVIY5XnXIABEKcC~jeR6i0-BAgnnw__&Key-Pair-Id=APKAIE5G5CRDK6RD3PGA)
Stool serotonin measured during bone marrow transplant and skin biopsy samples from patients with FA and normal matched control subjects stained for serotonin and TPH1. (A) Note the logarithmic scale. All patients undergoing bone marrow transplant display a marked decrease in stool serotonin (388.98 ng/mL [336.61-743.74] vs 113.97 ng/mL [45.76-183.10]; P = .0001), including those with FA (284.98 ng/mL [81.53-419.38] vs 61.20 ng/mL [15.62-111.70]; P = .0026). Immunohistochemical staining for serotonin of skin biopsy samples at original magnification 400× from 3 different patients with FA (B-D) display marked cytoplasmic positivity within the epidermis at the level of the basal keratinocytes. (E-G) Identical staining of normal human skin biopsy samples was negative for serotonin. Immunohistochemical staining for TPH1 of skin biopsy samples from 3 patients with FA (H-J) and 3 normal human skin biopsy samples (K-M) display focal positivity within the keratinocytes of the epidermis. Original magnification 400× for panels B through M. Both positive and negative control tissue stained appropriately.
Stool serotonin measured during bone marrow transplant and skin biopsy samples from patients with FA and normal matched control subjects stained for serotonin and TPH1. (A) Note the logarithmic scale. All patients undergoing bone marrow transplant display a marked decrease in stool serotonin (388.98 ng/mL [336.61-743.74] vs 113.97 ng/mL [45.76-183.10]; P = .0001), including those with FA (284.98 ng/mL [81.53-419.38] vs 61.20 ng/mL [15.62-111.70]; P = .0026). Immunohistochemical staining for serotonin of skin biopsy samples at original magnification 400× from 3 different patients with FA (B-D) display marked cytoplasmic positivity within the epidermis at the level of the basal keratinocytes. (E-G) Identical staining of normal human skin biopsy samples was negative for serotonin. Immunohistochemical staining for TPH1 of skin biopsy samples from 3 patients with FA (H-J) and 3 normal human skin biopsy samples (K-M) display focal positivity within the keratinocytes of the epidermis. Original magnification 400× for panels B through M. Both positive and negative control tissue stained appropriately.
Correlation of serum serotonin and BMI in FA
To evaluate possible consequences of elevation of serotonin in FA, we investigated a potential association of increased serum serotonin with metabolic aspects of the FA phenotype. BMI data were collected from the individuals with FA, and the data were expressed as percentile for age. Nearly one-half of the FA individuals were either underweight, below the fifth percentile, or overweight, at greater than the 85th percentile (Figure 6A). Short stature and low body weight are well described in the FA phenotype, but the significant frequency of increased body weight is underreported.26-29 BMI was inversely correlated with elevated serum serotonin in individuals with FA (Spearman’s correlation coefficient, −0.51; P = .01) (Figure 6B). No correlation was found between serum kynurenine and BMI (data not shown).
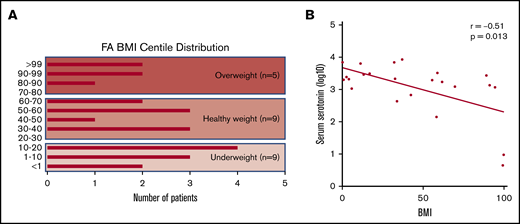
Distribution of BMIs across our FA cohort and correlation with serum serotonin. (A) Plot showing the range of BMI centiles represented within our cohort of patients with FA. Nearly two-thirds of patients fall at the extremes, with BMI underweight or overweight. (B) Note the logarithmic scale. Significant inverse correlation between serum serotonin values and BMI centile within our FA cohort. Higher elevations in serotonin are associated with lower BMI; Spearman’s correlation coefficient, −0.51; P = .013.
Distribution of BMIs across our FA cohort and correlation with serum serotonin. (A) Plot showing the range of BMI centiles represented within our cohort of patients with FA. Nearly two-thirds of patients fall at the extremes, with BMI underweight or overweight. (B) Note the logarithmic scale. Significant inverse correlation between serum serotonin values and BMI centile within our FA cohort. Higher elevations in serotonin are associated with lower BMI; Spearman’s correlation coefficient, −0.51; P = .013.
Discussion
In this report, we describe for the first time multiple tryptophan-related metabolic abnormalities in individuals with FA undergoing bone marrow transplant. Increased peripheral serotonin was detected in response to the stress of HSCT and was accompanied by reduced levels of kynurenine, both at baseline and after HSCT. Moreover, we discovered production of serotonin in the skin in FA. Abnormalities in the role platelets play in transport of serotonin and TGF-β were identified, suggesting previously undescribed abnormalities of platelets in FA. In addition, an inverse correlation was found between BMI and serotonin, suggesting that abnormalities of tryptophan metabolism may influence key parts of the FA phenotype.
Serotonin levels surge after HSCT (a severe stress, likely involving direct injury to the skin) in individuals with FA, despite baseline values being similar to those of transplant recipients with other diagnoses. In contrast, kynurenine levels were markedly reduced in individuals with FA before and after transplant, suggesting preferential metabolism of tryptophan into serotonin rather than kynurenine. TPH1 expression was increased in PBMCs in FA individuals at baseline and day 14 compared with non-FA individuals, in agreement with this finding. These data suggest that individuals with FA preferentially metabolize tryptophan into serotonin, with markedly reduced production of kynurenine, in contrast to persons without FA. The occurrence of similar changes in TPH1 and IDO RNA expression in host PBMCs (baseline samples, affected by FA) and donor PBMCs (day 14 sample, unaffected by FA) suggest that expression of TPH1 and IDO may not be cell autonomous but responsive to environmental cues. We recognize that these data are limited to PBMCs, based on sample availability, and that many other cells likely play important roles in tryptophan metabolism. Study of other tissues such as gut and skin when available is warranted.
The gut is known to be the site of production of most peripheral serotonin.1,7,19-22 Surprisingly, our data showed that serotonin in stool decreased after HSCT in individuals with FA, in contrast to the marked increase observed in serum. In the absence of evidence that serotonin originated in the gut, we tested potential alternative sites of production. The skin is one of the most consistently abnormal organs in individuals with FA, with characteristic pigmentation abnormalities and café au lait spots.28,42,43 In the general population, persons with burn injury exhibit elevation in tissue and blood serotonin.44,45 Increased local and systemic serotonin production after a burn improves wound healing by decreasing cell death, accelerating cellular migration to the affected site, and upregulating keratinocyte and fibroblast proliferation.44 Moreover, excess serotonin after burn injury is not mobilized from the gut but produced locally by skin-intrinsic mechanisms, likely bypassing the storage and transport role of platelets.45-48 Surges in skin serotonin in response to burn injury are accompanied by >10-fold increases in serotonin in the skin, with approximate twofold increases in serum and urine.45 In the current study, immunohistochemistry identified the presence of TPH1 in skin samples that was similar in patients with and without FA, confirming the capacity for production of serotonin in the skin, as outlined earlier. However, staining for serotonin in the skin was only observed in individuals with FA, whereas none was observed in age-matched control skin. Skin biopsy samples were collected from individuals with FA undergoing routine annual bone marrow examinations, outside of the setting of profound marrow failure and the major genotoxic stress of HSCT. In conjunction with normal serum serotonin values at baseline in this population, these data suggest that the skin of FA individuals produces serotonin throughout life, allowing chronic local and systemic increases. As a primary defense organ for the body, the skin is constantly exposed to stressors, including UV radiation, air pollution, infectious agents, and trauma. It is possible that skin tissue damage from the transplant preparative regimen releases a surge of serotonin, explaining the increases in circulating serotonin we measured. However, with multiple peripheral sites in the body capable of intrinsic serotonin production in addition to the skin, including the lungs, pancreas, adipocytes, and mammary epithelium,16,23,49,50 additional investigation surrounding contributing sites of production is warranted.
Platelets store and transport serotonin produced by enterochromaffin cells in the gut in dense granules, and TGF-β is similarly transported in α granules.34,35,39,40,51,52 We therefore expected that serotonin and TGF-β levels would be correlated with platelet count, and indeed found this to be true in transplant recipients without FA. In contrast, in patients with FA, neither serotonin nor TGF-β correlated with platelet count at baseline, suggesting that the constitution and function of platelet granules might differ in FA. At day 14, when platelets are largely blood bank derived, a strong correlation was observed between platelet count and TGF-β in persons with FA, suggesting an abnormality, likely cell autonomous to the platelet. In contrast, there was still no relationship between serotonin and platelet count at day 14 in FA, supporting a model of serotonin release from the skin that did not involve storage and transport by platelets. These findings were independent of platelet transfusion need during transplant, which was comparable between patients with and without FA. Further studies focused on platelet structure and function in FA are warranted.
Hyperserotonemia may contribute to the unexplained poor growth and numerous metabolic abnormalities in FA. Abnormalities reported in FA include insulin resistance, thyroid dysfunction, abnormal BMI, and dyslipidemia, all of which have been reported in association with abnormalities in serotonin metabolism, transport, and signaling in other clinical settings.7,22,23,53-57 Further support for a possible link between hyperserotonemia and FA metabolism is indicated by an inverse correlation between BMI and serum serotonin levels in individuals with FA. Many individuals with FA have low BMI and marked paucity of subcutaneous fat, which in general, is refractory to nutritional interventions. Metabolomics analysis suggests that FA individuals favor a metabolic fat burning “starvation” phenotype, tilted toward lipolysis. Moreover, patients with FA generally have reduced insulin sensitivity and increased blood glucose under stress, another effect of serotonin.22,23,25,29,54,58 Finally, increased levels of serotonin are reported to stimulate susceptibility to squamous cell carcinomas and hepatocellular carcinomas, both of which are markedly increased in FA.59-64 We recognize, however, that the functions of peripheral serotonin generally are complex and likely tissue dependent, regulated by expression of different serotonin receptors in various tissues, and prevalent paracrine loops within tissues. Additional studies will be needed to fully characterize the extent of abnormalities of tryptophan metabolism in FA.
Mouse and human data support an important role for serotonin in energy homeostasis. In general, available murine and human data suggest that peripheral serotonin promotes obesity, in contrast to our finding of an association of higher serotonin level with lower BMI. Our data indicate that much of the serotonin we measured was likely not produced by gut enterochromaffin cells and that at least one important site of production in FA is the skin. It is possible that production of serotonin in the skin could result in biological effects that are distinct from effects of serotonin produced in the gut. For example, skin-derived serotonin may have a strong local paracrine effect. It is also possible that additional sites of serotonin production outside the gut are important in FA, modifying the effect of serotonin on phenotype. Adipocytes produce serotonin, and notable different effects of serotonin on lipogenesis and lipolysis in brown and white adipocytes are regulated by differential receptor expression.53,56 Central serotonin reduces appetite, and higher levels of CNS serotonin are associated with reduced BMI. While the current study focused on serotonin production, transport and metabolism of serotonin are of great interest. The extent to which serotonin crosses the blood–brain barrier is controversial.16,22,23,53,65-67 In this study, we did not have the opportunity to measure serotonin in the CNS or in adipocytes in individuals with FA. It is possible that CNS serotonin, and production and metabolism of serotonin in tissues such as adipocytes, is also abnormal in FA, contributing to metabolic and phenotypic changes in individuals with FA. Experiments to test these hypotheses will be difficult in humans but may be feasible in mouse models; however, many murine models of FA poorly recapitulate the human phenotype.
Serotonin is a therapeutic target, and a number of licensed drugs modify production or block required receptors and might be beneficial in improving growth and correcting metabolic defects in individuals with FA. Individuals with FA are at a markedly increased risk of malignancy, and the literature implicates aberrant tryptophan metabolism and increased serotonin as important factors in oncogenesis, tumor development, progression, and metastasis in a variety of cancers, including squamous cell and hepatocellular carcinoma.5,59-61,68-70 Our findings suggest serotonin inhibition as a new avenue to diminish a multitude of clinical risks and disease phenotypes in FA, which will now require detailed characterization of local and systemic serotonin metabolism.
Requests for original data may be submitted to the corresponding author (Allison L. Bartlett; e-mail: allison.bartlett@cchmc.org).
Acknowledgments
This work was supported by the Fanconi Anemia Research Foundation Tank Grant Award.
The authors are especially grateful for the support and guidance of the Fanconi Anemia Research Foundation staff. They appreciate the many contributions of The Cincinnati Children’s Hospital Medical Center Pathology Department, especially Betsy DiPasquale. Most importantly, the authors thank the individuals and families for their invaluable contributions to this work as participants in the Fanconi Anemia and Bone Marrow Transplant Repositories.
Authorship
Contribution: A.L.B., L.R.-R., S.A., N.L., M.B., K.L., B.L., A.D., and A.U. performed experiments; A.L.B., L.R.-R., A.N., N.L., J.B., J.S.P., A.L., K.C.M., S.I.W., and S.M.D. analyzed results and created the figures; and A.L.B., L.R.-R., A.N., N.L., J.S.P., K.C.M., S.I.W., and S.M.D. designed the research and wrote the paper.
Conflict-of-interest disclosure: The authors declare no competing financial interests.
Correspondence: Allison L. Bartlett, Division of Bone Marrow Transplantation & Immune Deficiency, Cincinnati Children’s Hospital Medical Center, 3333 Burnet Ave, Cincinnati, OH 45229; e-mail: allison.bartlett@cchmc.org.

