

Key Points
RUNX1-deficient bone marrow neutrophils are the major myeloid cell source of elevated TNF production upon TLR4 stimulation.
RUNX1 loss activates an innate immune signaling transcriptional program that primes neutrophils to hyperrespond to TLR4 stimulation.

Abstract
RUNX1 is frequently mutated in myeloid and lymphoid malignancies. It has been shown to negatively regulate Toll-like receptor 4 (TLR4) signaling through nuclear factor κB (NF-κB) in lung epithelial cells. Here we show that RUNX1 regulates TLR1/2 and TLR4 signaling and inflammatory cytokine production by neutrophils. Hematopoietic-specific RUNX1 loss increased the production of proinflammatory mediators, including tumor necrosis factor-α (TNF-α), by bone marrow neutrophils in response to TLR1/2 and TLR4 agonists. Hematopoietic RUNX1 loss also resulted in profound damage to the lung parenchyma following inhalation of the TLR4 ligand lipopolysaccharide (LPS). However, neutrophils with neutrophil-specific RUNX1 loss lacked the inflammatory phenotype caused by pan-hematopoietic RUNX1 loss, indicating that dysregulated TLR4 signaling is not due to loss of RUNX1 in neutrophils per se. Rather, single-cell RNA sequencing indicates the dysregulation originates in a neutrophil precursor. Enhanced inflammatory cytokine production by neutrophils following pan-hematopoietic RUNX1 loss correlated with increased degradation of the inhibitor of NF-κB signaling, and RUNX1-deficient neutrophils displayed broad transcriptional upregulation of many of the core components of the TLR4 signaling pathway. Hence, early, pan-hematopoietic RUNX1 loss de-represses an innate immune signaling transcriptional program that is maintained in terminally differentiated neutrophils, resulting in their hyperinflammatory state. We hypothesize that inflammatory cytokine production by neutrophils may contribute to leukemia associated with inherited RUNX1 mutations.
Introduction
The transcription factor RUNX1 regulates the differentiation of multiple hematopoietic lineages, including megakaryocytes and lymphocytes, and is mutated in both sporadic and inherited forms of leukemia.1-4 RUNX1 also regulates immunity and inflammation through its function in lineage determination or by modulating the activity of inflammatory signaling pathways. RUNX1’s role in inflammation is best understood in T regulatory (Treg) cells, in which it controls Treg activity through regulating expression of the important Treg transcription factor, factor fork-head-box P3 (FoxP3), and cytokine genes, such as interleukin-2 (IL-2) and interferon-γ (IFN-γ).5,6 Deletion of RUNX1 in Tregs using Foxp3-IRES-Cre resulted in gastritis, an inflammatory disorder.5 RUNX1 also regulates T-cell immune function in a Treg-independent manner. Deletion of RUNX1 in all CD4+ T cells with Cd4-Cre resulted in an autoimmune and inflammatory disease of the lung leading to respiratory failure in aged mice.7 The disease was initiated by the infiltration of hyperactivated CD4+ T cells into the lung, which was thought to be a cell-intrinsic feature of the hyperactivated T cells and not a result of Treg dysfunction.
RUNX1 also regulates inflammatory signaling in nonlymphoid cells. In vivo deletion of RUNX1 in lung alveolar epithelial cells using a surfactant-associated protein C–driven Cre increased the susceptibility of mice to lipopolysaccharide (LPS)-induced acute lung injury.8 The mechanism by which RUNX1 represses inflammation in lung epithelial cells is through dampening toll-like receptor 4 (TLR4) signaling. TLR4 is the membrane receptor for LPS, a component of gram-negative bacterial cell walls. Binding of LPS to TLR4 transmits a signal through 2 downstream intracellular pathways, the TIR Domain-Containing Adaptor Protein (TIRAP) and myeloid differentiation primary response gene 88 (MyD88) pathway, and/or through the TIR-domain–containing adapter-inducing IFN-β (TRIF) pathway.9 The MyD88-TIRAP pathway activates both the nuclear factor κB (NF-κB) and the mitogen-activated protein kinase pathways, whereas signaling through the TRIF adaptor activates interferon response factor 3. RUNX1 inhibited the NF-κB arm of the MyD88-TIRAP pathway in lung epithelial cells by binding to the inhibitor of NF-κB (IκBα) kinase in the cytoplasm, which dampened the phosphorylation and degradation of IκBα and increased retention of NF-κB in the cytoplasm.8
Studies in humans suggest a role for RUNX1 in regulating autoimmunity and inflammation. Regulatory single nucleotide polymorphisms in RUNX binding sites in several genes have been linked to psoriasis, systemic lupus erythematosus, and rheumatoid arthritis.10 Mutations in RUNX1 in familial platelet disorder with associated myeloid malignancy (FPDMM) are also associated with inflammation. In addition to the well-described platelet disorder (thrombocytopenia and aspirin-like platelet activation defects) and increased risk of hematologic malignancy caused by inherited monoallelic RUNX1 mutations, a subset of FPDMM patients have eczema, the severity of which correlates with the degree of platelet defects and the risk of developing myeloid malignancy.11
Here we sought to determine whether RUNX1 regulates inflammatory cytokine production by hematopoietic cells in the bone marrow (BM). We show that inactivation of RUNX1 elevates inflammatory cytokine production from BM cells following TLR4 and TLR1/2 activation. Furthermore, we found that neutrophils were the major myeloid cell producers of several inflammatory cytokines. We demonstrate that increased inflammatory cytokine production by neutrophils is likely caused by alterations in neutrophil precursors that result in increased expression of TLR pathway components in differentiated neutrophils. Together these data suggest that dysregulated inflammatory responses of neutrophils, which are among the most abundant hematopoietic cells in the BM, may be an important downstream consequence of RUNX1 mutations in hematopoietic stem cells (HSCs).
Materials and methods
Mice
Pan-hematopoietic conditional Runx1 knockout (KO) mice were created by breeding Runx1f/f mice (Runx1tm1Spe)12 with Vav1-Cre mice (Tg(Vav1-cre)1Graf).13 Polymorphonuclear neutrophil (PMN)-specific conditional Runx1 PMN KO mice were created by breeding Runx1f/f mice with MRP8-Cre mice (Tg(S100A8-cre,-EGFP)1Ilw).14 Male and female mice ages 6 to 12 weeks were used in all experiments. Mice were handled according to protocols approved by the University of Pennsylvania’s Institutional Animal Care and Use Committee and housed in a specific pathogen-free facility.
Ex vivo culture and stimulation
Following isolation of whole BM or neutrophils as described (supplemental Methods), cells were rested for 1 hour at 37°C in Hanks media consisting of 1× Hanks balanced salt solution (Gibco) with 25 mM N-2-hydroxyethylpiperazine-N′-2-ethanesulfonic acid and 10% heat-inactivated fetal bovine serum (Gemini Bio-Products) unless otherwise indicated. For the whole BM stimulation described in Figure 1, ex vivo culture was performed in RPMI 1640 (Lonza) with 10% heat-inactivated fetal bovine serum. Cells were stimulated at 37°C with LPS (100 ng/mL) (Escherichia coli O111:B4; Imgen Technologies) in Hanks media. For intracellular flow assays, stimulation media also included Brefeldin A (BD GolgiPlug). The final stimulation concentrations in the TLR agonist screen were 1 μg/mL PAM3CSK4 (InvivoGen), 10e8 cells/mL HKLM (InvivoGen), 1 μg/mL pIpC (InvivoGen), 1 μg/mL Flagellin (InvivoGen), 10 μg/mL Imiquimod (InvivoGen), and 10 μg/mL CpG (ODN1826, InvivoGen) in Hanks media.

Increased secretion of inflammatory cytokines, chemokines, and growth factors by Runx1 KO BM. (A-E) Absolute quantification by CBA of inflammatory factor levels in the supernatant of whole BM cells stimulated for 8 hours with vehicle or 100 ng/mL LPS. Bar graphs include independent data points. Error bars represent mean ± standard deviation (SD). Five replicates from 4 experiments were performed for each condition with all results above the limit of detection (blue arrowhead) plotted. For all factors except KC (C), a 2-tailed unpaired Student t test was performed comparing the factor concentration between the control and Runx1 KO LPS-treated samples. Because of limited detection of KC in the control LPS-treated sample (C), a 1-sample Student t test was performed comparing the mean of the Runx1 KO LPS-treated sample to a hypothetical mean = 0. (F-G) Representative FACS plots gated on live singlets and corresponding quantification of the frequencies of monocytes, neutrophils, and eosinophils in the BM (n = 3 from 3 experiments, mean ± SD, 2-tailed unpaired Student t test). Eos, eosinophils; FSC-A, forward scatter area; Mo, monocytes; PE, phycoerythrin. *P ≤ .05; **P ≤ .01.
Increased secretion of inflammatory cytokines, chemokines, and growth factors by Runx1 KO BM. (A-E) Absolute quantification by CBA of inflammatory factor levels in the supernatant of whole BM cells stimulated for 8 hours with vehicle or 100 ng/mL LPS. Bar graphs include independent data points. Error bars represent mean ± standard deviation (SD). Five replicates from 4 experiments were performed for each condition with all results above the limit of detection (blue arrowhead) plotted. For all factors except KC (C), a 2-tailed unpaired Student t test was performed comparing the factor concentration between the control and Runx1 KO LPS-treated samples. Because of limited detection of KC in the control LPS-treated sample (C), a 1-sample Student t test was performed comparing the mean of the Runx1 KO LPS-treated sample to a hypothetical mean = 0. (F-G) Representative FACS plots gated on live singlets and corresponding quantification of the frequencies of monocytes, neutrophils, and eosinophils in the BM (n = 3 from 3 experiments, mean ± SD, 2-tailed unpaired Student t test). Eos, eosinophils; FSC-A, forward scatter area; Mo, monocytes; PE, phycoerythrin. *P ≤ .05; **P ≤ .01.
Cytokine quantification
BM cells amounting to 200 000 were plated in a total volume of 200 μL, or 200 000 neutrophils or monocytes were plated in a total volume of 100 μL. After 8 hours of stimulation, cells were pelleted, and supernatants were frozen until analyzed. Absolute multiplex quantification of a 17-factor panel of cytokines, chemokines, and growth factors was performed using the Cytometric Bead Array (CBA) mouse soluble protein flex sets (BD) according to the manufacturer’s instructions. A sigmoidal 4-parameter logistic regression was used to fit a standard curve and interpolate unknown concentrations.
Flow cytometry and cell sorting
Complete methods and a full list of antibodies are provided in supplemental Methods and supplemental Table 1. Flow cytometry was performed on an LSR II or LSR Fortessa (BD), and data were analyzed using FlowJo software (v10.1, Tree Star). The lineage panel for the phenotypic myeloid stain includes CD3, CD19, NK1.1, and B220 (full gating schemes provided in supplemental Figure 2A). Following extracellular staining, cells analyzed by intracellular flow were fixed and permeabilized using Cytofix/Cytoperm (BD) prior to intracellular staining in perm/wash buffer (BD). Gating schemes for intracellular flow assays are provided (supplemental Figure 2B). A BD fluorescence-activated cell sorter (FACS) Aria II was used to sort cells at 482.63 kPa (70 psi) using a 70-μm nozzle. Gating schemes for purified neutrophils, monocytes, and Lineage−c-Kit+Sca1− (LKS−) hematopoietic progenitors (HPs) are provided in supplemental Figure 2C-D.
LPS inhalation
The LPS inhalation assay was performed as described previously.15,16 Briefly, mice were exposed to 300 μg/mL LPS (E coli O111:B4) in 0.9% saline by nebulization for 30 minutes. Twenty-four hours postinhalation, mice were humanely euthanized for collection of whole lung for histology or bronchoalveolar lavage (BAL) as described previously and as detailed in the supplemental Methods.
Single-cell RNA sequencing (scRNA-seq)
Sorted cells were immediately processed for library preparation using the 10× Genomics Chromium Single Cell 3′ Reagent Kit, v3. Libraries were quantified using the double-stranded DNA High-Sensitivity Assay Kit (Invitrogen) on the Qubit fluorometer and the quantitative polymerase chain reaction–based KAPA assay (Kapa Biosystems). Library quality assessment was performed on the Agilent 2100 Bioanalyzer in combination with the Agilent High Sensitivity DNA kit. Indexed libraries were pooled and sequenced on an Illumina NovaSeq 6000 using the recommended sequencing read parameter from 10× user guide.
Additional experimental procedures
Additional experimental procedures are detailed in the supplemental Methods.
Results
LPS stimulation of Runx1 KO BM results in elevated secretion of inflammatory mediators by neutrophils
We assessed the effect of RUNX1 loss on the production of inflammatory mediators by hematopoietic cells by exposing whole BM cells from control mice (Runx1f/f) and mice in which Runx1 was deleted in all hematopoietic cells with Vav1-Cre (referred to as Runx1 KO) to LPS ex vivo and determining the levels of 17 cytokines, chemokines, and growth factors in the culture supernatant (Figure 1A-E; supplemental Figure 1A-L). We found that several inflammatory mediators, including granulocyte colony-stimulating factor, IL-10, KC, monocyte chemoattractant protein-1, and tumor necrosis factor (TNF), were produced at higher levels by Runx1 KO BM cells following LPS stimulation compared with control BM (Figure 1A-E).
RUNX1 is required for B- and T-cell differentiation; hence, Runx1 KO BM contains myeloid and erythroid lineage cells but lacks B and T lymphocytes.12,17,18 We therefore examined the innate myeloid compartment to identify the source of the aberrantly expressed inflammatory mediators. Expression of a subset of myeloid markers was dysregulated in Runx1 KO BM, including elevation of Siglec F on eosinophils, and reduction of the pan-myeloid marker, Ly6C, on neutrophils and eosinophils (supplemental Figure 3A-B), as shown previously.17 There were normal frequencies of phenotypic neutrophils and monocytes within the myeloid compartment in Runx1 KO BM as has been previously described,17 but the frequency of eosinophils, a minor population in the BM, was significantly reduced (Figure 1F-G). Because the frequency of no myeloid cell type was elevated in Runx1 KO BM, increased cytokine production did not result from the overabundance of a particular myeloid cell lineage.
We used intracellular flow in combination with ex vivo LPS stimulation to identify which cells were overproducing inflammatory cytokines and to what degree. We first examined TNF-α because it was the cytokine overproduced to the highest level in Runx1 KO BM (Figure 1E), and intracellular flow antibodies for its robust detection are available. Typically, monocytes are the primary producers of cytokines,19,20 and indeed, we observed significant production of TNF-α by both control and Runx1 KO monocytes, although there were no statistically significant differences in the percentage of TNF-α–positive monocytes or in the median fluorescence intensity (MFI) of TNF-α per cell (Figure 2A-B). However, we observed a striking increase in TNF-α production by Runx1 KO neutrophils (Figure 2C-D). Typically, a small percentage of neutrophils produce low levels of TNF-α in response to LPS stimulation.19-21 With loss of RUNX1, the frequency of TNF-α–positive neutrophils increased fivefold, and the MFI of TNF-α in TNF-α+ neutrophils was elevated.

Increased TNF-α production by Runx1 KO neutrophils in response to TLR4 stimulation. (A) Representative FACS plots of intracellular TNF-α production by monocytes (CD11b+Ly6G−) after stimulation of whole BM with vehicle or 100 ng/mL LPS for 4 hours. (B) Quantification of the frequency of TNF-α+ monocytes and relative MFI of TNF-α in the TNF-α+ monocytes normalized to control monocytes run in the same experiment (n = 6 from 4 experiments). (C) Representative FACS plots of intracellular TNF-α production by neutrophils (CD11b+Ly6G+) after stimulation of whole BM with vehicle or 100 ng/mL LPS for 4 hours. (D) Quantification of the frequency of TNF-α+ neutrophils and relative MFI of TNF-α in the TNF-α+ neutrophils normalized to control neutrophils run in the same experiment (n = 6 from 4 experiments). (B,D) Bar graphs depict independent data points with the mean ± SD; 2-tailed unpaired Student t tests. (E) Quantification of the frequency of TNF-α+ neutrophils (CD11b+Ly6G+) after stimulation of whole BM for 4 hours with TLR agonists (n = 4 to 6, as indicated from 6 experiments). Bar graphs depict independent data points with the mean ± SD. Statistics represent the results of a 1-way analysis of variance followed by Sidak’s multiple comparison test to compare the means of the control and Runx1 KO samples for each TLR agonist. (F-H) Absolute quantification by CBA of inflammatory factor levels in the supernatant of 200 000 FACS-purified neutrophils (CD11b+SiglecF−F4/80−Ly6G+) stimulated for 8 hours with vehicle or 100 ng/mL LPS. (I) Quantification by CBA of TNF in the supernatant of 200 000 purified monocytes stimulated for 8 hours with vehicle or 100 ng/mL LPS. (F-I) Bar graphs depict independent data points with the mean ± SD. Five replicates from 3 experiments were performed for each condition with all results above the limit of detection (blue arrowhead) plotted. Statistics represent 2-tailed unpaired Student t tests. **P ≤ .01; ***P ≤ .001; ****P ≤ .0001.
Increased TNF-α production by Runx1 KO neutrophils in response to TLR4 stimulation. (A) Representative FACS plots of intracellular TNF-α production by monocytes (CD11b+Ly6G−) after stimulation of whole BM with vehicle or 100 ng/mL LPS for 4 hours. (B) Quantification of the frequency of TNF-α+ monocytes and relative MFI of TNF-α in the TNF-α+ monocytes normalized to control monocytes run in the same experiment (n = 6 from 4 experiments). (C) Representative FACS plots of intracellular TNF-α production by neutrophils (CD11b+Ly6G+) after stimulation of whole BM with vehicle or 100 ng/mL LPS for 4 hours. (D) Quantification of the frequency of TNF-α+ neutrophils and relative MFI of TNF-α in the TNF-α+ neutrophils normalized to control neutrophils run in the same experiment (n = 6 from 4 experiments). (B,D) Bar graphs depict independent data points with the mean ± SD; 2-tailed unpaired Student t tests. (E) Quantification of the frequency of TNF-α+ neutrophils (CD11b+Ly6G+) after stimulation of whole BM for 4 hours with TLR agonists (n = 4 to 6, as indicated from 6 experiments). Bar graphs depict independent data points with the mean ± SD. Statistics represent the results of a 1-way analysis of variance followed by Sidak’s multiple comparison test to compare the means of the control and Runx1 KO samples for each TLR agonist. (F-H) Absolute quantification by CBA of inflammatory factor levels in the supernatant of 200 000 FACS-purified neutrophils (CD11b+SiglecF−F4/80−Ly6G+) stimulated for 8 hours with vehicle or 100 ng/mL LPS. (I) Quantification by CBA of TNF in the supernatant of 200 000 purified monocytes stimulated for 8 hours with vehicle or 100 ng/mL LPS. (F-I) Bar graphs depict independent data points with the mean ± SD. Five replicates from 3 experiments were performed for each condition with all results above the limit of detection (blue arrowhead) plotted. Statistics represent 2-tailed unpaired Student t tests. **P ≤ .01; ***P ≤ .001; ****P ≤ .0001.
TLR4 is a single member of a large family of pattern recognition receptors. To determine whether aberrant inflammatory responses were specific to TLR4, we stimulated BM ex vivo with a panel of TLR agonists and examined TNF-α production by intracellular flow. TNF-α was induced in control and Runx1 KO monocytes in response to all TLR agonists except pIpC, a TLR3 agonist that does not normally induce substantial TNF-α production by monocytes (supplemental Figure 4A).20 By contrast, Runx1 KO neutrophils showed dramatic induction of TNF-α production when stimulated with TLR4 and TLR1/2 agonists. Limited or no induction of TNF-α in the control or Runx1 KO neutrophils was observed for any other TLR agonist tested (Figure 2E).
To test the full complement of inflammatory mediators being overproduced, we sorted monocytes and neutrophils from control and Runx1 KO BM, stimulated them ex vivo with LPS, and assayed the same cytokines, chemokines, and growth factors analyzed for whole BM. IL-1α, macrophage inflammatory protein-1α (MIP-1α), and TNF were significantly increased in LPS-stimulated Runx1 KO neutrophils as compared with control neutrophils (Figure 2F-H). LPS-stimulated Runx1 KO monocytes also had increased production of IL-1α and MIP-1 α and decreased production of IL-10 and KC (supplemental Figure 4B-E). The amount of TNF produced by Runx1 KO neutrophils is comparable to that produced by the same number of LPS-stimulated control and Runx1 KO monocytes (Figure 2H-I). However, neutrophils are six- to sevenfold more abundant in BM compared with monocytes (Figure 1F-G); hence, neutrophils are the major myeloid cell producer of TNF in Runx1 KO BM. The increased response of Runx1 KO neutrophils to LPS has a cell intrinsic component that is not regulated by other hematopoietic cells in the BM because it is evident in purified, ex vivo–activated neutrophils.
The IL-1α, MIP-1α, and TNF produced by neutrophils were only a subset of the inflammatory cytokines overproduced from ex vivo–stimulated unfractionated BM cells (Figure 1A-E); therefore, other cell populations also contribute to the increased inflammatory milieu of Runx1 KO BM.
In vivo activation of Runx1 KO neutrophils with LPS results in profound lung damage
We determined whether the alterations in ex vivo neutrophil cytokine production correlated with biologically significant effects in vivo. Control and Runx1 KO mice inhaled nebulized LPS and were examined 24 hours later to determine the inflammatory state of the lungs and the extent of tissue damage.15,16 Replicates of this experiment were conducted on 2 independent days, with some variability seen in the degree but not directionality of the differences between control and Runx1 KO mice. In 1 experiment, there was minimal contamination of the BAL fluid with blood (supplemental Figure 5A), enabling us to quantify the degree of infiltration of activated neutrophils from the peripheral blood into the lungs. Both control and Runx1 KO mice had robust migration of neutrophils into the lungs as determined by quantification of the white blood cell count and differential of the BAL fluid (Figure 3A-B). However, Runx1 KO mice had 1.7-fold more neutrophils in the BAL relative to control mice. Runx1 KO mice also had signs of increased damage to the lung parenchyma as indicated by a trend toward increased total protein in the BAL fluid (Figure 3C). The increased number of neutrophils in the lung BAL was due to increased neutrophil migration, because the number of neutrophils in peripheral blood is unaffected by RUNX1 loss.17 In the second experiment, the Runx1 KO mice exhibited profound alveolar hemorrhage evidenced by both histology and bloody BAL samples (Figure 3D-E), which confounded the quantification of neutrophil infiltration. Hemorrhage was likely exacerbated by the thrombocytopenia and platelet activation defects associated with RUNX1 loss.12,18 Severe gross lung damage was seen in 4 out of 5 Runx1 KO mice, as assessed by either BAL fluid appearance or histology (Figure 3D-E; supplemental Figure 5B). The BAL fluid of control and Runx1 KO mice had detectable levels of several inflammatory mediators, some of which were comparable between the 2 genotypes (Figure 3F-J), but TNF, granulocyte colony-stimulating factor, IFN-γ, IL-1α, IL-1β, IL-6, monocyte chemoattractant protein-1, MIG, and MIP-1α levels were highly elevated in the BAL from Runx1 KO mice (Figure 3K-S). Together these data demonstrate that alterations of Runx1 KO neutrophils have biologically significant consequences in vivo upon exposure to inflammatory stimuli.
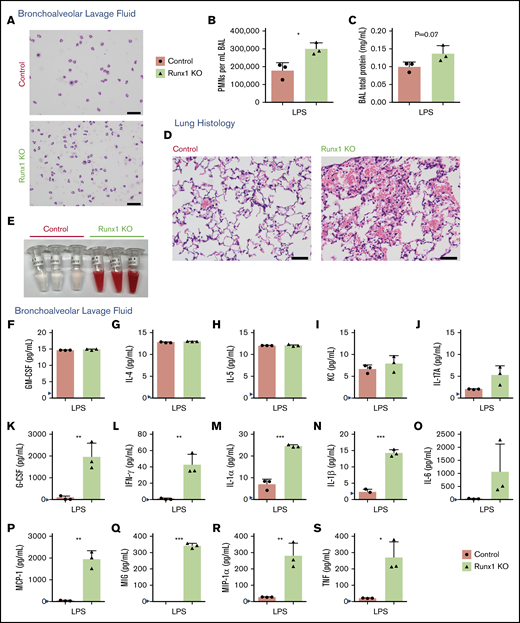
Increased activation of Runx1 KO neutrophils in vivo in response to TLR4 stimulation. (A-C) Data derived from mice in 1 experiment exposed to nebulized LPS simultaneously for 30 minutes and harvested 24 hours later (n = 5 for each genotype). Three mice were used for BAL analysis, and 2 mice were used for lung histology from each genotype. (A) Representative cytospins of BAL fluid used to quantify the differential inflammatory infiltrates (n = 3). Scale bars, 50 μm; Hema 3 stain. (B) Absolute neutrophil counts in BAL fluid determined by calculating white blood cell count and multiplying it by the percent PMNs determined from the cytospins (n = 3, mean ± SD, unpaired 2-tailed Student t tests). (C) Quantification of BAL fluid total protein levels (n = 3). (D-S) Data from a second experiment in which mice were exposed to LPS simultaneously and harvested 24 hours later (n = 5 for each genotype). Three mice were used for BAL analysis, and 2 mice were used for lung histology from each genotype. Four out of 5 Runx1 KO mice in this experiment had profound alveolar hemorrhage indicated by either BAL appearance (3/3) or lung histology (1/2). (D) Lung histology showing degree of inflammatory infiltrate, alveolar hemorrhage, and gross damage (n = 2). Second Runx1 KO replicate for this experiment is shown in supplemental Figure 5B. Scale bars, 50 μm; hematoxylin and eosin stain. (E) Gross appearance of BAL fluid (n = 3). (F-S) Absolute quantification by CBA of inflammatory factor levels in the BAL fluid (mean ± SD). Three replicates were performed for each condition with all results above the limit of detection (blue arrowhead) plotted. For all factors except MIG (Q), a 2-tailed unpaired Student t test was performed. Because of limited detection of MIG in the control BAL fluid (Q), a 1-sample Student t test was performed comparing the mean of the Runx1 KO BAL fluid to a hypothetical mean = 0. *P ≤ .05; **P ≤ .01; ***P ≤ .001. GM-CSF, granulocyte-macrophage colony-stimulating factor.
Increased activation of Runx1 KO neutrophils in vivo in response to TLR4 stimulation. (A-C) Data derived from mice in 1 experiment exposed to nebulized LPS simultaneously for 30 minutes and harvested 24 hours later (n = 5 for each genotype). Three mice were used for BAL analysis, and 2 mice were used for lung histology from each genotype. (A) Representative cytospins of BAL fluid used to quantify the differential inflammatory infiltrates (n = 3). Scale bars, 50 μm; Hema 3 stain. (B) Absolute neutrophil counts in BAL fluid determined by calculating white blood cell count and multiplying it by the percent PMNs determined from the cytospins (n = 3, mean ± SD, unpaired 2-tailed Student t tests). (C) Quantification of BAL fluid total protein levels (n = 3). (D-S) Data from a second experiment in which mice were exposed to LPS simultaneously and harvested 24 hours later (n = 5 for each genotype). Three mice were used for BAL analysis, and 2 mice were used for lung histology from each genotype. Four out of 5 Runx1 KO mice in this experiment had profound alveolar hemorrhage indicated by either BAL appearance (3/3) or lung histology (1/2). (D) Lung histology showing degree of inflammatory infiltrate, alveolar hemorrhage, and gross damage (n = 2). Second Runx1 KO replicate for this experiment is shown in supplemental Figure 5B. Scale bars, 50 μm; hematoxylin and eosin stain. (E) Gross appearance of BAL fluid (n = 3). (F-S) Absolute quantification by CBA of inflammatory factor levels in the BAL fluid (mean ± SD). Three replicates were performed for each condition with all results above the limit of detection (blue arrowhead) plotted. For all factors except MIG (Q), a 2-tailed unpaired Student t test was performed. Because of limited detection of MIG in the control BAL fluid (Q), a 1-sample Student t test was performed comparing the mean of the Runx1 KO BAL fluid to a hypothetical mean = 0. *P ≤ .05; **P ≤ .01; ***P ≤ .001. GM-CSF, granulocyte-macrophage colony-stimulating factor.
The TIRAP-MyD88 arm of TLR4 signaling is more highly activated in Runx1 KO cells following LPS stimulation
We examined whether signaling from TLR4 was dysregulated in Runx1 KO BM cells, using the degradation of IκBα as an experimental indicator of TLR4 pathway activity. Although degradation of IκBα was seen in both control and Runx1 KO BM, IκBα degradation occurred earlier and to a greater degree in Runx1 KO BM, indicating increased LPS-induced activation of the TIRAP-MyD88 arm of the TLR4 signaling pathway (Figure 4A). IκBα was also degraded at earlier time points and to a greater degree in purified Runx1 KO vs control neutrophils (Figure 4B). We were unable to detect NF-κB or phosphor-NF-κB p65 in purified neutrophils by western blot and therefore could not determine whether degradation of IκBα resulted in NF-κB activation (not shown). Nevertheless, our data indicate that dysregulation of TLR4 signaling is caused, at least in part, by alterations in the pathway between TLR4 and IκBα.

Increased TLR4 pathway activation in Runx1 KO neutrophils. (A) Representative western blot of IκBα degradation in whole BM over a time course of 0 to 90 minutes (′) of stimulation with 100 ng/mL LPS (n = 3). Bar graphs depict IκBα levels relative to the 0-minute time point for each genotype after normalization to the Cyclophilin B loading control for each sample (mean ± SD, 2-tailed unpaired Student t tests comparing Runx1 KO and control samples at each time point). Representative of 7 experiments. (B) Representative western blot of IκBα degradation in FACS-purified neutrophils (CD11b+SiglecF−F4/80−Ly6G+) over a time course of 0 to 60 minutes of stimulation with 100 ng/mL LPS (n = 7 from 5 experiments). *P ≤ .05.
Increased TLR4 pathway activation in Runx1 KO neutrophils. (A) Representative western blot of IκBα degradation in whole BM over a time course of 0 to 90 minutes (′) of stimulation with 100 ng/mL LPS (n = 3). Bar graphs depict IκBα levels relative to the 0-minute time point for each genotype after normalization to the Cyclophilin B loading control for each sample (mean ± SD, 2-tailed unpaired Student t tests comparing Runx1 KO and control samples at each time point). Representative of 7 experiments. (B) Representative western blot of IκBα degradation in FACS-purified neutrophils (CD11b+SiglecF−F4/80−Ly6G+) over a time course of 0 to 60 minutes of stimulation with 100 ng/mL LPS (n = 7 from 5 experiments). *P ≤ .05.
TLR4 signaling pathway components are broadly upregulated in Runx1 KO neutrophils
To determine which TLR4 pathway molecules are dysregulated in Runx1 KO neutrophils, we performed RNA-seq on purified control and Runx1 KO neutrophils stimulated with vehicle or LPS. Gene ontology (GO) analysis of genes upregulated in vehicle-treated Runx1 KO neutrophils identified “inflammatory response” and “Toll-like receptor signaling pathway” among the key gene sets upregulated in Runx1 KO neutrophils as compared with control neutrophils (Figure 5A). Upregulation of inflammatory pathway GO terms was also associated with LPS-treated Runx1 KO neutrophils as compared with control neutrophils (supplemental Figure 6A). Messenger RNAs encoding several members of the TLR signaling pathway, including Tlr1, Tlr4, Ticam2, and Traf6, as well as the NF-κB family members, Nfkb1 and Rela, were upregulated in vehicle-treated Runx1 KO neutrophils, hence were elevated at baseline (Figure 5B-D). TLR4 protein is upregulated on Runx1 KO neutrophils compared with control neutrophils as determined by flow cytometry (Figure 5E). Together the data indicate that RUNX1 loss de-represses an inflammatory transcriptional program that causes neutrophils to hyperrespond to stimulation by TLR4 agonists.

Dysregulated expression of inflammatory pathways in Runx1 KO neutrophils. (A-D) RNA-seq data collected from FACS-purified neutrophils (CD11b+SiglecF−F4/80−Ly6G+) stimulated with vehicle or 100 ng/mL LPS for 2 hours (n = 3 from 3 experiments). Expression values are normalized to total cell number with a spike in control. (A) GO analysis of differentially expressed genes upregulated in Runx1 KO neutrophils as compared with control neutrophils with vehicle treatment. GO analysis of differentially expressed genes downregulated in vehicle-treated Runx1 KO neutrophils as compared with controls and up- or downregulated in LPS-treated Runx1 KO neutrophils as compared with controls is shown in supplemental Figure 6A. (B) Heat maps of TLR4 pathway genes in vehicle-treated Runx1 KO (RV1, RV2, RV3) compared with control neutrophils (CV1, CV2, CV3) ordered by fold-change in expression (high to low). Statistically significantly upregulated genes are marked with an asterisk and green text (false discovery rate <0.05). (C) Normalized expression of TLR4 pathway genes in vehicle-treated neutrophils (P = 1.45e-5, Student t test) (D) Schematic of TLR4 pathway genes with all statistically significantly upregulated genes in vehicle-treated Runx1 KO neutrophils denoted in green. Schematic adapted from O’Neill et al.45 (E) Cell surface TLR4 on control and Runx1 KO neutrophils (CD11b+Ly6G+) as compared with a representative isotype control (normalized to mode). Bar graphs depict absolute TLR4 MFI of individual samples (n = 3, mean ± SD, 2-tailed unpaired Student t test). Data are representative of 3 experiments. **P ≤ .001.
Dysregulated expression of inflammatory pathways in Runx1 KO neutrophils. (A-D) RNA-seq data collected from FACS-purified neutrophils (CD11b+SiglecF−F4/80−Ly6G+) stimulated with vehicle or 100 ng/mL LPS for 2 hours (n = 3 from 3 experiments). Expression values are normalized to total cell number with a spike in control. (A) GO analysis of differentially expressed genes upregulated in Runx1 KO neutrophils as compared with control neutrophils with vehicle treatment. GO analysis of differentially expressed genes downregulated in vehicle-treated Runx1 KO neutrophils as compared with controls and up- or downregulated in LPS-treated Runx1 KO neutrophils as compared with controls is shown in supplemental Figure 6A. (B) Heat maps of TLR4 pathway genes in vehicle-treated Runx1 KO (RV1, RV2, RV3) compared with control neutrophils (CV1, CV2, CV3) ordered by fold-change in expression (high to low). Statistically significantly upregulated genes are marked with an asterisk and green text (false discovery rate <0.05). (C) Normalized expression of TLR4 pathway genes in vehicle-treated neutrophils (P = 1.45e-5, Student t test) (D) Schematic of TLR4 pathway genes with all statistically significantly upregulated genes in vehicle-treated Runx1 KO neutrophils denoted in green. Schematic adapted from O’Neill et al.45 (E) Cell surface TLR4 on control and Runx1 KO neutrophils (CD11b+Ly6G+) as compared with a representative isotype control (normalized to mode). Bar graphs depict absolute TLR4 MFI of individual samples (n = 3, mean ± SD, 2-tailed unpaired Student t test). Data are representative of 3 experiments. **P ≤ .001.
RUNX1 does not directly regulate TLR4 signaling in differentiated neutrophils
To determine whether RUNX1 is required in neutrophils per se to dampen TLR4 signaling, we examined the response of neutrophils from mice in which Runx1 was deleted specifically in the PMN compartment using MRP8-Cre14 (referred to as Runx1 PMN KO) to ex vivo LPS stimulation. Although the deletion of Runx1 by MRP8-Cre was efficient, TNF-α production by Runx1 PMN KO neutrophils was low and indistinguishable from that of control neutrophils (Figure 6A-C), as evidenced by the similar frequencies of TNF-α–positive neutrophils and the TNF-α MFI. Interestingly, neither control nor Runx1 PMN KO neutrophils contained detectable RUNX1 protein, even though RUNX1 was readily detected in splenocytes (Figure 6D). Consistent with the marked downregulation of Runx1 messenger RNA levels during neutrophil commitment and maturation from granulocyte-monocyte progenitors (GMP),22 these data indicate that RUNX1 is not actively regulating TLR4 signaling in differentiated neutrophils.

Dysregulation of TLR4 signaling pathway in Runx1 KO neutrophils occurs prior to the committed neutrophil stage. (A) Representative FACS plots of intracellular TNF-α production by neutrophils (CD11b+Ly6G+) after stimulation of whole BM with vehicle or 100 ng/mL LPS for 4 hours. Runx1 PMN KO = Runx1f/f; MRP8-Cre. (B) Quantification of the frequency of TNF-α+ neutrophils and relative MFI of the TNF-α+ neutrophils normalized to control neutrophils run in the same experiment (n = 4 from 4 experiments, mean ± SD, 1-way analysis of variance and Tukey’s multiple comparisons test). (C) Presence of the expected wild-type, floxed (f), or deleted Runx1 polymerase chain reaction products from tail clips (with a small amount of contaminating blood) and FACS-purified neutrophils (CD11b+SiglecF−F4/80−Ly6G+). (D) Western blot showing total RUNX1 levels in FACS-purified neutrophils and splenocytes from the same mice. ***P ≤ .001; ****P ≤ .0001. ns, not significant.
Dysregulation of TLR4 signaling pathway in Runx1 KO neutrophils occurs prior to the committed neutrophil stage. (A) Representative FACS plots of intracellular TNF-α production by neutrophils (CD11b+Ly6G+) after stimulation of whole BM with vehicle or 100 ng/mL LPS for 4 hours. Runx1 PMN KO = Runx1f/f; MRP8-Cre. (B) Quantification of the frequency of TNF-α+ neutrophils and relative MFI of the TNF-α+ neutrophils normalized to control neutrophils run in the same experiment (n = 4 from 4 experiments, mean ± SD, 1-way analysis of variance and Tukey’s multiple comparisons test). (C) Presence of the expected wild-type, floxed (f), or deleted Runx1 polymerase chain reaction products from tail clips (with a small amount of contaminating blood) and FACS-purified neutrophils (CD11b+SiglecF−F4/80−Ly6G+). (D) Western blot showing total RUNX1 levels in FACS-purified neutrophils and splenocytes from the same mice. ***P ≤ .001; ****P ≤ .0001. ns, not significant.
We hypothesized that dysregulation of TLR4 signaling in Runx1 KO neutrophils occurs in a precursor of mature neutrophils, prior to the preneutrophil stage at which MRP8-Cre becomes active,14,22 and is then inherited by the mature neutrophils that differentiate from these precursors. To examine this hypothesis, we performed scRNA-seq on freshly isolated, unstimulated LKS− HPs isolated from control and Runx1 KO BM. The data, mapped onto a uniform manifold approximation and projection (UMAP) plot of data from hematopoietic stem and progenitor (Lin−c-Kit+ [LK]) cells from Giladi et al,23 revealed that purified control and Runx1 KO LKS− HPs contained primarily erythroid (Car1+), megakaryocyte (Pf4+), CD34+, and various stages of neutrophil HPs (CD34+/CD16+, Gstm1+/CD63+, and Fcnb+) (Figure 7A-B). Basophil progenitors (Prss34+) were depleted from Runx1 KO LKS− cells, as previously reported.24 Reactome pathway analysis identified several inflammatory pathways upregulated in Runx1 KO neutrophil HPs, including “the NLRP3 inflammasome,” “formyl peptide receptors bind formyl peptides and any other ligands,” “regulation of TLR by endogenous ligand,” and “Toll Like Receptor 4 Cascade” (Figure 7C-D). Upregulation of the TLR4 signaling pathway first became significant in CD34+/CD16+ neutrophil HPs, likely corresponding to the GMP stage,25 and was maintained in later Gstm1+/CD63+ and Fcnb1+ neutrophil HPs (Figure 7E). These data demonstrate that upregulated expression of TLR signaling components is established in progenitors upstream of differentiated Runx1 KO neutrophils.
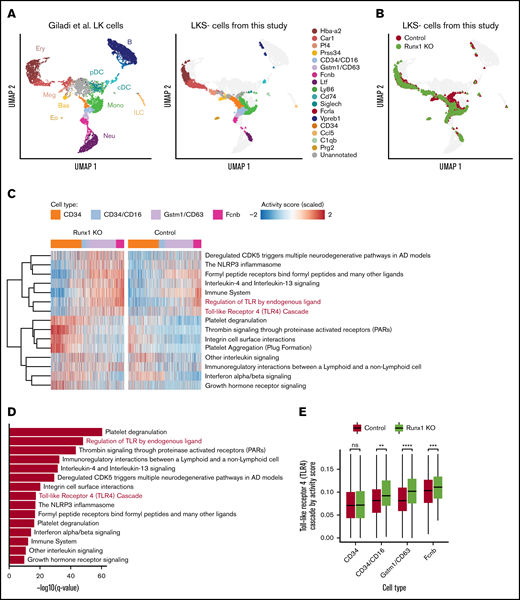
scRNA-seq suggests that dysregulation of TLR signaling pathways begins in CD34+/CD16+GMPs. (A) Left panel shows UMAP of 11 956 LK cells (Lin−, c-Kit+) from Giladi et al,23 with refined cell type labeling. Right panel shows projection of 14 795 LKS− cells from this study onto the same UMAP, with cell type labels transferred from Giladi et al23 by k-nearest-neighbor algorithm (see supplemental Methods). The control sample includes LKS− cells of pooled BM from 1 Runx1f/f and 1 Runx1f/− mouse (ie, with a monoallelic germline Runx1 mutation). (B) Same UMAP from panel A, colored by genotype. (C) Top upregulated pathways in Runx1 KO neutrophil HPs compared with control cells. Color indicates pathway activity score computed using the AUCell package.46 Cells were down-sampled so that Runx1 KO and control have equal cell numbers across stages. (D) Significance level computed by 2-tailed unpaired Student t test of pathways shown in panel C. (E) Activity score of “Toll Like Receptor 4 Cascade” between Runx1 KO and control cells across stages. Two-tailed unpaired Student t tests were performed between genotypes for each stage. **q value ≤ 0.01; ***q value ≤ 0.001; ****q value ≤ 0.0001. AD, Alzheimer disease.
scRNA-seq suggests that dysregulation of TLR signaling pathways begins in CD34+/CD16+GMPs. (A) Left panel shows UMAP of 11 956 LK cells (Lin−, c-Kit+) from Giladi et al,23 with refined cell type labeling. Right panel shows projection of 14 795 LKS− cells from this study onto the same UMAP, with cell type labels transferred from Giladi et al23 by k-nearest-neighbor algorithm (see supplemental Methods). The control sample includes LKS− cells of pooled BM from 1 Runx1f/f and 1 Runx1f/− mouse (ie, with a monoallelic germline Runx1 mutation). (B) Same UMAP from panel A, colored by genotype. (C) Top upregulated pathways in Runx1 KO neutrophil HPs compared with control cells. Color indicates pathway activity score computed using the AUCell package.46 Cells were down-sampled so that Runx1 KO and control have equal cell numbers across stages. (D) Significance level computed by 2-tailed unpaired Student t test of pathways shown in panel C. (E) Activity score of “Toll Like Receptor 4 Cascade” between Runx1 KO and control cells across stages. Two-tailed unpaired Student t tests were performed between genotypes for each stage. **q value ≤ 0.01; ***q value ≤ 0.001; ****q value ≤ 0.0001. AD, Alzheimer disease.
Discussion
Pan-hematopoietic loss of RUNX1 results in overproduction of multiple cytokines and chemokines downstream of TLR4-mediated signaling. The deleterious consequences of hyperresponsive Runx1 KO neutrophils were exhibited in vivo as Runx1 KO mice displayed increased damage to the lung parenchyma following inhalation of LPS. Based on the absence of the inflammatory phenotype in neutrophils in which Runx1 was deleted later in neutrophil differentiation (in preneutrophils) and the increased TLR pathway signature in Runx1 KO neutrophil HPs, we propose a model wherein loss of RUNX1 may de-repress an innate immune signaling transcriptional program in Runx1 KO neutrophil HPs, likely GMPs. This transcriptional program is then maintained in differentiated neutrophils, priming them to hyperrespond to TLR4 and TLR1/2 stimulation. This model is distinct from previously reported mechanisms in macrophages and lung epithelial cells whereby RUNX1 dampens TLR4 signaling through direct interaction between the RUNX1 protein with either the p50 subunit of NF-κB or the inhibitor of IκB kinase.8,26,27
The upregulation of TLR pathway components in upstream Runx1 KO neutrophil HPs suggests that RUNX1 may regulate inflammatory signaling during neutrophil differentiation in a cell-autonomous manner. However, noncell-autonomous effects could also contribute to an inflammatory state either in neutrophil HPs or in neutrophils themselves. For example, Runx1 KO mice lack T cells12,18 ; hence, the absence of Tregs could contribute to the robust infiltration of inflammatory neutrophils and the profound damage of lung parenchyma in Runx1 KO mice following LPS inhalation. The responsible hematopoietic cell could also indirectly regulate neutrophil activity; for example, systemic elevation of TLR4 ligands due to altered gut permeability could prime neutrophils or their precursors to hyperrespond to these signals. However, because we also observed the hyperinflammatory phenotype in purified neutrophils stimulated ex vivo, any noncell-autonomous effects result in cell-autonomous alterations in differentiated neutrophils prior to their stimulation.
Somatically acquired mutations in HSCs that cause clonal hematopoiesis of indeterminate potential (CHIP) in humans can elevate inflammatory cytokine production by downstream myeloid lineage cells.28-31 CHIP occurs when a sporadic mutation in an HSC confers upon it a selective clonal advantage.32-35 CHIP is also observed in FPDMM patients, but at a much earlier age than in the general population.36 The inflammatory myeloid phenotype of Runx1 KO mice has significant parallels to phenotypes observed in murine models of CHIP due to TET2 mutations. Loss of TET2 in HSCs results in increased inflammatory cytokine production by downstream, differentiated myeloid lineage cells.28-30 The most significant clinical consequence of CHIP is increased death due to cardiovascular events,30,34 which murine models directly linked to dysregulated inflammation in macrophages with TET2 loss.29,30 The parallel inflammatory phenotypes of RUNX1 and TET2 loss suggest a possible common role for dysregulation of innate myeloid immune signaling in the development of CHIP and leukemia, while the RUNX1 phenotype implicates neutrophils specifically in this process. Neutrophils were also shown to have hypersensitive responses to TLR4 stimulation in a murine model of del(5q) myelodysplastic syndrome, although priming occurred through the upregulation of CD14, a TLR coreceptor, without changes in the expression of TLRs themselves.37 Of note, CD14 was not upregulated in the Runx1 KO neutrophils, whereas several TLRs were, implicating a distinct mechanism for priming with RUNX1 loss.
Although acute bursts of proinflammatory cytokines are critical for the adaptive upregulation of myelopoiesis during infection, chronic exposure to inflammatory factors, such as TLR agonists, IFNs, TNF, and IL-1, ultimately leads to impaired HSC self-renewal.38 Similarly, cytokines, such as TNF, have been correlated with BM failure disorders, which are defined by loss of functional HSCs.39,40 The same sets of proinflammatory mediators have been shown to have functional consequences in leukemia. In patients with acute myeloid leukemia, serum levels of TNF-α are elevated as compared with healthy controls and are a poor prognostic indicator.41 Furthermore, in a large ex vivo screen of primary acute myeloid leukemia samples, IL-1β specifically promoted the growth of leukemic hematopoietic stem and progenitor cells (HSPCs) to the detriment of healthy HSPC growth, highlighting a possible mechanism through which inflammatory cytokines may directly impact leukemogenesis.42
Given the evidence linking inflammation to deleterious effects on hematopoiesis, the aberrant inflammatory cytokine production observed in Runx1 KO BM neutrophils may have clinical implications for FPDMM patients who have inherited monoallelic RUNX1 mutations. Runx1 KO mice are not a perfect genetic model of FPDMM because they lack all RUNX1 function specifically in hematopoietic cells and do not develop hematopoietic malignancies spontaneously.43,44 Nevertheless, our findings would suggest that the neutrophils of FPDMM patients might have increased inflammatory cytokine responses. Thus, although FPDMM pedigrees are rare, efforts should be made to directly evaluate cytokine production by FPDMM neutrophils. If FPDMM myeloid cells are indeed hyperactive, we hypothesize that this would contribute to an inflammatory microenvironment in the BM that may directly participate in the pathogenesis of FPDMM, perhaps through promoting either the acquisition of secondary mutations or the selective expansion of preleukemic or leukemic clones. If this proves to be the case, directly targeting inflammatory mediators may provide a novel approach for therapeutic intervention in FPDMM.
In sum, we identified differentiated neutrophils as a source of robust levels of proinflammatory cytokines upon activation of TLR4 and TLR1/2 signaling in Runx1 KO BM. Through de-repression of a transcriptional program established early in hematopoiesis and maintained in committed neutrophils, Runx1 KO neutrophils are primed to hyperrespond to LPS. These findings elucidate a new mechanism by which RUNX1 regulates inflammation and through which RUNX1 mutations may impact normal and malignant hematopoiesis.
Data generated during this study have been deposited in the Gene Expression Omnibus (accession number GSE144483).
Acknowledgments
The authors thank Michael May for sharing his expertise in NF-κB signaling; Ethan Mack, Jason Liu, and Ning Dai for their technical contributions; and the entire Speck, Gilliland, and Jordan labs for their thoughtful discussions.
This work was supported by the RUNX1 Research Program (N.A.S.), National Institutes of Health, National Institute of Allergy and Infectious Diseases grant R01AI099479 (G.S.W.), National Center for Advancing Translational Sciences grant UG3TR002198 (G.S.W.), National Heart, Lung, and Blood Institute grant T32HL007439 (D.C.B.), National Cancer Institute grant F30CA196123 (D.C.B.), and the Abramson Family Cancer Research Institute’s Patel Scholar Award (D.C.B.). Core facilities at the University of Pennsylvania are supported by a National Cancer Institute Cancer Center Support Grant to the Abramson Cancer Center (P30 CA016520).
Authorship
Contribution: D.C.B. conceived, designed, performed, and analyzed experiments and wrote the manuscript; C.-H.C. performed the scRNA-Seq experiments; Q.Z. performed the scRNA-seq analysis; S.B. and C.-T.L. performed the experiments; B.H. analyzed the bulk RNA-seq data; G.B.W., M.J., and K.T. provided strategic guidance throughout the project; G.S.W. provided strategic guidance throughout the project and performed and scored LPS inhalation experiments; D.G.G. codirected the project; N.A.S. codirected project, conceived and designed experiments, and wrote the manuscript; and all authors edited the manuscript.
Conflict-of-interest disclosure: The authors declare no competing financial interests.
Correspondence: Nancy A. Speck, Perelman School of Medicine, University of Pennsylvania, 554 BRB II/III, 421 Curie Blvd, Philadelphia, PA 19104; e-mail: nancyas@upenn.edu.

