

Key Points
Under steady-state conditions, tissue-resident lung ILC2s exhibit TCR gene rearrangements similar to γδT cells
Rearranged TCR genes in ILC2s are aberrant and nonfunctional, suggesting that ILC2s arise from failed T-cell development.

Abstract
Innate lymphoid cells (ILCs) are a recently identified subset of leukocytes that play a central role in pathogen surveillance and resistance, modulation of immune response, and tissue repair. They are remarkably similar to CD4+ T-helper subsets in terms of function and transcription factors required for their development but are distinguished by their lack of antigen-specific receptors. Despite their similarities, the absence of a surface T-cell receptor (TCR) and presence of ILCs and precursors in adult bone marrow has led to speculation that ILCs and T cells develop separately from lineages that branch at the point of precursors within the bone marrow. Considering the common lineage markers and effector cytokine profiles shared between ILCs and T cells, it is surprising that the status of the TCR loci in ILCs was not fully explored at the time of their discovery. Here, we demonstrate that a high proportion of peripheral tissue ILC2s have TCRγ chain gene rearrangements and TCRδ locus deletions. Detailed analyses of these loci show abundant frameshifts and premature stop codons that would encode nonfunctional TCR proteins. Collectively, these data argue that ILC2 can develop from T cells that fail to appropriately rearrange TCR genes, potentially within the thymus.
Introduction
Innate and adaptive immunity are characterized as distinct but cooperative systems that serve to protect the host from foreign entities. The innate immune system is the front line of defense, responding rapidly but lacking antigen specificity and memory. In contrast, the adaptive immune response operates with delayed kinetics but exquisite specificity via selection of antigen-specific clones from a large pool of lymphocytes and leads to clearance of the infection and formation of long-term recall responses.1 A major player in the innate compartment is the recently described family of innate lymphoid cells (ILCs). These cells play a central role in response to pathogens, modulating inflammation, and facilitating tissue repair in a non–antigen-specific manner.2 Three major subsets (ILC1, -2, and -3) respond primarily to alarmins such as interleukin-12 (IL-12), IL-18, and IL-15 (ILC1); IL-25, TSLP, and IL-33 (ILC2); and IL-23 and IL-1β (ILC3). They sculpt the immediate cytokine microenvironment for the downstream effector cells, including adaptive immune cells.3,4 T cells, in contrast, represent a critical arm of the adaptive immune system and coordinate antigen-specific immune response and memory. Through antigen-specific receptors, the hallmark of this branch of the immune system, they recognize a nearly infinite pool of antigens from pathogens and tumors, establish long-term immunologic memory, and maintain self-tolerance.5
Although antigen specificity remains a unique hallmark that distinguishes the innate and adaptive immune response, ILCs otherwise share striking molecular and functional similarities to CD4+ T cells and produce the same effector cytokines and transcriptional regulators. Specifically, like T helper 1 (Th1) cells, ILC1s express the transcription factor T-bet as a master transcriptional regulator and produce interferon-γ. ILC2s express the Th2 transcriptional regulator GATA3 and produce IL-5 and IL-13, and ILC3s express RORγt and secrete IL-17A and IL-22 like Th17 cells.6-8 This parallel expression of transcription factors and effector cytokines has led to speculation that ILCs represent an evolutionary precursor to adaptive immune cells that subsequently developed antigen-specific receptors.9
Despite their striking similarities, current dogma suggests 2 major distinctions between ILCs and T cells. The first is the lack of the aforementioned antigen-specific surface receptors on ILCs.10 The second is that T-cell development and maturation is compartmentalized almost exclusively in the thymus because of a critical requirement of this unique microenvironment for the signaling of TCR gene rearrangements and positive and negative receptor selection.11 In contrast, ILC development is thought to occur in the bone marrow (BM) where committed ILC precursors differentiate before peripheral migration without further maturation in other lymphoid tissues.12-14 Intriguingly, however, a few previous studies and an elegant new lineage-tracing study suggest that ILC2s seed the periphery during perinatal development and that these cells then become tissue resident, turn over slowly, and expand locally thereafter.15-17 Furthermore, targeted deletion of E-box protein transcription factors and other essential regulators of T-cell development can lead to aberrant generation of ILC2s in the thymus, and these express TCR gene transcripts. Thus, in principal, the thymus could represent an additional source of ILC2s, particularly in situations in which the development of T cells is blocked.18
With regard to the expression of antigen-specific receptors, it is remarkable that despite being a major distinguishing hallmark between ILCs and T cells, few studies have evaluated the status of the TCR loci in ILCs. To date, only T-cell progenitors and occasional natural killer (NK) cells are proposed to undergo TCR gene rearrangement. Because of its critical dependence on the specialized microenvironmental niche provided by the thymus, the likelihood that this event occurs in any other hematopoietic lineage has been considered extremely low. Here, we performed a detailed evaluation of the TCR receptor gene loci and their transcripts in tissue-resident lung ILC2s. Strikingly, we find a high frequency of sterile TCRγ and β transcripts but not TCRδ and α in ILC2s. We also observe a high frequency of V-J gene rearrangements in their TCRγ chain loci and find that many of these cells have deleted 1 copy of the TCRδ chain locus. Although these DNA rearrangements are readily detectable, we discovered that few, if any, of the rearranged loci are transcribed, and instead transcripts preferentially arise from the germline loci. In addition, sequence analyses of DNA rearrangements suggest that the majority of predicted transcripts from these loci would fail to encode full-length TCR surface receptors because of either a high frequency of out-of-frame DNA rearrangements or a loss of the TCRδ locus. In aggregate, we find that ILC2s share far greater similarities to T cells than has previously been appreciated, and these argue for a parallel developmental pathway.
Materials and methods
Mice
C57BL/6J, TCRδ/β−/− (B6.129P2-Tcrdtm1MomTcrbtm1Mom/J) and Rag1−/− mice (originally from The Jackson Laboratories, Bar Harbor, ME) were all maintained in a pathogen-free environment at the Biomedical Research Centre. All experiments were performed according to the institutional and Canadian Council on Animal Care guidelines approved by the University of British Columbia Animal Care Committee.
Single-cell suspensions
Lungs from naïve wild-type (WT) mice were perfused with phosphate-buffered saline containing 2 mM EDTA and were then minced and digested with 200 U/mL collagenase IV (Sigma-Aldrich, St Louis, MO) for 35 minutes at 37°C. Samples were passed through a 70-μm cell strainer, and lymphocytes were enriched by using a standard Percoll separation. Residual red blood cells were lysed with Ack Lysing Buffer (Thermo Fisher Scientific, Waltham, MA) for 5 minutes at 4°C. Before antibody staining, cells (1.0 × 10⁷ to 2.0 × 10⁷) were incubated with anti-CD16/32 (2.4G2) to prevent nonspecific antibody binding. Splenic and thymic tissues were passed through a 40-μm cell strainer and treated with Ack Lysing Buffer for 7 minutes at 25°C to remove any remaining red blood cells.
Antibodies and fluorescence-activated cell sorting analyses
Fluorescein isothiocyanate–conjugated anti-mouse NK1.1 (PK136), CD11c (N418), Gr1 (RB6-8C5), CD11b (M1/70), CD8a (53.67), CD3ε (2C11), CD19 (1D3), CD3 (KT3), B220 (RA-6B2), CD4 (GK1.5), and CD5 (53-7.3); peripheral blood–conjugated anti-mouse CD45.2 (104) (eBioscience, San Diego, CA); allophycocyanin-conjugated anti-mouse CD90.2 (53-2.1) (eBioscience); phycoerythrin-conjugated anti-mouse CD25 (PC61) (BD Biosciences, San Jose, CA); phycoerythrin-Cy7–conjugated anti-mouse CD127 (SB/199); and PerCP-eFluor710–conjugated anti-mouse γδTCR (GL3) (eBioscience) were used for tissue-resident lung ILC2 isolation. γδT cells were sorted with peripheral blood–conjugated anti-mouse CD45.2 (104), FITC-conjugated anti-mouse CD3ε, CD3, and PerCP-eFluor710–conjugated anti-mouse γδTCR. Viable cells were identified using the eFluor 506 fixable viability dye (eBioscience). Staining and antibody dilutions were prepared in phosphate-buffered saline (Thermo Fisher Scientific) with 10% fetal bovine serum (Gibco) and 2 mM EDTA. Cell sorting and fluorescence-activated cell sorting analyses were performed on BD Influx, LSR-II, and Beckman Coulter Cytoflex cell sorters, respectively. Enrichment of splenic T cells was via the EasySep Mouse Biotin Positive Selection Kit II (Stemcell Technologies, Vancouver, BC, Canada).
Genomic PCR
Genomic DNA (gDNA) from isolated cells was extracted using DNeasy Blood and Tissue Kit (Qiagen, Hilden, Germany) and standard protocols. Quantity and purity (OD260/OD280 >1.8) were determined by spectrophotometry using Nanodrop ND-1000 (Nanodrop Technologies, Wilmington, DE). For assessing TCRγ and TCRδ, 20 μL of 40-ng gDNA, 5 μL of 2-μM forward and reverse TCRγ- and TCRδ-specific primers (supplemental Materials), and 25 μL of Taq polymerase chain reaction (PCR) Master Mix (Qiagen) were subjected to 35 cycles of PCR: 1 minute at 94°C, 1 minute at 55°C, 1 minute at 72°C, and 10 minutes at 72°C. TCRβ PCR design was as described by Brady et al,19 and thermocycling conditions were 3 minutes at 94°C followed by 35 cycles of 45 seconds at 94°C, 1 minute at 60°C, 1 minute at 72°C, and 10 minutes at 72°C. All PCR amplicons (1 μL) were analyzed using a QIAxcel Automated Capillary Gel Electrophoresis System (Qiagen).
Copy number variation assay
TCRδ loci were evaluated using real-time quantitative PCR (qPCR) and reagents from Applied Biosystems (Foster City, CA). On a per assay basis, the total reaction volume was 10 μL, containing 5 μL of TaqMan Fast Advance Master Mix, 0.5 μL of Custom TaqMan Copy Number Assay, 0.5 μL of TaqMan Copy Number Reference Assay (Mouse Tfrc), gDNA template, primers, probe, and nuclease-free water (supplemental Materials). Thermocycling conditions were 20 seconds at 95°C, followed by 40 cycles of 1 second at 95°C and 20 seconds at 60°C. Analyses were performed by using CopyCaller Software v2.1 provided by Applied Biosystems.
RT-PCR
Total RNA was extracted using Trizol LS (Ambion, Austin, TX) and reverse transcribed with a High Capacity cDNA Reverse Transcription Kit (Thermo Fisher Scientific). Complementary DNA (cDNA) samples for reverse transcription (RT)-PCR were equal to 150 ng RNA. TCRγ forward and reverse primers (supplemental Materials) were used to evaluate whether cells express full-length TCRγ transcripts. Thermocycling conditions were 3 minutes at 94°C, followed by 35 cycles of 1 minute at 94°C, 45 seconds at 50°C, 1 minute at 72°C, and 10 minutes at 72°C. All PCR amplicons (1 μL) were imaged using a QIAxcel Automated Capillary Gel Electrophoresis System.
Next-generation sequencing of PCR amplicons and analysis
To minimize errors during nucleotide addition in genomic PCR, Q5 Hot Start High Fidelity DNA polymerase (New England Biolabs, Ipswich, MA) was used instead of Taq polymerase when sequencing rearranged TCRγ loci in tissue-resident lung ILC2 and γδT-cell samples. Total reaction volume was 50 μL, containing 25 μL of Q5 Hot Start High-Fidelity 2X Master Mix, 6.25 μL of 2-μM forward and reverse primers, 18.75 μL of 4-ng gDNA, and nuclease-free water. Thermocycling conditions were as follows: 30 seconds at 98°C followed by 35 cycles of 10 seconds at 98°C, 30 seconds at 60°C, 20 seconds at 72°C, and 2 minutes at 72°C. PCR amplicons were then purified and sequenced using the Illumina MiSEQ sequencing platform with the read depth of 100 000 reads per sample at the BRC Sequencing Core (University of British Columbia, Vancouver, BC, Canada). Different combinations of rearranged TCRγ sequences were then analyzed bioinformatically with tcR, MiXCR, and vdjtools using standard parameters for gene alignment and sequencing error correction. Plots were generated on R Studio using ggplot2. High-throughput sequencing data are available at Gene Expression Omnibus (GEO) under accession number GSE152726.
Results
ILC subsets express TCR constant region genes
Previously, we used single-cell RNA sequencing (scRNA-seq) on cecal ILC subsets to better understand the role of the transcription factor RORα in ILC and NK cell lineage development and Crohn’s-like fibrotic disease.20 As with that study, single-cell libraries were aggregated on the basis of gene expression similarities, and cluster identities were defined by signature ILC subset genes.21,22 ILC1s, ILC2s, and ILC3s were represented in clusters 1 to 4, and NK cells were excluded for the purpose of this study (Figure 1A-B). Despite the fact that these fractions were rigorously depleted for surface CD3 and TCR expression, we found that all cecal ILC subsets display high-level expression of Cβ genes but differentially express Cδ, Cγ, and Cα transcripts. Specifically, transcripts of Cα are expressed at high levels predominantly by ILC1 and ILC3 clusters (clusters 1, 3, and 4), whereas Cγ expression is largely restricted to ILC1 and ILC2 clusters (clusters 1 and 2). Cδ transcripts were found to be limited to the ILC1 cluster, suggesting that ILCs transcribe a wide range of their TCR genes with a distinct and unusual locus bias (Figure 1C).
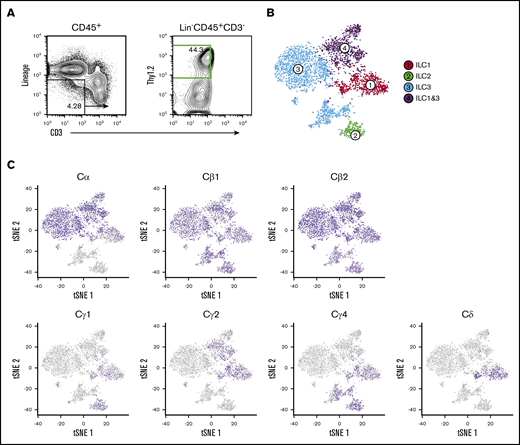
Cecal ILC subsets express transcripts of Cβ, Cα, Cγ, and Cδ. (A) Activated ILC subsets were sort-purified based on Lin–CD45.2+Thy1.2+CD3– surface markers (green) for droplet-based scRNA-seq analyses. (B) Unsupervised clustering of ILC subsets using Seurat R package. t-distributed stochastic neighbor embedding (tSNE) plots were generated to visualize graph-based clustering of single cecum ILC libraries. NK, T, and B cells were excluded from the analysis based on their signature mRNA expression profiles. (C) Distribution of TCR constant region gene expression in activated ILC subsets.
Cecal ILC subsets express transcripts of Cβ, Cα, Cγ, and Cδ. (A) Activated ILC subsets were sort-purified based on Lin–CD45.2+Thy1.2+CD3– surface markers (green) for droplet-based scRNA-seq analyses. (B) Unsupervised clustering of ILC subsets using Seurat R package. t-distributed stochastic neighbor embedding (tSNE) plots were generated to visualize graph-based clustering of single cecum ILC libraries. NK, T, and B cells were excluded from the analysis based on their signature mRNA expression profiles. (C) Distribution of TCR constant region gene expression in activated ILC subsets.
To confirm TCR constant region gene expression as a general feature of tissue-resident ILCs and rule it out as a unique feature of the high-turnover gut microenvironment, we conducted similar evaluations of TCR constant region genes in lung ILC2s, which are easily enriched from this tissue because of their abundance and slow turnover at steady state.15,17 Two rounds of purification were performed based on surface markers Lin–CD45.2+Thy1.2hiCD25+CD127+ γδTCR–, and T and NK cells were rigorously depleted using antibodies against NK1.1, CD3, CD4, CD8, and CD5 (Figure 2A).23 Before final lysis, sorted cells were evaluated for γδTCR surface expression to exclude any possibility of contamination (Figure 2B). Again, we observed selective expression of the constant region genes in a pattern similar to that seen in gut ILC2 subsets: strong expressions of Cγ and Cβ region genes whereas transcripts of Cδ and Cα were absent. As a further control for T-cell contamination, a similar population was isolated from Rag1−/− mice, which lack all T and B cells because of a lesion in VDJ recombinase expression.24 Interestingly, these ILC2s also showed Cγ and Cβ transcripts, which argues that these represent expression of sterile transcripts from unrearranged TCR alleles in ILC2s (Figure 2C). To independently verify this observation at the single-cell level, we performed scRNA-seq and observed that, likewise, the majority of cells expressed high levels of Cβ and Cγ4 messenger RNAs (mRNAs) whereas Cδ and Cα transcripts were largely absent.25 Intriguingly, these analyses also showed that virtually all cells expressing Cδ and Cα transcripts failed to express Cγ transcripts, consistent with the inability of these cells to ever express a functional TCR (Figure 2D). These data argue that several TCR loci are accessible and transcribed in ILC subsets.
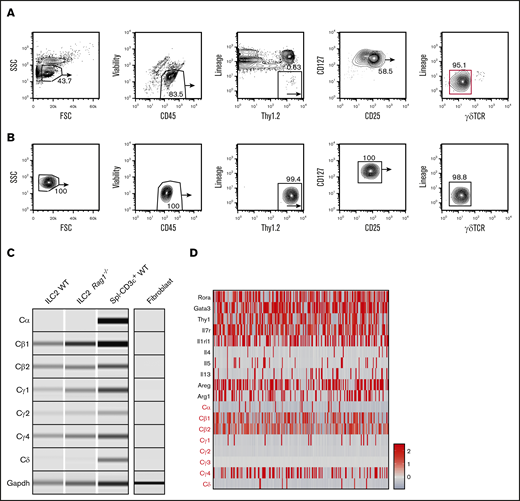
Lung ILC2s isolated from naïve WT mice also display high levels of TCR constant region transcripts. (A) Naïve lung ILC2s from adult WT mice were isolated based on CD45+Lin–Thy1.2+CD127+CD25+γδTCR– surface markers with 2 rounds of cell sorting (red gate). Lung tissues were pooled from 8 to 9 sex- and age-matched mice for optimal yield. (B) Fluorescence-activated cell sorting (FACS) plots showing enriched lung ILC2 population before downstream PCR analysis. The purified population was tested for potential γδT cell contamination. (C) RT-PCR was performed on both WT and Rag1−/− ILC2s to verify the expression of TCR constant region genes seen in cecal ILC2s. WT CD3+ splenocytes (Spl–CD3ε+ WT) were used as a positive control and fibroblasts cultured from fibro/adipogenic progenitors were used as a negative control for sterile TCR mRNA expression. Glyceraldehyde-3-phosphate dehydrogenase (Gapdh) primers were used as a loading control. (D) scRNA-seq analysis of independently sorted lung CD45+Lin–RORa+/− cells. ILC2 cluster was identified based on ILC2-specific gene expression (Areg, Il7r, Rora, Gata3) and a relative expression heatmap of TCR constant genes was created to complement the RT-PCR data. FSC, forward scatter; SSC, side scatter.
Lung ILC2s isolated from naïve WT mice also display high levels of TCR constant region transcripts. (A) Naïve lung ILC2s from adult WT mice were isolated based on CD45+Lin–Thy1.2+CD127+CD25+γδTCR– surface markers with 2 rounds of cell sorting (red gate). Lung tissues were pooled from 8 to 9 sex- and age-matched mice for optimal yield. (B) Fluorescence-activated cell sorting (FACS) plots showing enriched lung ILC2 population before downstream PCR analysis. The purified population was tested for potential γδT cell contamination. (C) RT-PCR was performed on both WT and Rag1−/− ILC2s to verify the expression of TCR constant region genes seen in cecal ILC2s. WT CD3+ splenocytes (Spl–CD3ε+ WT) were used as a positive control and fibroblasts cultured from fibro/adipogenic progenitors were used as a negative control for sterile TCR mRNA expression. Glyceraldehyde-3-phosphate dehydrogenase (Gapdh) primers were used as a loading control. (D) scRNA-seq analysis of independently sorted lung CD45+Lin–RORa+/− cells. ILC2 cluster was identified based on ILC2-specific gene expression (Areg, Il7r, Rora, Gata3) and a relative expression heatmap of TCR constant genes was created to complement the RT-PCR data. FSC, forward scatter; SSC, side scatter.
Lung ILC2s undergo TCRγ gene rearrangement while failing to properly rearrange TCRδ
We next evaluated the rearrangement status of the TCRγ, TCRδ, and TCRβ loci in WT naïve lung ILC2s. The murine TCRγ locus contains 4 variable (Vγ), joining (Jγ), and constant (Cγ) region clusters (supplemental Figure 1A), and PCR primers were designed to produce an amplicon of 350 to 600 bp from genomic V-J DNA segments that had undergone rearrangement.26 Six recombination permutations, Vγ2, Vγ3, Vγ4, Vγ5, Vγ1.1, and Vγ1.2 and their respective joining J segments (Jγ1, Jγ2, and Jγ4), were evaluated to fully profile all TCRγ gene rearrangements (Figure 3A).27 To our surprise, lung ILC2s exhibited the entire spectrum of possible V to J rearrangement combinations with the sole exception of Vγ1.1-Jγ4. To further confirm this result, ILC2s from adult Rag1−/− mice were sorted and tested in parallel. As expected, no such TCRγ gene rearrangements were detected in recombinase-deficient cells. In technical and biological replicates (n = 6), WT ILC2s consistently exhibited Vγ2-Jγ1 and Vγ1.2-Jγ2 gene rearrangements whereas Vγ3-Jγ1, Vγ4-Jγ1, and Vγ5-Jγ1 gene rearrangements proved more variable between samples. Evaluation of lung γδT cells revealed that although these also exhibited DNA rearrangements, the pattern of Vγ usage was consistently distinct from that of ILC2s, further arguing against the likelihood of γδT cells contaminating ILC2 preparations. In summary, our data suggest that ILC2s undergo T-cell–type TCRγ gene rearrangements.
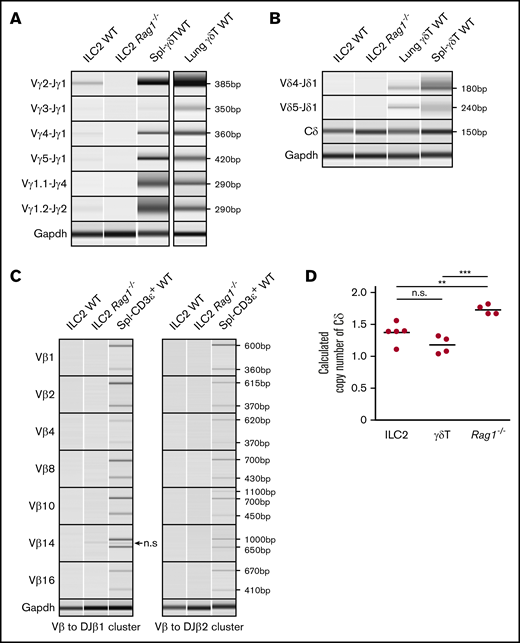
TCRγ locus is rearranged and TCRδ locus is deleted in ILC2s. (A-C) Genomic PCR of select TCRγ, TCRδ, and TCRβ gene rearrangement permutations in lung ILC2s. (Α-Β) Splenic γδT cells and lung γδT cells were used as positive controls and (A-C) lung ILC2s from Rag1−/− mice were used as a negative control. Nonspecific (n.s.) amplicon in panel C is marked by an arrow. Gapdh was used as a control for genomic PCR. (D) Copy number variation assay of WT lung ILC2s and γδT cells by real-time qPCR. Splenocytes from Rag1−/− mice were used as a reference since they retain 2 copies of germline TCRδ alleles. Significance was determined by Student t test. **P < .01; ***P < .001. n.s., not significant (panel D).
TCRγ locus is rearranged and TCRδ locus is deleted in ILC2s. (A-C) Genomic PCR of select TCRγ, TCRδ, and TCRβ gene rearrangement permutations in lung ILC2s. (Α-Β) Splenic γδT cells and lung γδT cells were used as positive controls and (A-C) lung ILC2s from Rag1−/− mice were used as a negative control. Nonspecific (n.s.) amplicon in panel C is marked by an arrow. Gapdh was used as a control for genomic PCR. (D) Copy number variation assay of WT lung ILC2s and γδT cells by real-time qPCR. Splenocytes from Rag1−/− mice were used as a reference since they retain 2 copies of germline TCRδ alleles. Significance was determined by Student t test. **P < .01; ***P < .001. n.s., not significant (panel D).
We used a similar genomic PCR strategy to evaluate TCRβ and TCRδ rearrangements. The TCRβ locus contains 23 functional Vβ segments and 2 Dβ-Jβ-Cβ clusters (supplemental Figure 1C)28 ; thus, designing PCR primers for its entire repertoire was impractical. Instead, we adapted the PCR strategy from Brady et al19 to assess 14 possible permutations. ILC2s exhibited no VDJ rearrangements in their TCRδ or TCRβ loci in stark contrast to control γδT cells (Figure 3B-C). Because the TCRδ locus is nestled between Vα and Jα segments of the TCRα locus, we also sought to ensure that our failure to detect TCRδ rearrangements was not a result of a deletion of the locus during TCRα gene rearrangement (supplemental Figure 1D). To test this, qPCR-based copy number variation assessment of Cδ was compared between lung ILC2s, γδT cells, and Rag1−/− splenocytes. Surprisingly, both lung ILC2s and γδT cells exhibited a calculated Cδ copy number of 1, indicating that, on average, 1 TCRδ allele is missing in these cells (Figure 3D), whereas Rag1−/− splenocytes exhibited the expected 2 copies. These data would argue that some of the V segments shared by TCRα and TCRδ loci29 may rearrange to Jα segments during TCRδ gene rearrangement process in ILC2s. In aggregate, these data provide clear evidence that lung ILC2s undergo TCRγ gene rearrangement and ineffectively recombine the TCRδ locus.
Lung ILC2s transcriptionally silence rearranged Vγ loci while maintaining sterile Cγ expression
To test whether the rearranged TCRγ loci are expressed in mature ILC2s, the complementary-determining region 3 (CDR3) containing sequences from Vγ, Jγ, and Cγ segments was amplified via RT-PCR.26,30 Although we consistently obtained products of the expected size for rearranged TCRγ loci transcripts in γδT cells, we failed to detect similar amplicons in ILC2s (Figure 4A). To further confirm this result we assayed Vγ to Jγ regions in the total RNA to rule out the possibility of unprocessed pre-mRNAs being present. Consistent with the previous findings, we detected no rearranged TCRγ pre-mRNAs in these cells (Figure 4B). On the basis of our previous ability to consistently detect Cγ transcripts in ILC2s by scRNA-seq (Figures 1C and 2D), we conclude that although ILC2s are able to rearrange their TCRγ loci, they fail to transcribe the rearranged alleles, and instead the Cγ transcripts detected in ILC2s are selectively produced by non-rearranged TCRγ constant regions in these cells. Taken together, these results indicate that in ILC2s, rearranged TCRγ loci are transcriptionally silenced while sterile Cγ transcripts are permitted from the non-rearranged alleles.
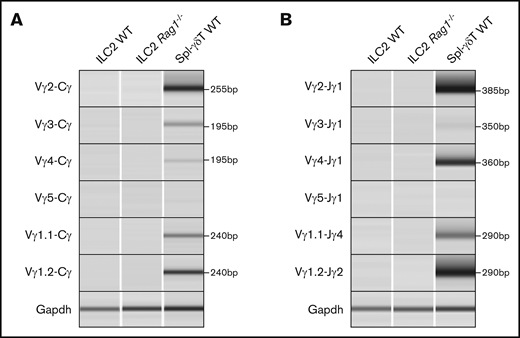
ILC2s do not transcribe the rearranged TCRγ locus. (A) cDNA libraries from lung ILC2s were subjected to RT-PCR for full-length TCRγ transcripts (Vγx-Cγ). (B) Pre-mRNA (Vγx-Jγx) RT-PCR was also performed to rule out the possibility of unprocessed TCRγ mRNAs. ILC2s from Rag1−/− mice and splenic γδT cells (Spl-γδT WT) were used as a negative and positive control, respectively. Gapdh was used as a control to test for cDNA content.
ILC2s do not transcribe the rearranged TCRγ locus. (A) cDNA libraries from lung ILC2s were subjected to RT-PCR for full-length TCRγ transcripts (Vγx-Cγ). (B) Pre-mRNA (Vγx-Jγx) RT-PCR was also performed to rule out the possibility of unprocessed TCRγ mRNAs. ILC2s from Rag1−/− mice and splenic γδT cells (Spl-γδT WT) were used as a negative and positive control, respectively. Gapdh was used as a control to test for cDNA content.
A high frequency of nonproductive TCRγ locus rearrangements in the ILC2 lineage
Because lung ILC2s fail to express transcripts from the rearranged TCRγ loci, we hypothesized that this may reflect transcriptional silencing of alleles that have undergone unsuccessful/nonproductive V(D)J recombination. To address this, we sequenced the genomic PCR products from lung ILC2s and γδT cells. Vγ2-Jγ1 and Vγ1.2-Jγ2 rearrangement combinations were compared because of their frequent rearrangement in both lung ILC2s and γδT cells (Figure 3A). Comparison of sequence diversity of the rearranged TCRγ genes (caused by random rearrangement events) between these 2 cell types showed that lung ILC2s exhibit a lesser degree of potential TCRγ clonotypes than γδT cells, which indicates that if ILC2s were to express TCR proteins from these alleles, they would exhibit a fairly limited repertoire compared with their γδT cells counterparts (Figure 5A). Strikingly, when characterizing the frequency of in-frame and out-of-frame rearrangements of the top 20 potential clonotypes, we found that nonfunctional clonotypes of Vγ2-Jγ1 constituted, on average, 78% of the population in lung ILC2s in contrast to 31% in γδT cells. In addition, potential Vγ1.2-Jγ2 clonotypes of both ILC2s and γδT cells displayed a higher proportion of nonfunctional clonotypes than their functional counterparts (Figure 5B-C). To summarize, we find that lung ILC2s fail to express their rearranged TCRγ loci and that this correlates with a high frequency of nonproductive TCRγ chain rearrangements.
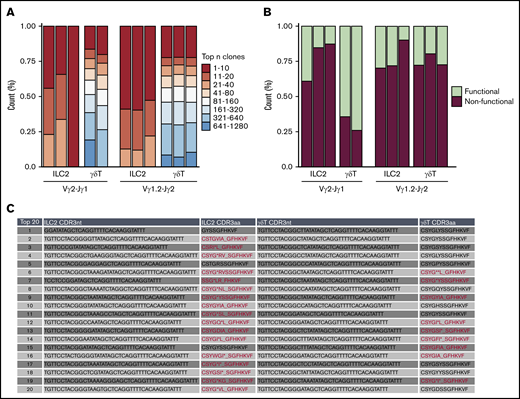
Frequent nonproductive TCR locus rearrangements in the ILC2 lineage. Bulk next-generation sequencing of rearranged genomic Vγ2-Jγ1 and Vγ1.2-Jγ2 amplicons of lung ILC2s and γδT cells isolated from WT mice. Data were collected from 2 independent sequencing runs. (A) tcR pipeline was used to compare TCRγ clonotype diversity between ILC2s and γδT cells. (B) Relative abundance of in-frame or out-of-frame TCRγ gene rearrangement of top 20 most frequent clonotypes was calculated using MiXCR and vdjtools. (C) In-depth CDR3 sequence analysis of top 20 Vγ2 repertoire. Representative ILC2 and γδT samples were chosen to portray the characteristics of nonfunctional and functional Vγ2-Jγ1. Nonfunctional CDR3 amino acid sequences (CDR3aa) are highlighted in red. (*) Demarcates premature stop codons and (_) denotes frameshifts caused by indels.
Frequent nonproductive TCR locus rearrangements in the ILC2 lineage. Bulk next-generation sequencing of rearranged genomic Vγ2-Jγ1 and Vγ1.2-Jγ2 amplicons of lung ILC2s and γδT cells isolated from WT mice. Data were collected from 2 independent sequencing runs. (A) tcR pipeline was used to compare TCRγ clonotype diversity between ILC2s and γδT cells. (B) Relative abundance of in-frame or out-of-frame TCRγ gene rearrangement of top 20 most frequent clonotypes was calculated using MiXCR and vdjtools. (C) In-depth CDR3 sequence analysis of top 20 Vγ2 repertoire. Representative ILC2 and γδT samples were chosen to portray the characteristics of nonfunctional and functional Vγ2-Jγ1. Nonfunctional CDR3 amino acid sequences (CDR3aa) are highlighted in red. (*) Demarcates premature stop codons and (_) denotes frameshifts caused by indels.
Because successful thymic T-cell development is strongly tied to expression and signaling via the products of productive TCR gene rearrangements, we sought to further evaluate whether nonproductive TCR rearrangements could influence the proportion of ILC2s in vivo. We assessed the frequency of thymic, splenic, and lung ILC2s in adult WT, Rag1−/−, and Tcrδ/β−/− mice and examined their absolute numbers and frequencies compared with the total CD45+ cells. Like RAG-deficient mice, Tcrδ/β−/− mice also lack functional T lymphocytes because their T-cell progenitors cannot express surface TCRs during development, but they are distinct in that their recombination machinery is still functional.31,32 We find that, in steady-state conditions, both Rag−/− and Tcrδ/β−/− mice exhibit a substantial increase in ILC2 frequency and number compared with the population observed in WT mice (Figure 6A-B). We also observe that this increase is less dramatic in Tcrδ/β−/− mice; however, this likely reflects the fact that these mice are still capable of generating B cells, which serve to dilute the frequency of ILC2s when compared with T-cell– and B-cell–deficient Rag−/− mice (Figure 6B). Of note, the CD127+CD25hi population in the thymi of these knockout strains do not express ST2 (IL-33R) (supplemental Figure 2) nor do they express CD44 (data not shown), which confirms that these are indeed double-negative (DN) cells arrested at the CD44–CD25+ stage of thymopoiesis.33 Collectively, we conclude that failure to initiate TCR gene rearrangement or express functional TCR could causes developing T cells to abort T-cell development and re-route into the ILC2 lineage.
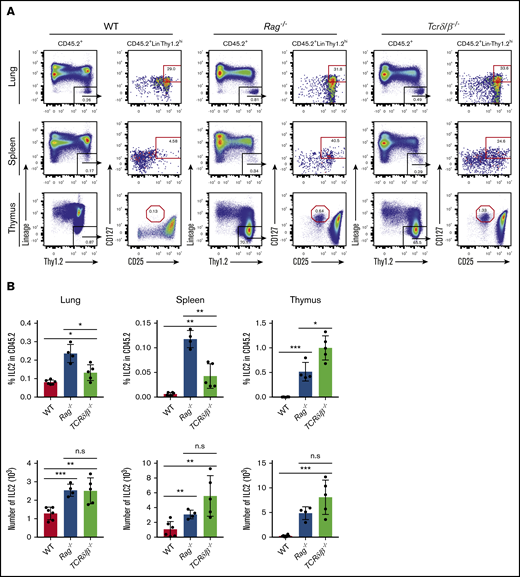
Evaluation of ILC2 frequency in models that are incapable of generating functional T cells. (A) Thymus, spleen, and lung tissues were isolated and put into single-cell suspensions from adult (7 to 10 weeks old) WT, Rag1−/− and Tcrδ/β−/− mice. ILC2 frequency and absolute number were measured using the gating strategy shown in the representative FACS plots. ILC2s were characterized based on CD45.2+Lin–Thy1.2hiCD25+CD127+ surface markers, and the data were collected on a Beckman Coulter Cytoflex flow cytometer. (B) Percent frequencies of ILC2s in total CD45.2+ cells and their total numbers in the thymus, spleen, and lung. Significance was determined by Student t test (n > 4). *P < .05; **P < .005; ***P < .0005; P < .0001 is not labeled. Representative data from 2 independent experiments are shown.
Evaluation of ILC2 frequency in models that are incapable of generating functional T cells. (A) Thymus, spleen, and lung tissues were isolated and put into single-cell suspensions from adult (7 to 10 weeks old) WT, Rag1−/− and Tcrδ/β−/− mice. ILC2 frequency and absolute number were measured using the gating strategy shown in the representative FACS plots. ILC2s were characterized based on CD45.2+Lin–Thy1.2hiCD25+CD127+ surface markers, and the data were collected on a Beckman Coulter Cytoflex flow cytometer. (B) Percent frequencies of ILC2s in total CD45.2+ cells and their total numbers in the thymus, spleen, and lung. Significance was determined by Student t test (n > 4). *P < .05; **P < .005; ***P < .0005; P < .0001 is not labeled. Representative data from 2 independent experiments are shown.
Discussion
In this article, we re-evaluate the key distinguishing feature between T cells and ILCs: TCR recombination and mRNA expression. TCR gene rearrangements have long been held as the key hallmark of T-cell commitment because T cells require antigen-specific receptors to survive, proliferate, and mount an effective immune response.34 Strikingly, both scRNA-seq and RT-PCR show that sterile TCR constant region transcripts are expressed at high frequencies in cecal and lung ILC2s. Furthermore, lung ILC2s undergo TCRγ locus recombination and deletion of 1 allele of the TCRδ locus. In-depth sequence analyses of rearranged TCRγ loci in these cells reveal a lesser degree of sequence diversity than conventional γδT cells and that these predicted clonotypes, if expressed, would be largely nonfunctional because of out-of-frame TCRγ rearrangements. Furthermore, scRNA-seq data suggest that single cells actively transcribe either TCRγ or TCRδ loci, but not both, which would further preclude the opportunity to produce a functional surface receptor. Consistent with previous studies in Rag1−/− mice, our results also suggest that ILC2s can efficiently develop in mice in the absence of TCR recombination machinery. That aside, the fact that these cells frequently express sterile transcripts from the TCR gene loci and, at some stage in their development, have initiated gene rearrangements typical of γδT cells argues for a closely related developmental pathway.
TCR gene rearrangements are thought to occur exclusively within the thymic microenvironment, and we and others have observed an increased frequency of ILC2s in RAG-deficient mouse thymus, spleen, and lung tissue.35-37 Our data suggest that a failure to appropriately rearrange TCR loci in the thymus may offer an opportunity to shunt failed T cells into the ILC2 lineage. This view aligns well with data gleaned from mice with lesions in essential machinery for T-cell development. Qian et al18 showed that when Id1 was ectopically expressed in T-cell progenitors to inhibit all E-protein activities, including E2A and HEB transcription factors, the result was a striking increase in the frequency of ILC2s in the thymus, spleen, blood, and lung. Furthermore, lineage tracing experiments using plck-Cre reporter mice, which labels cells that have undergone thymic maturation, reveals that a higher percentage of lung ILC2s come from the thymus.38 It is also noteworthy that in vitro studies of DN1 and DN2 cells in OP9-DL1 cultures treated with IL-7 and IL-33 show that these cells have the potential to become ILC2s despite the fact that EILP and ETP gene expression signatures are phenotypically distinct.39,40 These data are consistent with a model in which DN2 to DN3 stage CD127hi γδT-cell progenitors that fail to productively rearrange γ and δ chains are shunted away from the T-cell development and undergo further development as ILC2s. Previous researchers have shown that this phenomenon can occur in the context of mutant animals or stromal cell cultures, but the data presented here, using gene rearrangements as a lineage tracer, suggest that this can also occur naturally as a byproduct of normal T-cell development in vivo.
These observations are in sharp contrast to the current dogmatic view that ILC development occurs exclusively in the bone marrow and argue instead that early ILC precursors may transit the thymus before seeding barrier organs. Further support for this view comes from a recent, elegant, pulse-labeling study to trace the development and turnover of ILC2s in peripheral tissues in mice. These studies concluded that most, if not all, tissue-resident ILC2s arise perinatally at a stage coinciding with the peak of thymic γδT cell production. Strikingly, this study also found that once they establish residence in peripheral tissues, ILC2s turn over very slowly and self-renew within the peripheral tissue microenvironments. These authors also found that BM ILC2s also turn over with extremely slow kinetics (weeks to months rather than days), which would be unexpected if the BM were a constant source of peripheral ILC2s.15 It is highly possible that these resident cells instead have a functional role and modulate the Th2 immune axis by regulating eosinophil development and production.41,42 Thus, the evidence to suggest that adult BM contains ILC2 precursors that seed peripheral tissues at high frequency during steady-state homeostasis is limited. Indeed, it is more likely that ILC2s present in the periphery represent tissue-resident cells that expand locally similar to long-lived macrophages and connective tissue mast cells that colonize the peripheral tissues early in life and are only replenished by bone marrow progenitors in crisis situations of severe inflammation or peripheral ablation.43-45 In aggregate, these data suggest that the ILC2s detected in most adult tissues are the local progeny of cells that developed in parallel to perinatal T lymphocytes and that have likely transited the thymus during their life history. Future studies pairing detailed evaluation of gene rearrangements at the single-cell level in the first vanguard of ILCs that colonize peripheral tissues during development and those that persist during later life may help clarify this issue.
Acknowledgments
The authors thank Biomedical Research Centre core members W. Yuan (animal care), M. Williams (protein), A. Johnson, J. Wong (cell sorting), and R. Dhesi (media). The authors are also deeply indebted to Max D. Cooper (Emory University) and Peter D. Burrows (University of Alabama at Birmingham) for their advice and helpful suggestions
This work was funded by grants from the Canadian Institutes of Health Research (PJT-148681) and AllerGen Network Centre of Excellence (18B and B11). S.B.S. was funded by an AllerGen Network Centre of Excellence and Canadian Institutes of Health Research (CIHR) Frederick Banting & Charles Best Canada Graduate Scholarship–Master’s Program (CGS-M) Scholarship. M.M. was supported by Mitacs Canadian Science Policy Fellowship IT10208.
Authorship
Contribution: S.B.S., B.C.L., Y.L., M.M., J.C., and T.M. performed experiments; S.B.S., B.C.L., D.C.H., M.R.H., K.M.M., and F.T. contributed to experimental design and data analysis; M.G., and F.T. carried out an independent scRNA-seq experiment and analyzed transcriptome data; R.W.S. and T.M.U. performed transcriptome analysis; K.B.L. and F.T. contributed to manuscript preparation; and S.B.S. and K.M.M. wrote the manuscript.
Conflict-of-interest disclosure: The authors declare no competing financial interests.
Correspondence: Kelly M. McNagny, University of British Columbia, The Biomedical Research Centre, 2222 Health Sciences Mall, Vancouver, BC V6T 1Z3, Canada; e-mail: kelly@brc.ubc.ca.

