

Key Points
Obesity promotes an altered HSC state, quiescent and stress-resistant but prone to activation in a regenerative condition.
Among obesity metabolic sequelae, hyperglycemia impairs the AKT-FOXO regulatory axis and disrupts normal FOXO oxidative stress response.

Abstract
Hematopoietic stem cell (HSC) activity is tightly controlled to ensure the integrity of the hematopoietic system during the organism’s lifetime. How the HSC compartment maintains its long-term fitness in conditions of chronic stresses associated with systemic metabolic disorders is poorly understood. In this study, we show that obesity functionally affects the long-term function of the most immature engrafting HSC subpopulation. We link this altered regenerative activity to the oxidative stress and the aberrant constitutive activation of the AKT signaling pathway that characterized the obese environment. In contrast, we found minor disruptions of the HSC function in obese mice at steady state, suggesting that active mechanisms could protect the HSC compartment from its disturbed environment. Consistent with this idea, we found that FOXO proteins in HSCs isolated from obese mice become insensitive to their normal upstream regulators such as AKT, even during intense oxidative stress. We established that hyperglycemia, a key condition associated with obesity, is directly responsible for the alteration of the AKT-FOXO axis in HSCs and their abnormal oxidative stress response. As a consequence, we observed that HSCs isolated from a hyperglycemic environment display enhanced resistance to oxidative stress and DNA damage. Altogether, these results indicate that chronic metabolic stresses associated with obesity and/or hyperglycemia affect the wiring of the HSCs and modify their oxidative stress response. These data suggest that the uncoupling of FOXO from its environmental regulators could be a key adaptive strategy that promotes the survival of the HSC compartment in obesity.
Introduction
Lifelong maintenance of the blood system requires the preservation of a healthy hematopoietic stem cell (HSC) pool. The integrity of the HSC compartment is disrupted by intense homeostatic perturbations such as acute inflammatory episodes, severe infection, or hematopoietic injury linked to chemotherapy and radiotherapy toxicity.1-3 HSC homeostasis is also affected by organismal pathophysiological conditions that promote chronic low-grade stress. These long-term conditions associated with hygiene, nutrition, or lifestyle directly affect the hematopoietic tissue and modulate the HSC native state.4 Less acute but persistent over time, these conditions present a unique challenge to the maintenance of the long-lived HSCs. However, the mechanisms by which the HSC pool adapts to chronic stress conditions remain largely unknown. It is also unknown how these types of stresses could contribute to aging or the development of hematologic pathologies.
In this context, we focused on obesity as a source of chronic stress that may affect the health of the long-lived HSC compartment.5 Obesity is a chronic pathological state, which is established and persist over time while developing an array of low-grade systemic and local alterations. Obesity is associated with systemic metabolic dysregulations, unresolved inflammation, and alteration of the bone marrow microenvironment, all conditions that have been linked to HSC defects.6-10 Consistent with these studies, we recently showed that obesity induces a change in the architecture of the HSC compartment that leads to its progressive loss of fitness in regenerative conditions.11 We linked these characteristics to the chronic presence of oxidative stress in obesity that induces the upregulation of the transcription factor Gfi1. Notably, we demonstrated the dual role of Gfi1 in modulating the quiescence of HSCs at steady state and in contributing to their altered regenerative function upon transplantation.
Here we refine these previous findings by demonstrating that, beyond altering the composition of the HSC compartment, obesity and its sequelae also have an impact on the regenerative capacity of the most immature HSC subset. We show that constitutive AKT activation in obesity is a key contributor to these functional alterations in regenerative conditions. In turn, this reveals the paradoxical HSC ability to maintain quiescence despite the presence of high oxidative stress and basal AKT activity associated with obesity.12,13 We establish that disruption of the AKT-FOXO axis is a key feature of the HSC compartment in obesity. Notably, we show that hyperglycemia alters the FOXO response to oxidative stress in HSCs and increases their resistance to oxidative stress. Altogether, this article shows how systemic metabolic alterations such as hyperglycemia could have an impact on HSC regulation. It highlights a mechanism that HSCs could use to adapt to a chronically abnormal metabolic environment and suggests potential costs for this adaptation.
Methods
Additional descriptions of the experimental methods are available in supplemental Methods.
Mice
C57BL/6 wild-type, Leprdb/db (db) (#000697), Leprob/ob (ob) (#000632), MS-NASH (#030888), Ins2Akita (#003548), Nkx2-1-cre (#008661), LepRfl/fl (#008327), and C57BL/6 congenic mice (PtprcaPepcb/BoyJ; #002014) were purchased from The Jackson Laboratory. Nkx2-1-cre::LepRfl/fl mice were generated as previously described.11 Ldlr−/− (#002207) and Apoe−/− (#002052) were kindly provided by David Hui, PhD (University of Cincinnati). Age- and sex-matched littermates were used as controls with the exception of the MS-NASH model for which age- and sex-matched C57BL/6 mice were used as controls. Blood glucose was measured by using an Accu-Chek Performa glucometer. Animals were housed at the American Association for Accreditation of Laboratory Animal Care–accredited animal facility of the Cincinnati Children’s Hospital Medical Center (CCHMC). All experiments were approved by the CCHMC Institutional Animal Care and Use Committee.
Statistics
Statistical analyses were performed using GraphPad Prism (v8, GraphPad). Differences between 2 groups were assessed using unpaired, 2-tailed Student t tests. Data involving more than 2 groups were assessed by 2-way analysis of variance with Tukey’s or Sidak’s post hoc test.
Results
Erosion of the HSC self-renewal function in obesity
For this study, we used the LepRdb/db mouse model of obesity (hereafter called “db”) which carries an inactivating genetic mutation of the leptin receptor. The db mice rapidly accumulate adipose tissue and develop several of the metabolic sequelae associated with obesity such as hyperinsulinemia, hyperglycemia, and dyslipidemia. We recently reported that obesity in db mice was associated with changes in the cellular architecture of the HSC-signaling lymphocytic activation molecule (HSC-SLAM) compartment.11 Using the CD49b (integrin α2) marker alongside the marker panel that identifies the HSC fraction (ie, Lin–c-Kit+Sca1+CD48–CD150+), we confirmed that the db HSC compartment was enriched for the most immature CD34– HSC subset, particularly for the CD49b+ fraction (Figure 1A-B; supplemental Figure 1A).14 In CD34– HSCs, we found that CD49b inversely correlates with EPCR (PROCR/CD201) and observed similar changes in HSC subpopulations based on EPCR expression (supplemental Figure 1A [right panel],B).15 In contrast, we did not observe any alteration in CD41 (integrin α2b) expression, which marks HSC myeloid commitment and aging (supplemental Figure 1C).16,17
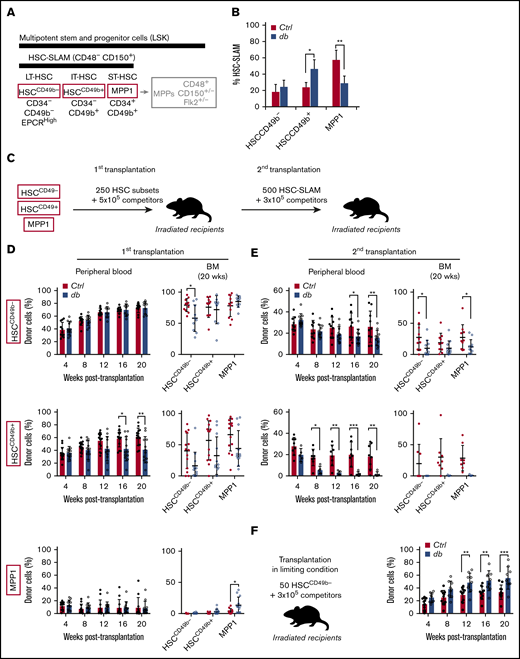
Progressive erosion of the HSC self-renewal potential in obesity. (A) Scheme showing the phenotypic definition of HSC subsets in the HSC-SLAM compartment. IT, intermediate term; LT, long term; ST, short term. (B) Mean percentage ± standard deviation (SD) of HSC subsets (defined by CD34 and CD49b expression) that composed the HSC-SLAM compartment in the bone marrow (BM) of 4-month-old control (Ctrl) and db mice (n = 3). (C) Experimental scheme used to functionally test HSC subsets in a serial transplantation assay. (D-E) Serial competitive transplantation assays in nonlimiting conditions for HSCCD49b– (upper panels), HSCCD49b+ (central panels) and MPP1 (lower panels) subsets isolated from the BM of 4-month-old control and db mice. Hematopoietic reconstitution in primary (D) and secondary (E) recipients. Graphs indicate peripheral blood (PB) chimerism over time (left) and BM chimerism for HSC subsets 20 weeks after transplantation (right). Results from 2 independent experiments are expressed as means ± SD (n = 9-14 for primary and n = 5-11 for secondary transplantation). (F) Competitive transplantation assay for HSCCD49b– subsets in limiting condition (50 cells per recipient). Graphs indicate PB chimerism over time (n = 9-11). Results from 2 independent experiments are expressed as means ± SD. Two-way ANOVA with Sidak’s post hoc test; *P ≤ .05; **P ≤ .01; ***P ≤ .005.
Progressive erosion of the HSC self-renewal potential in obesity. (A) Scheme showing the phenotypic definition of HSC subsets in the HSC-SLAM compartment. IT, intermediate term; LT, long term; ST, short term. (B) Mean percentage ± standard deviation (SD) of HSC subsets (defined by CD34 and CD49b expression) that composed the HSC-SLAM compartment in the bone marrow (BM) of 4-month-old control (Ctrl) and db mice (n = 3). (C) Experimental scheme used to functionally test HSC subsets in a serial transplantation assay. (D-E) Serial competitive transplantation assays in nonlimiting conditions for HSCCD49b– (upper panels), HSCCD49b+ (central panels) and MPP1 (lower panels) subsets isolated from the BM of 4-month-old control and db mice. Hematopoietic reconstitution in primary (D) and secondary (E) recipients. Graphs indicate peripheral blood (PB) chimerism over time (left) and BM chimerism for HSC subsets 20 weeks after transplantation (right). Results from 2 independent experiments are expressed as means ± SD (n = 9-14 for primary and n = 5-11 for secondary transplantation). (F) Competitive transplantation assay for HSCCD49b– subsets in limiting condition (50 cells per recipient). Graphs indicate PB chimerism over time (n = 9-11). Results from 2 independent experiments are expressed as means ± SD. Two-way ANOVA with Sidak’s post hoc test; *P ≤ .05; **P ≤ .01; ***P ≤ .005.
The coincidence of the changes in the architecture of the HSC-SLAM compartment in obesity with the changes in its activity upon transplantation prompted us to analyze the function of the individual HSC subsets.11 We performed competitive transplantation assays into lean recipients, using nonlimiting conditions (250 cells per recipient) to compare side-by-side the different purified HSC fractions (Figure 1C; supplemental Figure 1D). As described by others, we found an extreme functional diversity between control HSC subsets (Figure 1D-E).18,19 The Lin–c-Kit+Sca1+CD48–CD150+CD34+ MPP1 subset showed limited long-term repopulation and self-renewal ability and was unable to regenerate any CD34– HSC-SLAM subpopulations (Figure 1D, lower panel). Both CD49b– and CD49b+CD34– HSC-SLAM subsets showed extended blood reconstitution activity (Figure 1D, upper and middle panels). We confirmed that the HSCCD49b– subset (Lin–c-Kit+Sca1+CD48–CD150+CD34–CD49b–) displays a strong self-renewal potential because it efficiently contributes to all HSC-SLAM subsets.19 However, the HSCCD49b+ subset (Lin–c-Kit+Sca1+CD48–CD150+CD34–CD49b+) showed a heterogeneous functional profile, consistent with the idea that it constitutes a transitional stage between HSCCD49b– and MPP1 compartments. This hierarchy within the CD34– HSC-SLAM subsets was reinforced in secondary transplantation in which HSCCD49b– showed more robust reconstitution and self-renewing functions (Figure 1E). HSC subsets isolated from the db mouse model displayed the same functional organization as their control counterparts (Figure 1D). We found minimal effects of obesity on the most mature MPP1 (Figure 1D, lower panel).
In contrast, obesity promoted the progressive erosion of the reconstitution and self-renewal abilities of both HSCCD49b– and HSCCD49b+ subsets (Figure 1D, upper and middle panels). These effects were striking in the HSCCD49b– subset, which showed a significant reduction of its self-renewal capacity in primary and secondary transplantation (Figure 1E).
To explain this functional loss, we repeated this transplantation assay with a limiting number of HSCCD49b– cells (50 cells per recipient). In this condition, db HSCCD49b– cells produce more mature cells than their normal counterparts, leading to higher blood chimerism in recipient mice (Figure 1F). This phenomenon, which was not apparent in the previous nonlimiting saturating transplantation conditions, suggests an aberrant hyperactivation of db HSCCD49b– in the regenerative condition. It indicates that the dual behavior (overactivity and exhaustion) of the immature db HSCCD49b– subset upon serial transplantation (Figure 1D-E) is likely a result of its progressive skewing toward differentiation at the expense of self-renewal. Altogether, these results are consistent with our previous report, which described a loss of fitness of the HSC-SLAM compartment in obesity.11 They further establish that the alteration of the HSC-SLAM composition does not fully explain this phenotype. Instead, these results demonstrate the disruption of the intrinsic mechanisms regulating self-renewal activity in the most immature HSC subset phenotypically identified so far.
Constitutive activation of the AKT pathway in obesity
Our functional data indicate that the most immature HSC subset is prone to exacerbated activation under transplantation-induced regenerative stress. To determine the mechanisms driving this aberrant activity, we reanalyzed the previously published genome-wide gene expression analyses on HSC-SLAMs isolated from 4-month-old control and db mice (Gene Expression Omnibus accession number: GSE90725).11 In HSC-SLAMs from obese db mice, gene set enrichment analyses showed the upregulation of a set of genes related to metabolic processes involving lipid synthesis and glycolysis along with a set of genes associated with signal transduction, such as the PI3K-AKT-mTOR pathway (Figure 2A). Manually curated data identified a large set of dysregulated genes that are linked to the phosphatidylinositol pathway, upstream of the AKT signaling molecule (Figure 2B). The threonine/serine kinase AKT was an attractive candidate in the context of obesity in which HSCs have been shown to experience chronic oxidative stress.11,20 Indeed, AKT has a well-described association with oxidative stress, with AKT hyperactivation being associated with the generation of reactive oxygen species (ROS)21 and oxidative stress being known to trigger AKT activation.22 Consistent with the gene expression profile, phospho-flow cytometry analyses showed that freshly isolated db HSCs display constitutive AKT activation, as indicated by S473 phosphorylation (Figure 2C). Importantly, we did not detect the activation of other signaling pathways such as JAK-STAT and RAS-MEK-ERK pathways in db HSCs at steady state (Figure 2C; data not shown).
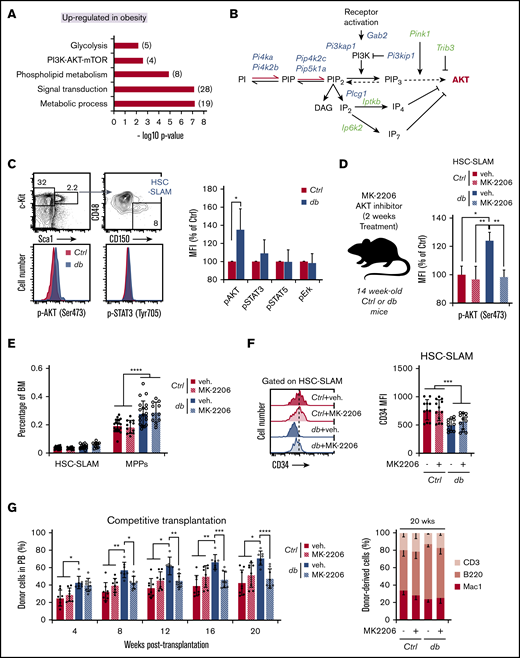
Impact of constitutive AKT activation on HSC function in obesity. (A) Gene set enrichment analysis (GSEA) for upregulated genes in db HSC-SLAMs. Numbers in parentheses show the number of genes in indicated gene sets. (B) Scheme of manually curated upregulated (blue) and downregulated (green) genes in HSC-SLAMs identified by genome-wide gene expression analysis and linked to the phosphatidylinositol pathway and AKT signaling. (C) Representative fluorescence-activated cell sorting (FACS) plot and histogram (left panel) showing the gating strategy and levels of AKT and STAT3 phosphorylation in the HSC-SLAM compartment isolated from the BM of 4-month-old control and db mice. Right panel shows relative average mean fluorescence intensity (MFI) ± standard deviation (SD) of AKT, STAT3, STAT5, and pERK phosphorylation in db HSCs compared with control (n = 5). Student t test; *P ≤ .05. (D) Experimental scheme for in vivo pharmacologic AKT inhibition (left panel). Right panel shows relative average MFI ± SD of AKT phosphorylation in each experimental group (n = 3). Two-way ANOVA with Tukey’s post hoc test; *P ≤ .05; **P ≤ .01. (E) Mean percentage ± SD of HSC-SLAMs and MPPs (LSK CD48+) in the BM of 4-month-old control and db mice treated with vehicle (veh) or the AKT inhibitor MK-2206 for 2 weeks (n = 12-20 from 5 independent cohorts). Two-way ANOVA with Tukey’s post hoc test; ****P ≤ .0001. (F) Representative FACS histogram (left panel) and average MFI ± SD (right panel) showing levels of CD34 marker on HSC-SLAMs isolated from 4-month-old control and db mice treated with vehicle or the AKT inhibitor MK-2206 for 2 weeks (n = 11-12 from 5 independent cohorts). Two-way ANOVA with Tukey’s post hoc test; ***P ≤ .0005. (G) PB chimerism in competitive reconstitution assays using purified HSC-SLAMs isolated from the BM of control and db mice treated with vehicle or the AKT inhibitor MK-2206 for 2 weeks. The right graph shows myeloid and lymphoid PB chimerism 20 weeks after transplantation. Results are expressed as mean ± SD (n = 7-8 from 2 independent experiments). Two-way ANOVA with Sidak’s post hoc test; *P ≤ .05; **P ≤ .01; ***P ≤ .001; ****P ≤ .0001.
Impact of constitutive AKT activation on HSC function in obesity. (A) Gene set enrichment analysis (GSEA) for upregulated genes in db HSC-SLAMs. Numbers in parentheses show the number of genes in indicated gene sets. (B) Scheme of manually curated upregulated (blue) and downregulated (green) genes in HSC-SLAMs identified by genome-wide gene expression analysis and linked to the phosphatidylinositol pathway and AKT signaling. (C) Representative fluorescence-activated cell sorting (FACS) plot and histogram (left panel) showing the gating strategy and levels of AKT and STAT3 phosphorylation in the HSC-SLAM compartment isolated from the BM of 4-month-old control and db mice. Right panel shows relative average mean fluorescence intensity (MFI) ± standard deviation (SD) of AKT, STAT3, STAT5, and pERK phosphorylation in db HSCs compared with control (n = 5). Student t test; *P ≤ .05. (D) Experimental scheme for in vivo pharmacologic AKT inhibition (left panel). Right panel shows relative average MFI ± SD of AKT phosphorylation in each experimental group (n = 3). Two-way ANOVA with Tukey’s post hoc test; *P ≤ .05; **P ≤ .01. (E) Mean percentage ± SD of HSC-SLAMs and MPPs (LSK CD48+) in the BM of 4-month-old control and db mice treated with vehicle (veh) or the AKT inhibitor MK-2206 for 2 weeks (n = 12-20 from 5 independent cohorts). Two-way ANOVA with Tukey’s post hoc test; ****P ≤ .0001. (F) Representative FACS histogram (left panel) and average MFI ± SD (right panel) showing levels of CD34 marker on HSC-SLAMs isolated from 4-month-old control and db mice treated with vehicle or the AKT inhibitor MK-2206 for 2 weeks (n = 11-12 from 5 independent cohorts). Two-way ANOVA with Tukey’s post hoc test; ***P ≤ .0005. (G) PB chimerism in competitive reconstitution assays using purified HSC-SLAMs isolated from the BM of control and db mice treated with vehicle or the AKT inhibitor MK-2206 for 2 weeks. The right graph shows myeloid and lymphoid PB chimerism 20 weeks after transplantation. Results are expressed as mean ± SD (n = 7-8 from 2 independent experiments). Two-way ANOVA with Sidak’s post hoc test; *P ≤ .05; **P ≤ .01; ***P ≤ .001; ****P ≤ .0001.
To determine how AKT constitutive activation affects HSC activity in obesity, we treated control and db mice with the selective allosteric AKT inhibitor MK2206 in a condition that normalized its activation level (Figure 2D).23 The treatment did not significantly change the frequency or the phenotype of the MPP and HSC-SLAM compartments in control and db mice (Figure 2E-F). Similarly, db HSC-SLAMs maintained a lower expression of the CD34 marker, consistent with the aberrant CD34– HSC:MPP1 ratio associated with obesity (Figure 2F).11 In contrast, AKT modulation impacted the function of db HSCs because it led to the normalization of their reconstitution ability in transplantation assays (Figure 2G). Importantly, the inhibitor did not functionally impact the control HSCs. It also did not disturb the production of the myeloid and lymphoid lineages, suggesting that it altered HSC choice between self-renewal and differentiation but not lineage decision. Altogether these results demonstrate the constitutive activation of the AKT pathway in db HSCs. They also indicate that this aberrant AKT activity directly contributes to the hyperactivity of db HSCs after transplantation-induced regenerative stress.
Alteration of the FOXO oxidative stress response in obesity
Although chronic oxidative stress and constitutive AKT activation contribute to the hyperactivity of the db HSCs upon transplantation, these 2 conditions paradoxically did not disturb HSC quiescence in obese animals.11 This was in sharp contrast to the well-known activity of ROS and AKT in promoting HSC proliferation and exhaustion.12,13 To study this unexpected result, we focused on FOXO3, a key regulator of HSC quiescence and a direct target of AKT, which controls its activity through phosphorylation and cytoplasmic translocation. As expected, FOXO3 localized in the nucleus of control HSC-SLAMs at steady state (Figure 3A, left panel). Despite constitutive AKT activation (Figure 2C), we found that FOXO3 remains nuclear in db HSCs (Figure 3A, right panel).
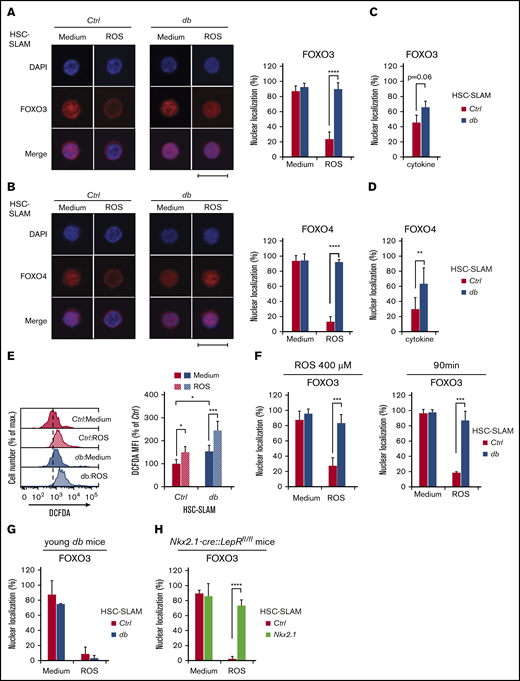
Altered FOXO response to oxidative stress in obesity-primed HSCs. (A-B) Representative images (left) of immunofluorescence analysis of FOXO3 (A) and FOXO4 (B) subcellular localization in HSC-SLAMs, isolated from 4-month-old control and db mice, after 30 minutes in vitro treatment with medium or ROS (H2O2: 100 µM). Scale bar, 10 µm. Graphs (right) indicate the mean percentage ± standard deviation (SD) of HSC-SLAMs presenting FOXO3 and FOXO4 nuclear localization (n = 3-5 with more than 50 individual cells analyzed in each condition). Two-way ANOVA with Sidak’s post hoc tes; ****P ≤ .0001. (C-D) Mean percentage ± SD of control and db HSC-SLAMs presenting FOXO3 (C) and FOXO4 (D) nuclear localization after 30 minutes of in vitro treatment with stem cell factor and thrombopoietin (20 ng/mL) (n = 3 with more than 50 individual cells analyzed in each condition). Two-way ANOVA with Sidak’s post hoc test; **P ≤ .01. (E) Representative FACS histogram (left panel) and relative average mean fluorescence intensity ± SD (right panel) showing levels of intracellular ROS detected by 2′,7′-dichlorofluorescin diacetate staining in HSC-SLAMs isolated from 4-month-old control and db mice after 30 minutes of in vitro treatment with medium or ROS (H2O2: 100 µM) (n = 6). Two-way ANOVA with Tukey’s post hoc test; *P ≤ .05; ***P ≤ .0005. (F) Impact of ROS intensity and duration. Mean percentage ± SD of control and db HSC-SLAMs presenting FOXO3 nuclear localization after 30 minutes of in vitro treatment with medium or ROS (H2O2: 100 µM) (n = 3). Two-way ANOVA with Sidak’s post hoc test; ***P ≤ .001. (G-H) Mean percentage ± SD of HSC-SLAMs presenting FOXO nuclear localization when isolated from juvenile 5-week-old db mice (before obesity onset) (n = 2) (G) or 4-month-old Nkx2.1-CRE::LepRfl/fl obese mice with neuron-specific Lepr deletion (n = 3) (H) and treated for 30 minutes in vitro with medium or ROS (H2O2: 100 µM). Two-way ANOVA with Sidak’s post hoc test; ****P ≤ .0001.
Altered FOXO response to oxidative stress in obesity-primed HSCs. (A-B) Representative images (left) of immunofluorescence analysis of FOXO3 (A) and FOXO4 (B) subcellular localization in HSC-SLAMs, isolated from 4-month-old control and db mice, after 30 minutes in vitro treatment with medium or ROS (H2O2: 100 µM). Scale bar, 10 µm. Graphs (right) indicate the mean percentage ± standard deviation (SD) of HSC-SLAMs presenting FOXO3 and FOXO4 nuclear localization (n = 3-5 with more than 50 individual cells analyzed in each condition). Two-way ANOVA with Sidak’s post hoc tes; ****P ≤ .0001. (C-D) Mean percentage ± SD of control and db HSC-SLAMs presenting FOXO3 (C) and FOXO4 (D) nuclear localization after 30 minutes of in vitro treatment with stem cell factor and thrombopoietin (20 ng/mL) (n = 3 with more than 50 individual cells analyzed in each condition). Two-way ANOVA with Sidak’s post hoc test; **P ≤ .01. (E) Representative FACS histogram (left panel) and relative average mean fluorescence intensity ± SD (right panel) showing levels of intracellular ROS detected by 2′,7′-dichlorofluorescin diacetate staining in HSC-SLAMs isolated from 4-month-old control and db mice after 30 minutes of in vitro treatment with medium or ROS (H2O2: 100 µM) (n = 6). Two-way ANOVA with Tukey’s post hoc test; *P ≤ .05; ***P ≤ .0005. (F) Impact of ROS intensity and duration. Mean percentage ± SD of control and db HSC-SLAMs presenting FOXO3 nuclear localization after 30 minutes of in vitro treatment with medium or ROS (H2O2: 100 µM) (n = 3). Two-way ANOVA with Sidak’s post hoc test; ***P ≤ .001. (G-H) Mean percentage ± SD of HSC-SLAMs presenting FOXO nuclear localization when isolated from juvenile 5-week-old db mice (before obesity onset) (n = 2) (G) or 4-month-old Nkx2.1-CRE::LepRfl/fl obese mice with neuron-specific Lepr deletion (n = 3) (H) and treated for 30 minutes in vitro with medium or ROS (H2O2: 100 µM). Two-way ANOVA with Sidak’s post hoc test; ****P ≤ .0001.
To investigate this discrepancy between AKT activation and FOXO3 nuclear localization, we used an in vitro hydrogen peroxide treatment to compare control and db HSC oxidative stress response. As expected, oxidative stress in control HSCs induced activation of AKT and the mitogen-activated protein (MAP) kinase p38 (supplemental Figure 2A-B), as well as FOXO3 cytoplasmic translocation (Figure 3A, left panel). Reversion of this phenotype by pharmacologic inhibitors confirms the role of AKT and MAPK p38 in linking oxidative stress to FOXO3 activity (supplemental Figure 2C-D). Upon oxidative challenge, db HSCs failed to increase the level of AKT phosphorylation but showed normal MAPK p38 activation (supplemental Figure 2A-B). Strikingly, however, FOXO3 was unresponsive to oxidative treatment in db HSCs, because it maintained its nuclear localization (Figure 3A, right panels). As expected, FOXO3 nuclear localization in db HSCs was unaffected by treatment with specific AKT and MAPK p38 inhibitors (supplemental Figure 2C-D). Importantly, this altered response was not unique to FOXO3 because a similar pattern was observed with FOXO4 (Figure 3B). We also analyzed FOXO1 but as described by others,24 we found that this protein has a less defined subcellular localization in hematopoietic progenitors, and we were not able to conclusively determine any changes in HSC-SLAMs under oxidative stress (data not shown). Finally, we noticed that AKT activation in db HSCs by short-term cytokine stimulation (stem cell factor and thrombopoietin) fails to promote FOXO3 and FOXO4 cytoplasmic translocation, therefore suggesting that dysregulation of the AKT-FOXO axis is not strictly restricted to the HSC oxidative response (Figure 3C-D). Altogether, these results indicate that the obese environment impairs the normal AKT-FOXO axis in HSCs, particularly in the context of stress.
To validate these results, we first confirmed that db HSCs were experiencing chronic oxidative stress and that in vitro hydrogen peroxide treatment was affecting control and db HSCs equally (Figure 3E).11 By increasing the level and duration of the oxidative treatment, we showed that the impairment of the FOXO3 response was not the result of changes in oxidative sensitivity or kinetics (Figure 3F). We also confirmed that this phenotype was not the result of the changes in the HSC subsets, because this result could be replicated in the most immature HSCCD49– subset (data not shown). Importantly, using 5-week-old db mice before the onset of obesity or obese mice with neuron-specific Lepr deletion (denoted Nkx2.1-cre::Leprfl/fl),25 we demonstrated that the alteration of the FOXO3 oxidative response was associated not with the disruption of the leptin pathway in HSCs but instead with the metabolic phenotypes linked to the mutation (Figure 3G-H). Altogether, these results suggest that conditions in db mice affect the molecular wiring of the HSCs and modify their oxidative stress response. They indicate that FOXO proteins become insensitive to their normal upstream regulators such as AKT and MAPK p38, leading to the maintenance of their nuclear location in stress conditions. This uncoupling of the FOXO proteins from their environmental regulators suggests an adaptive mechanism that may contribute to the survival and function of the HSC compartment in chronic stress conditions.
Hyperglycemia drives the alteration of oxidative stress response in HSCs
Obesity is characterized by excessive visceral adiposity and a multitude of metabolic sequelae. To validate our results and determine whether adiposity or any particular obesity-associated sequel could be responsible for this phenotype, we analyzed other well-characterized mouse models of obesity and metabolic syndromes.26 We first analyzed the db companion model, Lepob/ob (hereafter denoted ob), which is based on leptin deficiency. Both db and ob mice were hyperphagic and showed similar weight gain (Figure 4A, left panel). Although these models developed a similar metabolic profile, we confirmed that ob mice have a more transient and milder hyperglycemia and display a milder oxidative stress profile compared with their db counterparts (Figure 4A, right panel; supplemental Figure 3A).26 Surprisingly, we found that ob HSCs did not display the same altered FOXO3 oxidative stress response as db HSCs (Figure 4B). These divergent results in these 2 leptin-dependent models confirm that disruption of this pathway is not the main cause of these alterations. They also show that visceral adiposity, a common feature of these models, is not directly responsible for the altered FOXO3 stress response. In contrast, the differential analysis of these models suggests the impact of specific obesity-associated sequelae beyond fat accumulation.

Hyperglycemia drives the alteration of oxidative stress response in HSCs. (A-B) Comparison of leptin-dependent db and ob mouse models of obesity. (A) Bodyweight and nonfasting blood glucose of 4-month-old db and ob mice compared with their respective littermate controls (n = 9-21). (B) Mean percentage ± standard deviation (SD) of db and ob HSC-SLAMs presenting FOXO nuclear localization after 30 minutes of in vitro treatment with medium or ROS (H2O2: 100 µM) (n = 5 with 50 cells measured per condition per experiment). (C-H) Analyses of (C-E) a polygenic mouse model of obesity (MS-NASH/male) and (F-H) a mouse model of type I diabetes (Ins2Akita/male). (C,F) Mean bodyweight and nonfasting blood glucose ± SD of 4-month-old MS-NASH and Ins2Akita male mice compared with their respective littermate controls (n = 2-4). (D,G) Representative FACS histogram showing levels of intracellular ROS detected by DCFDA in HSC-SLAMs isolated from MS-NASH and Ins2Akita mice compared with age- and sex-matched littermate and db control (representative of 2-3 independent experiments). (E,H) Mean percentage ± SD of MS-NASH and Ins2Akita HSC-SLAMs presenting FOXO nuclear localization after 30 minutes of in vitro treatment with medium or ROS (H2O2: 100 µM) (n = 2-4, with 50 cells measured per condition per experiment). Two-way ANOVA with Sidak’s post hoc test, except for panels C and F for which unpaired, 2-tailed Student t tests were used; **P < .01; ***P < .001; ****P ≤ .0001.
Hyperglycemia drives the alteration of oxidative stress response in HSCs. (A-B) Comparison of leptin-dependent db and ob mouse models of obesity. (A) Bodyweight and nonfasting blood glucose of 4-month-old db and ob mice compared with their respective littermate controls (n = 9-21). (B) Mean percentage ± standard deviation (SD) of db and ob HSC-SLAMs presenting FOXO nuclear localization after 30 minutes of in vitro treatment with medium or ROS (H2O2: 100 µM) (n = 5 with 50 cells measured per condition per experiment). (C-H) Analyses of (C-E) a polygenic mouse model of obesity (MS-NASH/male) and (F-H) a mouse model of type I diabetes (Ins2Akita/male). (C,F) Mean bodyweight and nonfasting blood glucose ± SD of 4-month-old MS-NASH and Ins2Akita male mice compared with their respective littermate controls (n = 2-4). (D,G) Representative FACS histogram showing levels of intracellular ROS detected by DCFDA in HSC-SLAMs isolated from MS-NASH and Ins2Akita mice compared with age- and sex-matched littermate and db control (representative of 2-3 independent experiments). (E,H) Mean percentage ± SD of MS-NASH and Ins2Akita HSC-SLAMs presenting FOXO nuclear localization after 30 minutes of in vitro treatment with medium or ROS (H2O2: 100 µM) (n = 2-4, with 50 cells measured per condition per experiment). Two-way ANOVA with Sidak’s post hoc test, except for panels C and F for which unpaired, 2-tailed Student t tests were used; **P < .01; ***P < .001; ****P ≤ .0001.
To explore this possibility, we used a recently developed inbred, polygenic, and leptin-independent mouse model of obesity called MS-NASH.27 MS-NASH males become spontaneously obese but with less weight gain and visceral fat accumulation than the db and ob models (Figure 4C, left panel; data not shown). Similar to the db mice, these animals developed diabetes at age 16 weeks with combined hyperglycemia, insulin resistance, and hyperinsulinemia (Figure 4C, right panel; data not shown). Interestingly MS-NASH HSCs showed a phenotype similar to that of their db counterparts, which includes constitutive oxidative stress at steady state and altered FOXO3 stress response (Figure 4D-E). These results led us to focus on the metabolic features shared by these 2 models. We considered dyslipidemia as a possible driver for these alterations. We used mice deficient in either apolipoprotein E (Apoe) or low-density lipoprotein receptor (Ldlr) as established models of hyperlipidemia. We found that HSCs isolated from Apoe−/− or Ldlr−/− mice displayed moderate constitutive oxidative stress but showed normal FOXO3 activity in response to oxidative stimulation, therefore ruling out dyslipidemia as a major contributor to these alterations (supplemental Figure 3B-C). We then focused on hyperglycemia and diabetes. We performed this analysis using the Ins2Akita mouse model of type I diabetes, which carries 1 point mutation in the Ins2 gene and presents reduced β-cell mass along with reduced insulin secretion.28 At age 16 weeks, Ins2Akita males were not obese, but they displayed a severe diabetic profile with hyperglycemia but not hyperinsulinemia (Figure 4F; data not shown). In this context, hyperglycemia was sufficient to alter HSC characteristics, as previously observed in the obese and diabetic db and MS-NASH mice (Figure 4G-H). Consistent with this idea, we noticed that Ins2Akita females, which do not develop extensive diabetes, displayed normal FOXO oxidative stress response in HSCs (supplemental Figure 3D-E). Altogether, these results from several mouse models of obesity and metabolic syndromes suggest a direct association between hyperglycemia and the alteration of the FOXO oxidative stress response.
High glucose disrupts cell oxidative stress response in hematopoietic progenitor cell line
To directly validate the effect of glucose on FOXO3 activity, we used the Hoxb8-FL cell line.29 Derived from mouse bone marrow cells that ectopically express the transcription factor Hoxb8, this Flt3-ligand–dependent cell line represents a surrogate model for self-renewing multipotent hematopoietic progenitor cells. We cultured these cells in low or high glucose for more than 8 passages to mimic chronic hyperglycemic conditions. In these conditions, Hoxb8-FL cells showed no change in proliferation or any cell cycle alterations (Figure 5A-B). They also displayed similar basal ROS levels at steady state and similar intracellular ROS increase in oxidative conditions (Figure 5C). In high glucose conditions, Hoxb8-FL cells showed a slight increase of AKT S473 phosphorylation, which was associated with the activation of the mTORC1 pathway, as indicated by increased mTOR (S2448), p70 S6 (S235/236), and 4E-BP1 (T37/46) phosphorylation (Figure 5D). Interestingly, Hoxb8-FL cells cultured in high glucose maintained FOXO3 and FOXO4 nuclear retention at steady state and upon oxidative stress, therefore mimicking the phenotype described in HSCs isolated from diabetic models (Figure 5E; data not shown). Upon differentiation induction (through estradiol/Flt3-ligand withdrawal and the addition of granulocyte-macrophage colony-stimulating factor), this feature was linked to a differential growth pattern and reduced apoptosis in the Hoxb8-FL cells cultured in a high glucose condition (Figure 5F-G). Consistent with these results, these Hoxb8-FL cells promoted higher chimerism than their control counterparts upon transplantation (Figure 5H). Altogether, these results link the high glucose condition with the constitutive activation of AKT and some of its downstream targets such as mTOR. Furthermore, they confirm the specific association between the glucose environment and the alteration of FOXO regulation. Finally, they suggest that the high glucose environment functionally alters the stress response of these progenitors and particularly their sensitivity to apoptosis.
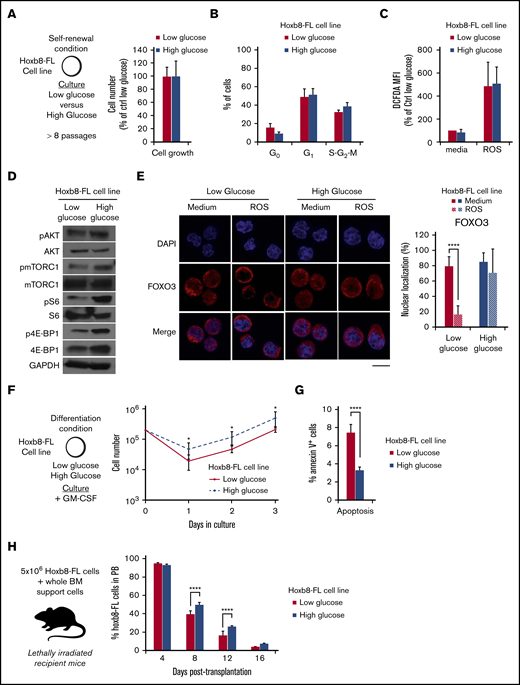
In vitro high glucose condition alters FOXO protein function in Hoxb8-FL cells. (A-B) Experimental scheme and Hoxb8-FL cell line growth condition in low (11.1 mM) and high (55 mM) glucose media. Mean percentage ± standard deviation (SD) of the relative cell number counted (A) and cell cycle analysis (B) measured by Hoechst 33342/Ki67 staining after 3-day culture. (C) Relative average mean fluorescence intensity ± SD showing levels of intracellular ROS detected by DCFDA in Hoxb8-FL cells cultured in low and high glucose condition at steady state or upon oxidative challenge (30 minutes; H2O2: 100 µM). (D) Immunoblot analysis of signaling proteins in 6 × 10⁵ Hoxb8-FL cells, cultured in low and high glucose condition. Immunoblots are representative of 2 independent experiments. (E) Representative images of immunofluorescence analysis of FOXO3 subcellular localization in Hoxb8-FL cell line culture in low and high glucose condition after 30 minutes of in vitro treatment with medium or ROS (H2O2: 100 µM). Scale bar, 10 µm. Graph (right) indicates the mean percentage ± SD of Hoxb8-FL cells presenting FOXO3 nuclear localization (n = 3 with more than 50 individual cells analyzed in each condition). Two-way ANOVA with Sidak’s post hoc test; ****P ≤ .0001. (F-G) In vitro culture of low and high glucose adapted Hoxb8-FL cells in granulo-macrophagic differentiation condition. (F) Cell numbers over time. (G) Results are expressed as mean cell numbers ± SD. Level of apoptosis in low and high glucose adapted Hoxb8-FL cell, 6 hours after switching from self-renewing to differentiation culture conditions. Results are expressed as mean of annexin V+ cells ± SD (n = 4). Unpaired, 2-tailed Student t test; *P < .05; ****P < .0001. (H) In vivo differentiation of low and high glucose adapted Hoxb8-FL cells. Mean percentage of chimerism ± SD in the PB of lethally irradiated mice transplanted with Hoxb8-FL cells (n = 4). GM-CSF, granulocyte-macrophage colony-stimulating factor. Two-way ANOVA with Sidak’s post hoc test; ****P ≤ .0001.
In vitro high glucose condition alters FOXO protein function in Hoxb8-FL cells. (A-B) Experimental scheme and Hoxb8-FL cell line growth condition in low (11.1 mM) and high (55 mM) glucose media. Mean percentage ± standard deviation (SD) of the relative cell number counted (A) and cell cycle analysis (B) measured by Hoechst 33342/Ki67 staining after 3-day culture. (C) Relative average mean fluorescence intensity ± SD showing levels of intracellular ROS detected by DCFDA in Hoxb8-FL cells cultured in low and high glucose condition at steady state or upon oxidative challenge (30 minutes; H2O2: 100 µM). (D) Immunoblot analysis of signaling proteins in 6 × 10⁵ Hoxb8-FL cells, cultured in low and high glucose condition. Immunoblots are representative of 2 independent experiments. (E) Representative images of immunofluorescence analysis of FOXO3 subcellular localization in Hoxb8-FL cell line culture in low and high glucose condition after 30 minutes of in vitro treatment with medium or ROS (H2O2: 100 µM). Scale bar, 10 µm. Graph (right) indicates the mean percentage ± SD of Hoxb8-FL cells presenting FOXO3 nuclear localization (n = 3 with more than 50 individual cells analyzed in each condition). Two-way ANOVA with Sidak’s post hoc test; ****P ≤ .0001. (F-G) In vitro culture of low and high glucose adapted Hoxb8-FL cells in granulo-macrophagic differentiation condition. (F) Cell numbers over time. (G) Results are expressed as mean cell numbers ± SD. Level of apoptosis in low and high glucose adapted Hoxb8-FL cell, 6 hours after switching from self-renewing to differentiation culture conditions. Results are expressed as mean of annexin V+ cells ± SD (n = 4). Unpaired, 2-tailed Student t test; *P < .05; ****P < .0001. (H) In vivo differentiation of low and high glucose adapted Hoxb8-FL cells. Mean percentage of chimerism ± SD in the PB of lethally irradiated mice transplanted with Hoxb8-FL cells (n = 4). GM-CSF, granulocyte-macrophage colony-stimulating factor. Two-way ANOVA with Sidak’s post hoc test; ****P ≤ .0001.
Hyperglycemic environment contributes to increased resistance to oxidative stress in HSCs
We then directly assessed the consequences of the altered FOXO response on the HSC short-term potential after exposure to exogenous oxidative stress. Purified HSC-SLAMs were subjected to in vitro treatment with hydrogen peroxide, and their functional viability was assayed in clonogenic methylcellulose assays (Figure 6A). As expected, the oxidative treatment of control HSCs led to reduced cloning efficiency.12 In contrast, HSCs isolated from hyperglycemic db, MS-NASH, and Ins2Akita mice retain their full ability to form colonies in methylcellulose (Figure 6B-D). Importantly, the nonhyperglycemic ob and Apoe−/− models showed no alteration of their sensitivity to oxidative stress (Figure 6E-F). Altogether these observations are consistent with the results obtained with the hematopoietic progenitor cell line and strongly suggest a direct association between chronic hyperglycemia and increased HSC resistance to oxidative stress.
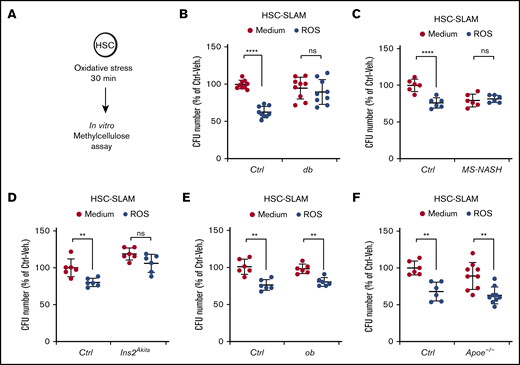
Increased HSC resistance to oxidative stress in diabetic mouse models. (A-F) In vitro activity of HSC-SLAMs tested in methylcellulose assay after 30 minutes of in vitro treatment with medium or ROS (H2O2: 100 µM). (A) Experimental scheme. (B) Relative clonogenic activity of HSC-SLAMs isolated from db (B), MS-NASH (C), Ins2Akita (D), ob (E), and Apoe−/− (F) mouse models compared with their respective controls. Graph indicates the relative percentage ± standard deviation of colony number in each condition (n = 3 performed in triplicate). Two-way ANOVA with Sidak’s post hoc test; **P ≤ .0001; ****P ≤ .0001.
Increased HSC resistance to oxidative stress in diabetic mouse models. (A-F) In vitro activity of HSC-SLAMs tested in methylcellulose assay after 30 minutes of in vitro treatment with medium or ROS (H2O2: 100 µM). (A) Experimental scheme. (B) Relative clonogenic activity of HSC-SLAMs isolated from db (B), MS-NASH (C), Ins2Akita (D), ob (E), and Apoe−/− (F) mouse models compared with their respective controls. Graph indicates the relative percentage ± standard deviation of colony number in each condition (n = 3 performed in triplicate). Two-way ANOVA with Sidak’s post hoc test; **P ≤ .0001; ****P ≤ .0001.
Hyperglycemic environment could contribute to DNA damage accumulation in HSCs
To validate these results using endogenous oxidative conditions, purified HSC-SLAMs were treated in vitro for 48 hours with buthionine sulfoximine (BSO), a compound that reduces levels of glutathione and induces intracellular ROS (Figure 7A). In this condition, control and db HSCs displayed similar increased expression of oxidative stress response genes, such as Nqo1, Hmox1, and Gadd45a (Figure 7B). As previously described, we observed that a higher percentage of db HSCs maintained nuclear FOXO localization compared with their control counterparts after 48 hours in culture (Figure 7C). As shown with short-term treatment with hydrogen peroxide, this alteration of nuclear FOXO localization in prolonged oxidative stress condition was also associated with an increased ability of the db HSCs to form colonies in a methylcellulose assay (Figure 7D).
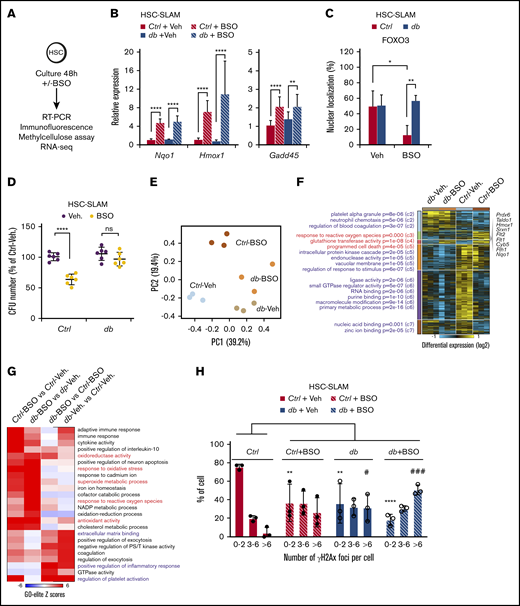
Long-term HSC alterations in a hyperglycemic environment. HSC-SLAMs isolated from 4-month-old control and db mice, assayed after 48 hours of in vitro culture in the presence or absence of BSO. (A) Experimental scheme. (B) Real-time polymerase chain reaction analysis after culture showing the relative expression of the oxidative response gene Nqo1, Hmox1, and Gadd45. Graph indicates the relative percentage expression ± standard deviation (SD) (n = 2 performed in sextuplets). (C) Mean percentage ± SD of cells presenting FOXO nuclear localization (n = 5, with 50 cells measured per condition per experiment). (D) Relative percentage ± SD of colony number obtained in methylcellulose assay for each condition (n = 2 performed in triplicate). (E-G) RNA sequencing on control and db HSC-SLAMs cultured with and without BSO (n = 3 for each condition). (E) Principal component analysis (PCA) visualization of the first 2 principal components of all expressed genes. (F) Hierarchically clustered heatmap of differentially expressed genes (n = 2105; fold >1.5; empirical Bayes t test; P < .05) with statistically enriched GO biological processes (left) and example genes associated with prototypical oxidative response (right). (G) GO-Elite heatmap of paired relative enrichment for GO biological processes among upregulated genes. (H) Quantification of γH2AX foci (n = 3, with 50 cells measured per condition per experiment). Two-way ANOVA with Sidak’s post hoc test; *P < .05; **P < .01; ****P ≤ .0001; # P < .05; ### P < .001.
Long-term HSC alterations in a hyperglycemic environment. HSC-SLAMs isolated from 4-month-old control and db mice, assayed after 48 hours of in vitro culture in the presence or absence of BSO. (A) Experimental scheme. (B) Real-time polymerase chain reaction analysis after culture showing the relative expression of the oxidative response gene Nqo1, Hmox1, and Gadd45. Graph indicates the relative percentage expression ± standard deviation (SD) (n = 2 performed in sextuplets). (C) Mean percentage ± SD of cells presenting FOXO nuclear localization (n = 5, with 50 cells measured per condition per experiment). (D) Relative percentage ± SD of colony number obtained in methylcellulose assay for each condition (n = 2 performed in triplicate). (E-G) RNA sequencing on control and db HSC-SLAMs cultured with and without BSO (n = 3 for each condition). (E) Principal component analysis (PCA) visualization of the first 2 principal components of all expressed genes. (F) Hierarchically clustered heatmap of differentially expressed genes (n = 2105; fold >1.5; empirical Bayes t test; P < .05) with statistically enriched GO biological processes (left) and example genes associated with prototypical oxidative response (right). (G) GO-Elite heatmap of paired relative enrichment for GO biological processes among upregulated genes. (H) Quantification of γH2AX foci (n = 3, with 50 cells measured per condition per experiment). Two-way ANOVA with Sidak’s post hoc test; *P < .05; **P < .01; ****P ≤ .0001; # P < .05; ### P < .001.
We next performed RNA sequencing on control and db HSC-SLAMs cultured in the absence or presence of BSO. As expected, principal component analysis (PCA) revealed segregation of the control and db HSCs along the first principal component (PC1) and a separation between treatments (vehicle vs BSO) along the second principal component (PC2) (Figure 7E). Consistent with their functional characterization, PCA indicates a closer proximity between the db HSC clusters (treated or untreated) than between the control clusters. Differential gene expression and associated enriched Gene Ontology (GO) biological processes confirm differences between control and db HSCs with the detection of a megakaryocytic priming program in db HSCs (Figure 7F). Importantly, these analyses also further highlight a different response to treatment with BSO, particularly for sets of genes related to oxidative stress response and apoptosis regulation (Figure 7F-G). Although limited in scope, these molecular data are consistent with our functional analyses pointing to a reduced impact of the oxidative environment on db HSCs compared with their normal counterparts. Finally, we observed that oxidative stress in cultured control HSCs was associated with an increase in DNA damage detectable by γH2Ax staining (Figure 7H). Interestingly, db HSCs in the control culture showed increased DNA damage compared with their normal counterparts, but this phenomenon was not significantly exacerbated by the presence of endogenous oxidative stress. Altogether, these results demonstrate that intrinsic HSC alterations in chronic hyperglycemia lead to increase resistance to oxidative stress and could promote the accumulation of DNA damage.
Discussion
Here we confirm the impact of obesity and its sequelae on HSCs. We show that obesity promotes fine changes in the composition of the HSC compartment but also alters the activity of the most immature HSC subset in regenerative conditions. Diet and systemic metabolic diseases have previously been shown to perturbate HSC homeostasis. A short-term, high-fat diet regimen has been associated with lipid raft alterations and improper transforming growth factor-β signaling leading to HSC attrition.30 Diabetes has been linked to epigenetic changes that affect HSC differentiation potential.20 In obese db mice, we previously associated the loss of HSC fitness with oxidative stress.11 Here, we link this aberrant activity to the constitutive activation of AKT signaling. Importantly, our data suggest that oxidative stress and AKT signaling belong to a common pathway, because antioxidant treatment or AKT pharmacologic inhibition are individually able to restore normal HSC activity upon transplantation. This is consistent with the known interplay between ROS and AKT signaling in HSCs21,22 and their ability to promote HSC activation.12,13
Interestingly, the impact of these activating signals is revealed in regenerative conditions but remains mild at steady state, suggesting that adaptive mechanisms actively prevent HSC exhaustion. Such mechanisms have been described during emergency hematopoiesis when a negative feedback loop between MEK/ERK and PI3K/AKT signaling pathways limits HSC activation and promotes the return of HSCs to quiescence.31 A similar study showed that control of actin polymerization and ERK signaling by Spred1 protein contributes to HSC homeostasis in stress conditions induced by a high-fat diet and microbiota dysbiosis.32 Our results highlight a potential adaptive mechanism involving the disruption of the AKT-FOXO axis. FOXO proteins are central regular regulators of the HSC stress response by controlling self-renewal, redox environment, proliferation, and survival.33-35 In HSCs isolated from db mice, we observed that FOXO3 and FOXO4 proteins are not responsive to the constitutive AKT activation and maintain their nuclear localization. This phenotype persists in the presence of exogenous oxidative stressors, which suggests a direct modulation of FOXO protein activity.24 Functionally, we correlated the reinforced FOXO localization to a significantly increased HSC resistance to oxidative stress, but the extent of this link remains to be fully demonstrated. Although we found the modulation of known FOXO target genes (Cdkn1a, Gadd45),11 we were unable to establish a strong FOXO gene signature in db HSCs at steady state or upon exogenous oxidative stress. This could suggest nontranscriptional nuclear FOXO functions in this particular context.36 We can also speculate that the observed loss of FOXO regulation is one component of a broader dysregulation of the stress response. Particularly, in vivo AKT inhibition experiments suggest that constitutive AKT activation, along with its downstream targets such as mTOR, could also contribute to the altered HSC functions and increased resistance to oxidative stress through a FOXO-independent mechanism. The individual contribution and interplay of these pathways in this context remain to be described. In any case, the uncovered alteration of FOXO regulation could constitute a valuable marker to assess HSC fitness in conditions of chronic metabolic stress. Altogether, these results suggest that obesity leads to the generation of an alternate HSC steady state. Molecularly, this HSC state shows a megakaryocytic priming program similar to the one described in the most quiescent long-term HSCs.37 Functionally, it resembles an activated G(alert) state, previously described in the context of physical injury.38,39 We propose that the combination of stimulating signals such as ROS and AKT with adaptive mechanisms such as the reinforced FOXO nuclear localization could drive the properties of this HSC state, defined as quiescent and stress-resistant at steady state but poised for activation in regenerative conditions.
We initiated our study by focusing on the db mouse model which recapitulates the obese phenotype and its sequelae. By using several well-characterized mouse models, we demonstrated that hyperglycemia associated with type I and type II diabetes is the key driver of the alteration of the HSC stress response and increased oxidative stress resistance. Cell cultures demonstrate that a high-glucose environment is directly associated with the uncoupling of FOXO proteins from their upstream regulators. We can speculate about the long-term consequences of these alterations and particularly the impact of FOXO dysregulation. FOXO proteins have complex functions in tumorigenesis.40 FOXO proteins are tumors suppressors because they can suppress the cell cycle or promote apoptosis, and their loss of function could lead to myeloproliferative syndrome.41 Simultaneously, FOXO activity favors tumorigenesis by supporting leukemic stem cell function and reinforcing malignant clone stress resistance.42 Our results highlighted this dual capacity in hyperglycemic conditions. They suggest that FOXO activity could contribute to the maintenance of HSC homeostasis. Conversely, this activity is associated with increased resistance to oxidative stress and DNA damage and enhanced transient regenerative properties.
Because the clinical link between diabetes and hematologic malignancies remains to be established, it is unclear whether the dysregulations described in our study could trigger full-blown disease.43 Alternatively, hyperglycemia could favor the development of premalignant clones by promoting stress resistance and/or mutagenesis. Restriction of the clonal hematopoietic diversity, a phenomenon known as clonal hematopoiesis of indeterminate potential (CHIP), is a frequent feature of aging that may precede the emergence of hematologic malignancies.44,45 CHIP is associated with an increase in the likelihood of having type II diabetes, but the causal link between these conditions has not been established. Thus, it is possible that CHIP-associated inflammation promotes diabetes and/or that diabetic conditions alter hematopoietic clonal diversity.46 The presented results would favor the latter as they show that hyperglycemia modulates the HSC ability to cope with oxidative stress and affects their long-term fitness. Moreover, it would be interesting to determine how hyperglycemia and an altered HSC oxidative stress response impact with CHIP-associated genes or interplay with the consequences of their mutations.47 These questions are relevant in the context of worldwide increased prevalence of prediabetes and diabetes.48,49 More broadly, investigating HSC functions in conditions of chronic metabolic alterations could shed light on the environmental influences affecting HSC health and their clonal dysregulation.
For data and materials, please contact Damien Reynaud at damien.reynaud@cchmc.org.
Acknowledgments
The authors are thankful to Kyle Ferchen and Zachary Kincaid at the Cincinnati Children’s Hospital Medical Center (CCHMC) for experimental help, and Jamie Fellers for proofreading the manuscript.
The authors acknowledge the assistance of the CCHMC Research Flow Cytometry Core, which was supported by a grant from the National Institutes of Health (NIH)/National Institute of Diabetes and Digestive and Kidney Diseases (P30 DK90971) through the Division of Experimental Hematology and Cancer Biology’s Center for Excellence in Molecular Hematology and Shared and High-End Instrumentation Awards (NIH Office of the Director; S10OD025045). This work was supported by a grant from the NIH/National Heart, Lung, and Blood Institute (R01HL141418) (D.R.). This study was initiated with the support of an Arnold W. Strauss Postdoctoral Fellowship Award (J.-M.L.) and US Department of Defence Peer Reviewed Cancer Research Program (DOD PRCRP) award (DOD#W81XWH-15-1-0344) (D.R.).
Authorship
Contribution: V.G. performed and analyzed all the experiments with the assistance of M.S.; J.-M.L. started the project and made the initial observations with the assistance of B.G.; K.N. prepared the samples for RNA sequencing analysis; R.N. assisted with western blot analyses and provided technical advice; H.G., N.S., and J.A.C. provided critical insights and reviewed the manuscript; N.S. performed bioinformatics analyses; D.R. conceived and supervised the project; and V.G. and D.R. wrote the manuscript.
Conflict-of-interest disclosure: The authors declare no competing financial interests.
The current affiliation for J.-M.L. is Department of Oral Biology, School of Dental Medicine, University at Buffalo, State University of New York (SUNY), Buffalo, NY.
Correspondence: Damien Reynaud, Cincinnati Children’s Hospital Medical Center, Division of Experimental Hematology and Cancer Biology, 3333 Burnet Ave, MLC 7013, Room S7.603, Cincinnati, OH 45229; e-mail: damien.reynaud@cchmc.org.

