

Key Points
Long-term combination venetoclax and ibrutinib treatment in MCL is associated with immune recovery.
This may provide an opportunity for the planned application of immunotherapy to maximize response.

Abstract
Combination venetoclax plus ibrutinib for the treatment of mantle cell lymphoma (MCL) has demonstrated efficacy in the relapsed or refractory setting; however, the long-term impact on patient immunology is unknown. In this study, changes in immune subsets of MCL patients treated with combination venetoclax and ibrutinib were assessed over a 4-year period. Multiparameter flow cytometry of peripheral blood mononuclear cells showed that ≥12 months of treatment resulted in alterations in the proportions of multiple immune subsets, most notably CD4+ and CD8+ effector and central memory T cells and natural killer cells, and normalization of T-cell cytokine production in response to T-cell receptor stimulation. Gene expression analysis identified upregulation of multiple myeloid genes (including S100 and cathepsin family members) and inflammatory pathways over 12 months. Four patients with deep responses stopped study drugs, resulting in restoration of normal immune subsets for all study parameters except myeloid gene/pathway expression, suggesting long-term combination venetoclax and ibrutinib irreversibly affects this population. Our findings demonstrate that long-term combination therapy is associated with immune recovery in MCL, which may allow responses to subsequent immunotherapies and suggests that this targeted therapy results in beneficial impacts on immunological recovery. This trial was registered at www.clinicaltrials.gov as #NCT02471391.
Introduction
Mantle cell lymphoma (MCL) comprises ∼6% of all newly diagnosed non-Hodgkin lymphomas; patients usually present with advanced-stage disease and extranodal involvement.1,2 Those with newly diagnosed MCL have a median survival of 3 to 6 years, stratified by the MCL International Prognostic Index.3-5 Outcomes are improved by the use of intensive chemotherapy with or without autologous stem cell transplantation (ASCT) in younger patents,6-11 and there is a survival advantage with maintenance rituximab.12,13 The presence of TP53 mutations identifies a subgroup with inferior overall and progression-free survival.14 Patients with relapsed or refractory MCL may be candidates for cellular therapy, including allogeneic transplantation or chimeric antigen receptor (CAR) T cells.15,16
Despite these strategies, cure of MCL is not achieved with treatments other than allogeneic transplantation,17 and most patients require salvage therapy for relapsed disease. MCL is characterized by the expression of CD19, CD20, CD79a, and PAX5 on malignant B cells, with CD5, FMC-7, and B-cell lymphoma 2 (BCL2) commonly expressed.18 The impact of MCL on peripheral blood (PB) immunity has been described to a limited extent, with some studies showing that expression of programmed death ligand 1 on tumor cells may inhibit T-cell responses.19,20 Detailed immune profiling of PB subsets in MCL has not yet been described at diagnosis or relapse.
The emergence of targeted therapies for B-cell neoplasms, including ibrutinib, the irreversible inhibitor of Bruton’s tyrosine kinase (BTK), and venetoclax, the BH3 mimetic inhibitor of BCL2, provides new avenues for salvage. Both agents have activity as single agents in MCL.21-23 In combination, an overall response rate of 71% and CR rate of 62% were observed after 4 months of therapy in the prospective AIM study of 23 patients with relapsed or refractory disease and 1 patient who was treatment naive.24
Venetoclax and ibrutinib affect different critical pathways in both malignant B cells and other leukocytes, and their separate effects on immunity other than B-cell depletion in patients have not been described in patients receiving long-term therapy after disease control has been obtained. Short-term impacts of venetoclax and ibrutinib as single agents have been described in some cohorts.25-27 Analysis of the cellular immunology of patients with relapsed MCL before salvage therapy has not been described in detail. Venetoclax inhibits BCL2, which is an important survival mechanism in activated T cells and innate subsets.28 Natural killer (NK) cells, which are reliant on interleukin-15 (IL-15)–induced upregulation of BCL2 and MCL1,29-31 are profoundly depleted in mouse models by venetoclax,28 as are normal and leukemic B cells.32 The effect of venetoclax on T-cell differentiation subsets is less well described; however, it seems that naive T cells are reliant on BCL2 for survival.28 Similarly, although BTK inhibition is critical to the anti–B-cell lymphoma activity of ibrutinib, inhibition of other members of the Tec family of tyrosine kinases occurs.33 BTK is primarily expressed in hematopoietic cells and is involved in signaling downstream of a number of cytokine and chemokine pathways, such as IL-2, IL-6, CXCR4, TLR receptors, and antigen recognition receptors and their costimulatory receptors,34-37 which can lead to alteration of lymphocyte function and/or survival.
In addition, whereas specific tyrosine kinase inhibition may have particular effects on lymphocyte subsets, MCL itself and its prior treatment with chemotherapy and ASCT and in multiple myeloma ASCT has been shown to result in altered and potentially irreversible changes in immunity as a result of thymic involution and homeostatic expansion of senescent peripheral T cells.38
In a prospectively planned substudy of the AIM trial, we collected and analyzed PB immune subsets by multiparameter flow cytometry and gene expression analysis in patients with relapsed or refractory MCL treated with novel combination venetoclax and ibrutinib over a 4-year period, considerably longer than previously reported studies with either drug alone. Our findings indicate that there is delayed, yet substantial, normalization of PB cellular immunology during therapy that seems to result directly from exposure to the drug combination rather than from MCL control alone. Additionally, our data indicate that there is a change in myeloid populations after long-term venetoclax and ibrutinib treatment, which is sustained beyond 18 months after elective treatment cessation in patients achieving minimal residual disease (MRD)–negative remissions.
Methods
Patient samples
All patients were enrolled in the prospective AIM study of combination venetoclax and ibrutinib.24 PB was collected at study enrollment (baseline) and at regular intervals to 48 months. Age-matched healthy donor samples were obtained from the Australian Red Cross Blood Service, as approved by the Melbourne Health Human Research Ethics Committee. PB mononuclear cells (PBMCs) were isolated using Ficoll-Paque Plus (GE Healthcare, Chicago, IL) and cryopreserved until required.
Response classification
Disease reassessment on therapy was as described24 and was performed at weeks 4, 16, 28, 40, and 56 with computed tomography and at weeks 4, 16, and 56 with [18F]fluorodeoxyglucose–positron emission tomography, with bone marrow examination and MRD assessment. For the purposes of correlation with immune subsets, durable responders were classified as those patients who had continued therapy, in partial or complete remission (CR), for >12 months. Four patients who discontinued therapy while in deep CR (confirmed MRD− CR on 2 consecutive occasions) were also assessed for durable immunological responses in the absence of drug exposure.
Flow cytometry
PBMCs were stained using LIVE/DEAD Fixable Aqua Cell Stain (Thermo Fisher Scientific, Waltham, MA) before staining with antibodies. Antibodies used were CD3 BV786 (BioLegend, San Diego, CA), CD4 APC-Cy7 (BD Bioscience, Franklin Lakes, NJ), CD8a BV650 (BD Bioscience), T-cell receptor γδ (TCRγδ) fluorescein isothiocyanate (FITC; BD Bioscience), CD45RA PerCP Cy5.5 (Thermo Fisher Scientific), CCR7 PE-Cy7 (Thermo Fisher Scientific), CD56 APC (BD Bioscience), CD16 PerCP Cy5.5 (BioLegend), and CD14 PE-CF594 (BD Bioscience). PBMCs were stained in LIVE/DEAD cell stain for 20 minutes in phosphate-buffered saline at room temperature, washed in fluorescence-activated cell sorting (FACS) buffer (phosphate-buffered saline plus 2% fetal calf serum), and blocked in human Fc block (BD Bioscience) for 5 minutes at room temperature. Cell staining was performed in FACS buffer for 30 minutes at 4°C, followed by 2 washes in FACS buffer and fixation in 2% paraformaldehyde (Electron Microscopy Sciences). Samples were acquired on an LSR Fortessa (BD Bioscience) flow cytometer and analyzed using FlowJo software (BD Bioscience). Populations were gated on single viable cells. Memory phenotype was defined as percentage of CD3+CD4+ or CD3+CD8+ T cells: CCR7+CD45RA+ (naive [N]), CCR7+CD45RA− (central memory [CM]), CCR7−CD45RA− (effector memory [EM]), and CCR7−CD45RA+ (terminal EM [TEM]). NK cells were defined as percentage of live cells, CD16+ NK cells were gated as percentage of CD3−CD56+ cells, γδ T cells were gated as percentage of CD3+ cells, and CD14+ cells were gated as percentage of live cells. Leukocyte data are expressed in percentages to avoid variations derived across dual-platform analyses, where blood count was undertaken on whole fresh blood and flow cytometric analysis was performed on batch-analyzed cryopreserved samples. From blood count data, ibrutinib-induced changes in lymphocyte numbers were seen in the first 4 weeks of treatment, during which an increase occurred in average baseline lymphocyte count from 2.07 × 10⁹/L (range, 0.71 × 10⁹/L to 3.55 × 10⁹/L) to 7.75 × 10⁹/L (range, 1.27 × 10⁹/L to 62.9 × 10⁹/L) by week 4. For time points beyond 16 weeks, circulating lymphocyte numbers normalized to an average of 1.19 × 10⁹/L (range, 0.2 × 10⁹/L to 2.65 × 10⁹/L) across patients, thus allowing valid comparison of cell percentages over time.
Cytokine secretion
PBMCs were incubated with CD3/28 T-cell activation beads (Miltenyi Biotec, Cologne, Germany) in the presence of GolgiPlug and GolgiStop (BD Bioscience) for 4 hours at 37°C in T-cell media (RPMI 1640, 10% fetal calf serum, 1% volume/volume N-2-hydroxyethylpiperazine-N′-2-ethanesulfonic acid, 1 mM of sodium pyruvate, 1× GlutaMAX, 1× MEM nonessential amino acids [all Thermo Fisher Scientific], and 50 mM of 2-mercaptoethanol [Sigma-Aldrich, St Louis, MO]). Cells were stained for surface T-cell markers (CD3 BUV515 [BD Bioscience], CD8 BUV379 [BD Bioscience], CD4 BUV805 [BD Bioscience], CD45RA BB515, and CCR7 PE-Cy7 [Thermo Fisher Scientific]) in the presence of human BD Bioscience Fc block for 30 minutes at 4°C. Cells were fixed/permeabilized for 20 minutes at 4°C and washed twice in Perm/Wash buffer (BD Bioscience). Intracellular cytokine expression was detected by staining with tumor necrosis factor α (TNFα) APC (BD Bioscience), IL-2 BV650 (BD Bioscience), and interferon γ BV786 (BD Bioscience) in Perm/Wash buffer at 4°C for 30 minutes, followed by 2 washes in FACS buffer and fixation in 2% paraformaldehyde. Samples were acquired on an LSR Fortessa flow cytometer and analyzed using FlowJo software (BD Bioscience). Populations were gated on single viable CD3+CD8+ or CD3+CD4+ cells.
T-cell repertoire
TCRβ loci deep amplicon sequencing was performed using LymphoTrack TRB (Invivoscribe, San Diego, CA) as per manufacturer instructions. Sequence assembly from FASTQs, annotation, and error correction were performed by MiXCR,39 with secondary analysis (diversity assessment and VDJ family usage analysis) performed by VDJtools (version 1.1.9).40 T-cell repertoire diversity was assessed by the normalized Shannon-Wiener entropy calculated as Σi (pi Lnpi)/LnN (where pi is the frequency of each species, and N is the total number of the species).
Gene expression analysis
Total RNA from PBMCs was isolated using the Qiagen All Prep DNA/RNA Kit (Qiagen, Venlo, The Netherlands). Gene expression was determined using the NanoString PanCancer Immune Profiling Panel V1 or NanoString Myeloid Inflammation Panel V2 (NanoString Technologies, Seattle, WA). All raw data were reviewed, and all samples in downstream analyses had no quality control flags and detection of at least 20% of probes. All experiments were normalized and analyzed using nCounter Advanced Analysis (version 2.0.115; NanoString Technologies). Gene expression is reported as log2 relative expression. Pathway signature and cell score were determined using proprietary algorithms (NanoString Technologies).
Statistical analysis
Data were analyzed using GraphPad Prism (version 6.0; GraphPad Software, San Diego, CA). Data in graphs are presented as mean ± standard deviation. An unpaired Student t test with Holm-Sidak multiple comparisons was used to analyze T-cell subsets at baseline compared with healthy donors. A 2-tailed Mann-Whitney U test was used to analyze other cell subsets at baseline compared with healthy donors. To analyze cell subsets over time, 2-way analysis of variance with Dunnett’s multiple comparisons (T-cell subsets) and Kruskal-Wallis test with Dunn’s multiple comparisons (other subsets) were used, with statistical significance compared with baseline samples determined. Cytokine production was analyzed using Wilcoxon’s matched-pairs signed rank test compared with baseline samples. Expression of individual genes as assessed by NanoString was analyzed using a Kruskal-Wallis test with Dunn’s multiple comparisons to baseline. Heatmaps were generated using GraphPad Prism (version 8.4.0; GraphPad Software).
Results
Patients with relapsed or refractory MCL show dysregulated cellular immunity
Analysis of immune cell numbers and distribution in PB both before therapy and after treatment in MCL patients has thus far been limited. Therefore, flow cytometry of immune subsets was performed at enrollment for patients in the AIM study (median age, 68 years) and compared with age-matched healthy controls (median age, 59 years). A reduced proportion of CD4+ N T cells and skewing of CD8+ T cells with an increase in CM and reciprocal decrease in TEM cells were evident (Figure 1A). Analysis of innate subsets showed a significant increase in total NK cells as a proportion of live cells in AIM patients and within the NK compartment a significant decrease in the proportion of CD16+ NK cells as a proportion of total NK cells (Figure 1B), suggesting an increased proportion of immature NK cells. Monocytes (CD14+) as a proportion of live cells were significantly decreased at baseline, whereas γδ T cells as a proportion of total T cells were similar to healthy controls.
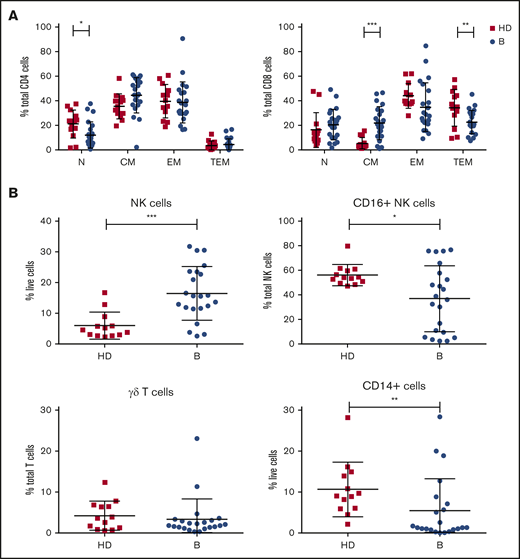
Patients treated in AIM exhibit significant dysregulation of immune subsets at baseline. (A) Flow cytometric analysis of CD4+ and CD8+ T-cell subsets. P values from an unpaired Student t test with Holm-Sidak multiple corrections. (B) NK cells, CD16+ NK cells, γδ T cells, and CD14+ cells in AIM patients at baseline (n = 16) and age-matched healthy donors (HDs; n = 13). P values from a 2-tailed Mann-Whitney U test. *P < .05, **P < .01, ***P < .001.
Patients treated in AIM exhibit significant dysregulation of immune subsets at baseline. (A) Flow cytometric analysis of CD4+ and CD8+ T-cell subsets. P values from an unpaired Student t test with Holm-Sidak multiple corrections. (B) NK cells, CD16+ NK cells, γδ T cells, and CD14+ cells in AIM patients at baseline (n = 16) and age-matched healthy donors (HDs; n = 13). P values from a 2-tailed Mann-Whitney U test. *P < .05, **P < .01, ***P < .001.
Long-term treatment with venetoclax and ibrutinib is associated with late changes in immune subsets
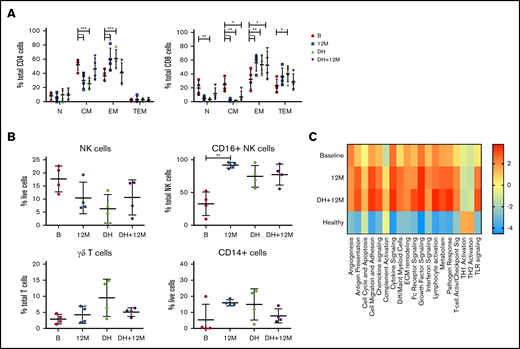
Baseline and on-treatment circulating MCL numbers have been reported previously24 and demonstrated that patients with responsive disease had minimal tumor burden at the clinical primary end point of 16 weeks, at which time patients had received 16 weeks of ibrutinib and 12 weeks of venetoclax. To assess the long-term impact of combination BCL2/BTK inhibition on off-target immune cells in the absence of tumor, immune profiling was performed at periodic time points to 48 months in patients who exhibited durable responses. Within the CD4+ T-cell compartment, a significant decrease in the percentage of CM and reciprocal increase in EM subtypes as a proportion of CD4+ T cells at 12 months were observed and maintained at 24 months (Figure 2A; supplemental Figure 1A). Ongoing therapy with venetoclax and ibrutinib resulted in significant changes in CD8+ T-cell subsets, with the frequency of N and CM cells decreased and reciprocal expansion in EM and TEM cells as a proportion of total CD8+ cells at 12 and 24 months (Figure 2A; supplemental Figure 1B), with increased variability between patients seen at 48 months. NK cells as a proportion of live cells steadily decreased over 18 months of therapy, with statistically significantly lower numbers observed after 18 to 36 months of treatment (Figure 2B; supplemental Figure 2). Within the NK cell compartment, CD16+ NK cells as a proportion of total NK cells were significantly increased at 12 months, before returning to the normal range at 18 to 48 months. Interestingly, there was a steady increase over time in the frequency of γδ T cells as a proportion of total T cells, reaching statistical significance at 36 to 48 months of therapy (Figure 2B; supplemental Figure 2). Overall, monocyte frequency (CD14+ cells) did not change over time. However, from week 16, expression of CD14 dichotomized into 2 groups, with some patients exhibiting high proportions of CD14+ cells and others low proportions of CD14+ cells, which was maintained to 36 months (Figure 2B; supplemental Figure 2). Circulating monocyte numbers have previously been reported as prognostic in some cohorts.41 Because the patients in the current study had responsive disease at the time of analysis, determining the potential impact of this monocyte change will require ongoing follow-up.
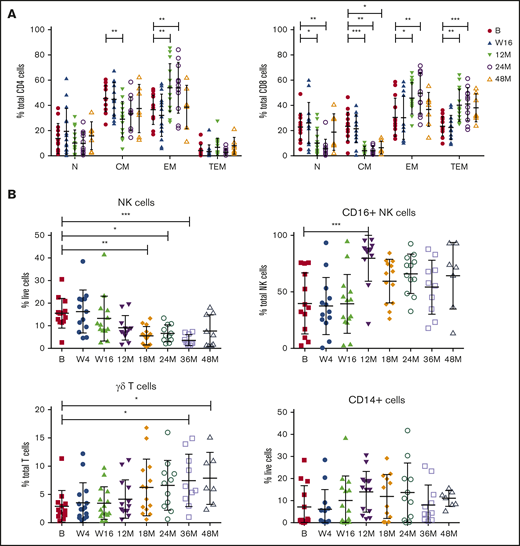
Responding patients exhibit changes in T-cell memory subsets, NK cells, CD16+NK cells, and γδ T cells with long-term treatment. Flow cytometric analysis of CD4+ and CD8+ memory subsets (A), NK cells, CD16+ NK cells, γδ T cells, and CD14+ cells at baseline (n = 13) (B), week 4 (W4; n = 13), week 16 (W16; n = 14), 12 months (M12; n = 13), 18 months (M18; n = 13), 24 months (M24; n = 11), 36 months (M36; n = 10), and 48 months (M48; n = 7). P values from 2-way analysis of variance with Dunnett’s multiple comparisons to B (A) and Kruskal-Wallis test with Dunn’s multiple comparisons to B (B). *P < .05, **P < .01, ***P < .001.
Responding patients exhibit changes in T-cell memory subsets, NK cells, CD16+NK cells, and γδ T cells with long-term treatment. Flow cytometric analysis of CD4+ and CD8+ memory subsets (A), NK cells, CD16+ NK cells, γδ T cells, and CD14+ cells at baseline (n = 13) (B), week 4 (W4; n = 13), week 16 (W16; n = 14), 12 months (M12; n = 13), 18 months (M18; n = 13), 24 months (M24; n = 11), 36 months (M36; n = 10), and 48 months (M48; n = 7). P values from 2-way analysis of variance with Dunnett’s multiple comparisons to B (A) and Kruskal-Wallis test with Dunn’s multiple comparisons to B (B). *P < .05, **P < .01, ***P < .001.
To further examine the impact of venetoclax and ibrutinib on T-cell biology, we assessed clonality and functional status. TCRβ sequencing showed that the diversity of the TCR repertoire remained stable between baseline and 1 year (Figure 3A-B), indicating that changes in the proportions of T cells, as demonstrated by flow cytometry, were likely the result of peripheral expansion of existing T-cell subsets rather than emergence of new, thymus-derived T-cell clones. Cytokine production in response to TCR signaling in vitro was assessed in CD4+ and CD8+ T cells from a subset of 6 patients who underwent TCR sequencing with matched samples available across 4 time points. Two patients exhibited increased production of TNFα, IL-2, and interferon γ at early time points compared with controls, which subsequently normalized, consistent with the remainder of the cohort by week 56 of treatment (Figure 3C; supplemental Figure 3).

Functional capacity but not TCR repertoire changes in T cells with long-term treatment. (A-B) TCRβ repertoire was measured at baseline and 12 months. Representative data from 1 patient (A) and inverse Simpson’s measurement of diversity (n = 13) (B). (C) Cytokine production in CD8+ T cells from PBMCs stimulated with CD3/28 T-cell activation beads at baseline and on treatment (n = 6): TNF+, IL-2+, and interferon γ positive (IFN+). Dotted line indicates average cytokine percentage in 8 age-matched donors. P values from a Wilcoxon’s matched-pairs signed rank test compared with baseline. *P < .05.
Functional capacity but not TCR repertoire changes in T cells with long-term treatment. (A-B) TCRβ repertoire was measured at baseline and 12 months. Representative data from 1 patient (A) and inverse Simpson’s measurement of diversity (n = 13) (B). (C) Cytokine production in CD8+ T cells from PBMCs stimulated with CD3/28 T-cell activation beads at baseline and on treatment (n = 6): TNF+, IL-2+, and interferon γ positive (IFN+). Dotted line indicates average cytokine percentage in 8 age-matched donors. P values from a Wilcoxon’s matched-pairs signed rank test compared with baseline. *P < .05.
Myeloid genes and pathways are significantly upregulated after venetoclax and ibrutinib treatment
Given our observation in changes in T-cell function, a global assessment of immune function was performed on PBMC RNA in 13 patients with responsive disease using the NanoString PanCancer Immune Profiling gene expression panel at baseline and weeks 4, 16, and 56. Analysis of pathway signature scores showed downregulation of pathways associated with B-cell functions (consistent with clearance of circulating MCL cells and normal B cells), chemokines, leukocyte functions, cytotoxicity, interleukins, and senescence. Conversely, pathway signatures related to cell adhesion, TNF superfamily, transporter functions, antigen processing, cell functions, and T-cell functions were upregulated at week 56 (Figure 4A). Overall, 26 genes had significant changes in expression levels between baseline and week 56 (Figure 4B). Concordant with the depletion of B cells, the top downregulated gene was CD22; inducible T-cell costimulator ligand was the only other significantly downregulated gene. The top upregulated gene was cathepsin S (CTSS); multiple other genes associated with myeloid responses were also upregulated (including Fc fragment of immunoglobulin Eγ, S100A8 (subunit of calprotectin), CD14, and Fc fragment of immunoglobulin GIIa), and total macrophage score was significantly increased at week 56 (Figure 4C). Overall, these results indicate that reduction in disease burden and establishment of tumor control are associated with significant changes in PB immune function. Given that by flow cytometry the major changes in cell subsets were within the T and NK compartments (Figure 2A-B), it is interesting to note that the top upregulated genes were expressed within the monocyte compartment.
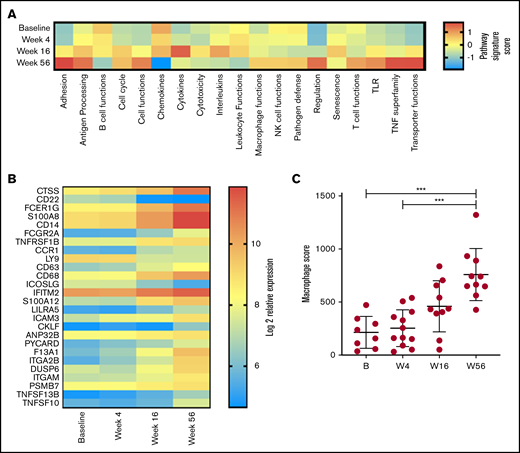
Changes in immune profile assessed using NanoString Immune Profiling Panel shows significant upregulation of myeloid genes and pathways. (A) Pathway signature scores determined using NanoString Advanced Analysis Module at baseline (B; n = 8), week 4 (W4; n = 12), week 16 (W16; n = 10), and week 56 (W56; n = 10). (B) Expression of genes at all time points analyzed that showed a statistically significant (P < .05) change in expression between B and W56 listed from most to least significant. (C) Macrophage cell score determined using NanoString Advanced Analysis Module at B (n = 8), W4 (n = 12), W16 (n = 10), and W56 (n = 10). P values from a Kruskal-Wallis test with Dunn’s multiple comparisons. ***P < .001.
Changes in immune profile assessed using NanoString Immune Profiling Panel shows significant upregulation of myeloid genes and pathways. (A) Pathway signature scores determined using NanoString Advanced Analysis Module at baseline (B; n = 8), week 4 (W4; n = 12), week 16 (W16; n = 10), and week 56 (W56; n = 10). (B) Expression of genes at all time points analyzed that showed a statistically significant (P < .05) change in expression between B and W56 listed from most to least significant. (C) Macrophage cell score determined using NanoString Advanced Analysis Module at B (n = 8), W4 (n = 12), W16 (n = 10), and W56 (n = 10). P values from a Kruskal-Wallis test with Dunn’s multiple comparisons. ***P < .001.
On the basis of these initial observations, the monocyte compartment was analyzed in more detail using the NanoString Myeloid Inflammation Panel, with the addition of 9 age-matched healthy donor samples. In almost every pathway analyzed, expression in patients with MCL at baseline was low, increased over time to week 56, and was expressed at a higher level than healthy control samples (Figure 5A). Conversely, TH1 and TH2 activation pathways were unchanged with treatment and comparable to those of healthy donors, whereas chemokine signaling was reduced at week 56 below that of baseline and healthy donors. At an individual-gene level, 67 genes were significantly upregulated at week 56 compared with baseline (Figure 5B), with CTSS and S100A11 being the top upregulated genes (Figure 5C) and multiple members of both the cathepsin (CTSA and CTSD) and S100 (S100A8, S100A9, S100A10, and S100A4) families also highly upregulated. Upregulation of S100A11 has been reported to be involved in intracellular tumor promotion, via increased EGF transcription,42 and to act as an extracellular tumor suppressor, via increased transcription of CDKN1A. Expression of EGF but not CDKN1A was increased with treatment in this cohort (supplemental Figure 4), suggesting S100A11 was acting as a growth promoter in this instance; however, the levels of EGF expression in PBMCs did not exceed those seen in healthy donors. In agreement with this, the plasma levels of S100A11 were in the range of healthy donors at all time points (supplemental Figure 4).
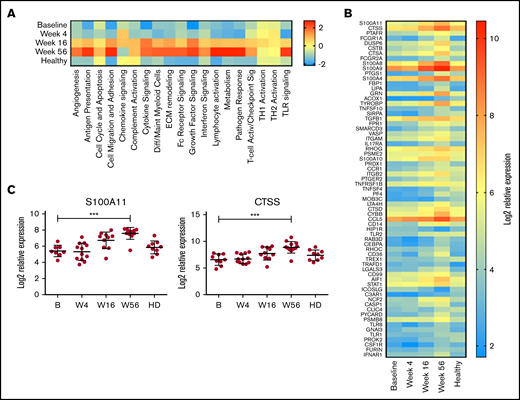
Myeloid inflammation–associated pathways are upregulated with long-term treatment. PBMCs at baseline (B; n = 10), week 4 (W4; n = 11), week 16 (W16; n = 11), and week 56 (W56; n = 12) plus age-matched healthy controls (n = 9) were analyzed using NanoString Myeloid Inflammation Panel. (A) Pathway signature scores determined using NanoString Advanced Analysis Module. (B) Expression of genes at all time points analyzed that showed a statistically significant (P < .05) change in expression between B and W56 listed from most to least significant. (C) Expression profile of S100A11 and CTSS. P values from a Kruskal-Wallis test Dunn’s multiple comparisons to B. ***P < .001.
Myeloid inflammation–associated pathways are upregulated with long-term treatment. PBMCs at baseline (B; n = 10), week 4 (W4; n = 11), week 16 (W16; n = 11), and week 56 (W56; n = 12) plus age-matched healthy controls (n = 9) were analyzed using NanoString Myeloid Inflammation Panel. (A) Pathway signature scores determined using NanoString Advanced Analysis Module. (B) Expression of genes at all time points analyzed that showed a statistically significant (P < .05) change in expression between B and W56 listed from most to least significant. (C) Expression profile of S100A11 and CTSS. P values from a Kruskal-Wallis test Dunn’s multiple comparisons to B. ***P < .001.
Drug cessation after deep remission sustains normalization of immune subsets
At the treating physician’s discretion, patients in deep remission (confirmed MRD− CR on 2 consecutive occasions at least 3 months apart) were permitted to commence a drug holiday (DH) of study drugs. Four patients meeting these criteria interrupted therapy and samples collected 12 to 18 months after drug cessation were analyzed to determine if the changes in immune profile while on active therapy would reverse in the absence of sustained BCL2/BTK inhibition. Flow cytometric analysis of samples at baseline, after 12 months on treatment, at the start of DH, and after 12 to 18 months of DH demonstrated that after ≥12 months of drug withdrawal, CD4+ CM and EM T cells returned to those levels observed at baseline, suggesting a primary effect of drug exposure on CD4+ T-cell biology. Conversely, CD8+ T-cell subsets, which had shown skewing at baseline and subsequent normalization on therapy, were maintained at normal levels on DH (Figure 6A). In addition, 2 of the patients analyzed for cytokine production (Figure 3C) were on DH at the time of their last sample time point, demonstrating that T-cell function normalization was maintained. Similarly, the levels of NK cells, CD16+ NK cells, γδ T cells, and CD14+ cells were sustained at levels comparable to those of healthy controls during DH (Figure 6B). However, analysis of myeloid gene expression showed that upregulated pathway signaling at 12 months was maintained after 12 months of DH in these 4 patients and remained above levels seen at baseline and in healthy donors (Figure 6C). Therefore, although both T-cell and innate populations were normalized in the absence of both tumor and BCL2/BTK inhibition, myeloid populations showed a continued upregulation in multiple pathways that did not return to normal levels, even after >12 months without ongoing drug exposure, suggesting that the combination of BCL2/BTK inhibition has a sustained effect on myeloid populations.
Changes in innate populations and CD8 T cells are maintained in patients on DH for 12 months. Flow cytometric analysis of CD4+ and CD8+ memory subsets (A), NK cells, CD16+ NK cells, γδ T cells, and CD14+ cells (B) at baseline, 12 months (M12), start of DH, and 12 to 18 months off study drugs (DH+12M; n = 4). P values from a 2-way analysis of variance with Dunnett’s multiple comparisons to B (A) and Kruskal-Wallis test Dunn’s multiple comparisons to B (B). (C) NanoString myeloid inflammation analysis in patients on DH (n = 4). *P < .05, **P < .01, ***P < .001.
Changes in innate populations and CD8 T cells are maintained in patients on DH for 12 months. Flow cytometric analysis of CD4+ and CD8+ memory subsets (A), NK cells, CD16+ NK cells, γδ T cells, and CD14+ cells (B) at baseline, 12 months (M12), start of DH, and 12 to 18 months off study drugs (DH+12M; n = 4). P values from a 2-way analysis of variance with Dunnett’s multiple comparisons to B (A) and Kruskal-Wallis test Dunn’s multiple comparisons to B (B). (C) NanoString myeloid inflammation analysis in patients on DH (n = 4). *P < .05, **P < .01, ***P < .001.
Discussion
We report a planned substudy analysis from the AIM trial of the effects of combination venetoclax and ibrutinib on long-term changes in immunity in patients with relapsed MCL. The AIM trial was the first study to report the use of combination venetoclax and ibrutinib and provided a unique opportunity to explore the immunological consequences of concurrent BTK/BCL2 inhibition over 48 months of therapy.
The immunology of relapsed MCL is an understudied area, and our results show significant defects in cytotoxicity/antigen presentation, with decreased CD8+ EM cells, mature NK cells, and monocytes at baseline. Furthermore, patients who attained durable disease responses exhibited normalization of PB immunity within CD4+ T-cell, innate, and myeloid compartments. Patients showed rapid clinical responses to combination therapy, with a median time to maximal disease response of 3 months, with a majority of patients achieving CR by 16 weeks.24 Importantly, the immunological changes were not observed until at least 9 to 12 months after drug initiation, indicating that sustained exposure to BTK/BCL2 inhibition was required for the observed immunological alterations to develop, reflecting either (or possibly both) the direct immune-shaping effects of the drug therapy itself or the sustained freedom from active MCL disease as a driver of immunological recovery. We had the opportunity to assess this further by examining PB immunity in patients who, after a period of sustained disease control, had drug therapy withdrawn. These 4 patients showed, despite ongoing remission of MCL, upregulation of multiple myeloid-associated pathways. Although drug withdrawal was associated with an increase in EM cells (CD4+ and CD8+ T cells) and decrease in CM cells (CD4+ T cells), they returned to the levels seen in healthy donors, and therefore, the on-therapy changes were due to a direct effect of drug exposure on these subsets rather than control over the underlying MCL.
As discussed, ibrutinib has a wide spectrum of activity against a range of Tec family kinases, which influence maturation and activation status of T-cell subsets. Similar changes in CD4+ and CD8+ T-cell subsets with long-term ibrutinib treatment have previously been reported in chronic lymphocytic leukemia (CLL) patients, without evidence of TH1/TH2 skewing.27 We observed a sustained gradual increase in γδ T cells during 48 months of venetoclax and ibrutinib exposure. Consistent with this, others have also seen ibrutinib-induced changes in γδ T-cell biology, including reversal of CLL-associated Vγ9Vδ2 T-cell dysfunction and promotion of an antitumor TH1 phenotype, raising the potential use of this T-cell subset in adoptive cellular therapy.43 Indeed, ibrutinib has been used as a pre–T-cell collection strategy in patients with CLL for whom CAR T-cell treatment is planned.44,45 Although this strategy has been primarily aimed at debulking before cellular immunotherapy, analysis of the starting T cells has found, similar to our observations, enrichment for EM T cells and an improved CAR T-cell product.44,46,47
Similarly, venetoclax exposure results in a reduction of those lymphocyte populations that are most dependent on BCL2 expression, including activated/senescent CM and TEM populations, resulting in a compensatory increase of N and EM populations.28 Importantly, the observed normalization of T-cell subsets after venetoclax and ibrutinib exposure occurred despite an absence of change in T-cell repertoire between baseline and week 56, indicating that normalization of lymphocyte subsets was not due to emergence of new T-cell clones and rather reflected an enrichment of existing PB populations.
The effect of extended venetoclax and ibrutinib exposure on both CD14+ cells by flow cytometric analysis and upregulation of myeloid-associated pathways by gene expression is consistent with previously described resistance of monocyte populations to BCL2 inhibition. In both healthy and malignant patient samples (acute myeloid leukemia and multiple myeloma), in vitro assays have shown that CD19+ B cells are most sensitive to venetoclax (50% inhibitory concentration [IC50] 0.4-12 nM), with CD4+ T cells, NK cells, and NK T cells sensitive at higher doses (IC50 100 nM to 1 μM), whereas monocytes and granulocytes are relatively resistant (IC50 10 μM).48 Monocyte subclone resistance to venetoclax has been shown in patients undergoing therapy for acute myeloid leukemia.49 This differing cell lineage sensitivity may lead to a positive selective pressure on monocyte populations with long-term treatment. Our observations suggest that sustained venetoclax exposure may further allow myeloid clonal selection, particularly within the monocyte compartment, which persists despite drug withdrawal.
This study is limited by the number of patients analyzed. Comparison of the results presented here with those in other cohorts of patients treated with both single-agent and combination therapy is required to validate these findings and dissect the relative contributions of the BTK and BCL2 pathways to the changes described. Importantly, this will need to be assessed after at least 1 year of therapy, well beyond the timeframes used for clinical response assessments. In addition, further analysis of the monocyte compartment is required to determine which subsets are affected by combination inhibition.
Overall, our study indicates that in addition to a potent antitumor effect, sustained combination venetoclax and ibrutinib in MCL results in normalization of the evaluated aspects of T-cell immunobiology and reshaping of the monocyte compartment, which persists after drug withdrawal. The direct enhancement of EM T-cell populations may provide an opportunity for the planned collection of lymphocyte populations at 12 months for the potential application of adoptive cellular therapy strategies after optimal disease control has been achieved.
The data sets generated/analyzed in this study are available from the corresponding author, Rachel M. Koldej (rachel.koldej@mh.org.au), upon request.
Acknowledgments
The authors acknowledge the Melbourne Cytometry Platform for access to flow cytometric instruments.
This study was supported, in part, by the CLL Global Research Foundation, Wilson Centre for Lymphoma Genomics, Snowdome Foundation, and Royal Melbourne Hospital Foundation.
Authorship
Contribution: C.S.T., D.S.R., and R.M.K. were responsible for the study concept/design; J.E.D., S.M.H., M.L.-M., C.S., P.B., and R.M.K. acquired, analyzed, and interpreted data; C.S.T., M.A.A., A.W.R., and J.F.S. were responsible for ongoing clinical outcome data; all authors helped draft the paper; and D.S.R. and R.M.K. supervised the project.
Conflict-of-interest disclosure: M.A.A. is an employee of Walter and Eliza Hall Institute, which receives milestone and loyalty payments related to venetoclax (M.A.A. receives a financial benefit from these payments), and receives honoraria from AbbVie. A.W.R. receives research funding from AbbVie, is an unremunerated advisor to AbbVie Australia, and is an employee of Walter and Eliza Hall Institute of Medical Research, which receives milestone and royalty payments related to venetoclax (A.W.R. receives a financial benefit from these payments). J.F.S. and C.S.T. have received honoraria and institutional research funding from AbbVie. The remaining authors declare no competing financial interests.
Correspondence: Rachel Koldej, ACRF Translational Research Laboratory, Royal Melbourne Hospital, 300 Grattan St, Parkville, VIC 3050, Australia; e-mail: rachel.koldej@mh.org.au.

