

Key Points
CH is prevalent in patients with angioimmunoblastic T-cell lymphoma.
Divergent clonal evolution of CH leads to therapy-related MNs in angioimmunoblastic T-cell lymphoma patients.

Abstract
TET2 and DNMT3A mutations are frequently identified in T-cell lymphomas of T follicular helper cell origin (TCL-TFH), clonal hematopoiesis (CH), and myeloid neoplasms (MNs). The relationships among these 3 entities, however, are not well understood. We performed comprehensive genomic studies on paired bone marrow and tissue samples as well as on flow cytometry–sorted bone marrow and peripheral blood subpopulations from a cohort of 22 patients with TCL-TFH to identify shared CH-type mutations in various hematopoietic cell compartments. Identical mutations were detected in the neoplastic T-cell and myeloid compartments of 15 out of 22 patients (68%), including TET2 (14/15) and DNMT3A (10/15). Four patients developed MNs, all of which shared CH-type mutations with their TCL-TFH; additional unique genetic alterations were also detected in each patient’s TCL-TFH and MN. These data demonstrate that CH is prevalent in patients with TCL-TFH and that divergent evolution of a CH clone may give rise to both TCL-TFH and MNs.
Introduction
Angioimmunoblastic T-cell lymphoma (AITL) and nodal peripheral T-cell lymphoma with T follicular helper phenotype (PTCL-TFH) (both will be referred to as AITL hereafter) are aggressive lymphomas,1 which frequently harbor mutations in the epigenetic modifiers TET2, DNMT3A, and IDH2 and the small GTPase RHOA.2-10 TET2 and DNMT3A mutations are also common in clonal hematopoiesis (CH)11-14 and myeloid neoplasms (MNs).15-17 It has been hypothesized that TET2 and DNMT3A mutations in AITL originate in hematopoietic stem/progenitor cells (HSPCs), which is supported by a few reports identifying these mutations in myeloid-derived cells of AITL patients.7,18-20 However, the relationships among CH, AITL, and MNs are not well understood. Herein, through comprehensive genomic evaluation of paired tissue and bone marrow (BM) samples as well as flow cytometry (FC)–sorted BM and peripheral blood (PB) subpopulations from a cohort of patients with AITL, we present compelling evidence that CH is prevalent in AITL patients and that it can divergently evolve to AITL and MNs.
Materials and methods
Patient and specimen selection
Patients with pathologically confirmed AITL or PTCL-TFH diagnosed between January 2011 and July 2019 as well as paired tissue involved by AITL and BM samples and/or FC-sorted BM samples available for targeted next-generation sequencing (NGS) were identified. All cases were independently reviewed by at least 2 hematopathologists (N.E.L. and W.X.). Clinical data were obtained from electronic medical records. The study was approved by the Institutional Review Board of Memorial Sloan Kettering Cancer Center and written informed consent was obtained from all patients.
FC and cell sorting
Multiparameter FC analysis was performed on 21 of the 22 BM samples. Where live cells were available, FC cell sorting was performed on BM (n = 6) or PB (n = 3).
Cytogenetic and mutational analysis
Conventional karyotype, fluorescence in situ hybridization, and/or T-cell receptor (TCR) gene rearrangement analysis were performed on BMs during clinical workup. Targeted NGS-based mutational analysis was performed on tissues, BMs, and FC-sorted cells using various assays (supplemental Methods; supplemental Table 1). A droplet digital polymerase chain reaction assay was also performed on selected BM and PB samples (n = 4) (supplemental Table 1). Only mutations with variant allele frequencies (VAFs) of ≥2% were included in our analysis. In non–FC-sorted BM samples, VAFs of mutations and percent involvement by AITL were compared to identify the cellular compartment in which a mutation was present (neoplastic T cells or myeloid compartment). Mutations were considered present in the BM myeloid compartment if their VAFs were ≥4 times the AITL percentage.
Statistical analysis
Overall and progression-free survival was evaluated using Kaplan-Meier analysis. Categorical variables were compared using Fisher’s exact test.
Results
CH-type mutations are frequently shared in both neoplastic T cells and myeloid compartments among patients with AITL
We identified 71 patients with AITL or PTCL-TFH and with NGS analysis of diagnostic lymphoma samples, among which 64 (90%) and 23 (32%) harbored TET2 and DNMT3A mutations, respectively, consistent with the literature.5,6,8,9 All but 2 of the DNMT3A-mutated cases also carried TET2 mutations. Twenty-two of the TET2-mutated patients had NGS studies previously performed on BM (n = 10) or had BM samples available for sequencing (n = 12). Of note, 1 patient was identified with a pathologically confirmed diagnosis of a myeloproliferative neoplasm (MPN) with a JAK2 p.V617F mutation reportedly detected at an outside institution, which preceded development of AITL. However, as no BM or PB samples were available at our institution for sequencing, this case was excluded. Clinical characteristics of the cohort are described in Table 1. Sequencing of the AITLs (Figure 1A-B) identified mutations of TET2 in 22 out of 22 cases (100%), DNMT3A in 13 out of 22 cases (59%), RHOA G17V in 12 out of 22 cases (55%), and IDH2 R172 in 7 out of 22 cases (32%) (Figure 1D; Table 2; supplemental Figure 1; supplemental Table 2), a mutational profile characteristic of AITL.2-10
Clinical characteristics of 22 patients with AITL
| Patient | Sex | Age, y | Prior cancer history (treatment, dates) | Date of AITL diagnosis | Tissue used for NGS | BM bx date | Indication for BM bx | MN diagnosed on BM bx (type) | AITL-directed therapy prior to BM bx | Outcome | Overall survival, mo* |
|---|---|---|---|---|---|---|---|---|---|---|---|
| 1 | M | 61 | None | 11/12/15 | LN | 8/29/17 | Worsening anemia, TCP on chemo that persisted 2 mo after completion | No | Chemo, ASCT, localized XRT | DOD | 22 |
| 2† | M | 72 | Prostate ca (XRT, 2015), smoldering MM (observation, 2016) | 7/12/17 | NA (NGS performed on FC sorted abnormal T cells from staging BM bx on 7/18/17) | 8/28/19 | New anemia, TCP 1.75 y after completion of chemo | Yes (MDS-SLD) | Chemo | DOD; progressed to MDS-EB-2 | 28 |
| 3 | F | 75 | None | 4/2/15 | LN | 1/14/16 | Restaging at relapse | No | Chemo | DOD | 12 |
| 4† | M | 67 | None | 5/4/11 | LN | 9/19/11 | End of treatment bx | No | Chemo | DOD | 54 |
| 5† | F | 68 | Breast ca (chemo, XRT, hormonal therapy, 1997 and 2000) | 12/23/15 | Mesenteric mass | 5/15/17 | Evaluate disease status at relapse | No | Chemo | DOD | 46 |
| 6† | F | 73 | None | 3/4/15 | LN | 3/20/15 | Initial staging | No | None | DOD | 37 |
| 7† | M | 44 | None | 8/9/17 | Subcutaneous mass | 9/15/17 | Initial staging | No | None | A w/o active D | 27 |
| 8† | F | 82 | None | 8/8/14 | LN | 12/18/15 | Acutely worsening pancytopenia 12 mo after completion of chemo | No | Chemo | AWD | 63 |
| 9† | M | 53 | None | 11/20/14 | Skin | 10/5/16 | Persistent TCP 17 mo after completion of chemo | No | Chemo | DOD | 41 |
| 10† | F | 63 | None | 4/20/16 | LN | 12/10/18 | Persistent pancytopenia 6 mo after ASCT | Yes (AML) | Chemo, ASCT | DOD | 33 |
| 11† | M | 71 | None | 3/23/15 | LN | 12/10/18 | Worsening pancytopenia on clinical trial that persisted 1.75 mo after therapy cessation | Yes (MDS-EB-1) | Chemo | A w/o D; progressed to AML | 56 |
| 12 | M | 69 | None | 8/7/18 | LN | 11/2/18 | Repeat after possibility of MN raised on outside initial staging BM bx | No | Chemo | A w/o active D | 15 |
| 13† | M | 74 | None | 7/16/19 | LN | 7/30/19 | Initial staging | No | None | AWD | 4 |
| 14 | F | 61 | Classical Hodgkin lymphoma (chemo, XRT, 2007) | 12/7/11 | LN | 1/5/18 | Confirm relapse | No | Chemo, ASCT, TT | A w/o D | 95 |
| 15† | F | 81 | None | 6/10/14 | LN | 6/13/14 | Initial staging | No | None | A w/o active D | 65 |
| 16 | M | 73 | Prostate ca (active surveillance then resection in 2017) | 2/19/15 | LN | 3/4/15 | Initial staging | No | None | A w/o D | 57 |
| 17† | F | 69 | None | 8/11/11 | Skin | 3/16/18 | Persistent cytopenias 18 mo after relapse (on therapy) and assess disease status at first visit to our institution | No | Chemo, ASCT | AWD | 98 |
| 18 | M | 71 | Clear cell RCC (excision, 2004; recurrence/metastasis, observed since 2012) | 3/5/15 | LN | 3/2/18 | Staging of newly diagnosed laryngeal plasmacytoma | No | Chemo | A w/o D | 57 |
| 19 | M | 67 | None | 7/12/17 | LN | 8/8/17 | Initial staging | No | None | DOD | 7 |
| 20† | M | 93 | Melanoma (excision, 2016) | 11/30/17 | NA (NGS performed on FC sorted abnormal T-cells from staging BM bx on 12/22/17) | 12/22/17 | Initial staging | No | None | AWD | 19 |
| 21† | M | 66 | Bladder ca (excision, date unknown) | 12/19/14 | Spleen | 1/8/18 | Required for clinical trial enrollment at time of relapse | No | Chemo, TT | AWD | 59 |
| 22† | M | 73 | None | 9/30/16 | LN | 7/11/19 | Required for clinical trial enrollment at time of relapse | Yes (CMML-0) | Chemo, ASCT | A w/o active D; persistent CMML | 37 |
A w/o D, alive without evidence of disease (AITL); AML, acute myeloid leukemia; ASCT, autologous stem cell transplant; AWD, alive with disease (AITL); bx, biopsy; ca, cancer; chemo, chemotherapy; CMML-0, chronic myelomonocytic leukemia 0; DLBCL, diffuse large B-cell lymphoma; DOD, dead of disease; F, female; LAD, lymphadenopathy; LN, lymph node; M, male; MDS-EB-1, myelodysplastic syndrome with excess blasts 1; MDS-EB-2, myelodysplastic syndrome with excess blasts 2; MDS-SLD, myelodysplastic syndrome with single lineage dysplasia; MM, multiple myeloma; NA, not applicable; RCC, renal cell carcinoma; TCP, thrombocytopenia; TT, targeted therapy; XRT, radiation.
Overall survival indicates the time from AITL diagnosis to date of death or last follow-up.
Patients with evidence of shared mutations in their AITL and non-AITL BM compartment.
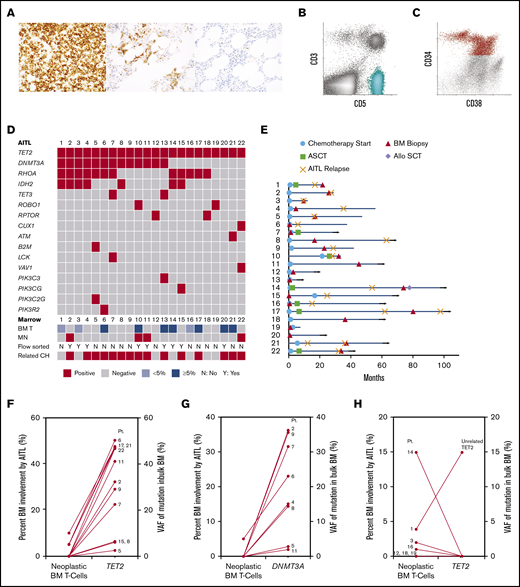
Histologic, flow cytometric, clinical and mutational features of 22 patients with AITL. (A) Photomicrographs of PD-1 immunohistochemical stains from 3 patients (original magnification ×400). An example lymph node biopsy specimen from patient 16 (far left) demonstrates a proliferation of strongly PD-1–positive T cells, consistent with AITL. The middle image depicts a BM biopsy specimen from patient 14 with lymphohistiocytic aggregates containing PD-1–positive T cells, consistent with involvement by AITL. The far right image depicts a BM biopsy specimen from patient 11 that showed small lymphoid aggregates that were negative for PD-1, consistent with a reactive infiltrate, which was confirmed by FC. (B-C) Scatterplots from FC analyses of a BM involved by AITL (patient 17) (B, aqua neoplastic T-cell population) and a BM involved by MDS (patient 2) (C, red CD34+ abnormal myeloid blast population). (D) Mutations detected in the AITL of each patient (each column represents 1 patient and is annotated with the patient’s identification number). The degree of AITL involvement in each patient’s paired BM (BM T), as well as whether a MN was identified, whether FC sorting was performed, and if shared TET2 and/or DNMT3A mutations were detected in the myeloid compartment (related CH), are also indicated in the bottom rows. (E) Swimmer plot indicating the time points at which the sequenced BM biopsy was obtained, chemotherapy was initiated, or autologous or allogeneic stem cell transplant (ASCT or Allo SCT, respectively) was performed, as well as points of AITL relapse for each patient (each row represents 1 patient and is annotated with the patient's identification number). Month 0 indicates the time at which AITL was first diagnosed. Horizontal arrows indicate patients alive at last follow-up. (F-G) Comparison of the level of BM involvement by AITL (neoplastic BM T cells) to the VAFs of the TET2 and DNMT3A mutations detected in the sequenced bulk BMs among patients with shared TET2 (F) and DNMT3A (G) mutations. (H) Patients without shared TET2 mutations. Each line represents one patient and is annotated with the corresponding patient identification number.
Histologic, flow cytometric, clinical and mutational features of 22 patients with AITL. (A) Photomicrographs of PD-1 immunohistochemical stains from 3 patients (original magnification ×400). An example lymph node biopsy specimen from patient 16 (far left) demonstrates a proliferation of strongly PD-1–positive T cells, consistent with AITL. The middle image depicts a BM biopsy specimen from patient 14 with lymphohistiocytic aggregates containing PD-1–positive T cells, consistent with involvement by AITL. The far right image depicts a BM biopsy specimen from patient 11 that showed small lymphoid aggregates that were negative for PD-1, consistent with a reactive infiltrate, which was confirmed by FC. (B-C) Scatterplots from FC analyses of a BM involved by AITL (patient 17) (B, aqua neoplastic T-cell population) and a BM involved by MDS (patient 2) (C, red CD34+ abnormal myeloid blast population). (D) Mutations detected in the AITL of each patient (each column represents 1 patient and is annotated with the patient’s identification number). The degree of AITL involvement in each patient’s paired BM (BM T), as well as whether a MN was identified, whether FC sorting was performed, and if shared TET2 and/or DNMT3A mutations were detected in the myeloid compartment (related CH), are also indicated in the bottom rows. (E) Swimmer plot indicating the time points at which the sequenced BM biopsy was obtained, chemotherapy was initiated, or autologous or allogeneic stem cell transplant (ASCT or Allo SCT, respectively) was performed, as well as points of AITL relapse for each patient (each row represents 1 patient and is annotated with the patient's identification number). Month 0 indicates the time at which AITL was first diagnosed. Horizontal arrows indicate patients alive at last follow-up. (F-G) Comparison of the level of BM involvement by AITL (neoplastic BM T cells) to the VAFs of the TET2 and DNMT3A mutations detected in the sequenced bulk BMs among patients with shared TET2 (F) and DNMT3A (G) mutations. (H) Patients without shared TET2 mutations. Each line represents one patient and is annotated with the corresponding patient identification number.
Genotyping analysis of FC sorted BM and PB subpopulations from 9 patients
| Sorted populations | ||||
|---|---|---|---|---|
| Genetic alterations | VAF in abnormal T cells | VAF in abnormal plasma cells | ||
| Patient 2† | DNMT3A p.R736C | 0.478 | 0 | |
| TET2 p.Q810* | 0.463 | 0 | ||
| TET2 p.Y1128* | 0.458 | 0 | ||
| IDH2 p.R172K | 0.406 | 0 | ||
| RHOA p.G17V | 0.459 | 0 | ||
| ATR p.D1409N | 0.206 | 0 | ||
| KMT2B p.Q757* | 0.248 | 0 | ||
| BRCA2 p.A2306S | 0 | 0.478 | ||
| BTG1 p.K29* | 0 | 0.484 | ||
| EPHA5 p.G1033E | 0 | 0.229 | ||
| KMT2D p.H1525Pfs*37 | 0 | 0.248 | ||
| SETD5 p.Y987F | 0 | 0.345 | ||
| Patient 3†‡ | VAF in abnormal T cells | VAF in monocytes | ||
| TET2 p.Y592fs | 0.505 | 0.005 | ||
| DNMT3A exon11 splicing variant (c.1279+1G>A) | 0.473 | 0.003 | ||
| IDH2 p.R172K | 0.489 | 0.002 | ||
| RHOA p.G17V | 0.479 | 0.001 | ||
| Patient 4†‡ | VAF in abnormal T cells | VAF in monocytes | ||
| TET2 p.Y1337* | 0.550 | 0 | ||
| DNMT3A p.W795C | 0.488 | 0.065 | ||
| IDH2 p.R172G | 0 | 0 | ||
| RHOA p.G17V | 0.491 | 0 | ||
| Patient 10 | VAF in abnormal T cells | VAF in abnormal CD34+ myeloid blasts | VAF in monocytes | |
| TET2 p.C1289Y | 0.506 | 0.481 | 0.478 | |
| TET2 p.L1899Sfs*9 | 0.446 | 0.32 | 0.542 | |
| DNMT3A p.R771* | 0.51 | 0.4 | 0.514 | |
| DNMT3A p.C861Y | 0 | 0.406 | 0.359 | |
| RUNX1 p.A329Sfs*271 | 0 | 0.621 | 0.423 | |
| ARID1B p.S914N | 0.349 | 0 | 0 | |
| DDX3X p.V526A | 0.234 | 0 | 0 | |
| NFE2 p.T318A | 0.341 | 0 | 0 | |
| ROBO1 p.G904R | 0.516 | 0 | 0 | |
| Patient 11 | VAF in abnormal CD34+ myeloid blasts | VAF in abnormal CD117+/CD34− blasts | VAF in normal lymphocytes | |
| TET2 p.C484fs | 0.128 | 0.394 | 0.148 | |
| TET2 p.L757fs | 0.196 | 0.463 | 0.139 | |
| DNMT3A p.I471* | 0.180 | 0 | 0.009 | |
| EPHA5 p.D136N | 0 | 0 | 0 | |
| WT1 p.S189* | 0 | 0.371 | 0 | |
| WT1 p.S71Lfs*128 | 0 | 0.029 | 0 | |
| Patient 13 | VAF in abnormal T cells | VAF in normal myeloid cells | VAF in normal B cells | |
| DNMT3A p.K455* | 0.485 | 0.375 | 0.206 | |
| TET2 p.G641W | 0.465 | 0.085 | 0.196 | |
| TET2 p.S631* | 0.477 | 0.084 | 0.198 | |
| TET2 p.Q1030* | 0 | 0.250 | 0 | |
| SF3B1 p.K700E | 0 | 0.205 | 0 | |
| TET2 p.V1232Gfs*21 | 0 | 0 | 0.11 | |
| TET3 p.C695Y | 0.502 | 0 | 0 | |
| TET3 p.C693G | 0.475 | 0 | 0 | |
| Patient 14†‡ | VAF in monocytes | |||
| TET2 p.C973fs | 0 | |||
| TET2 p.R1216* | 0 | |||
| IDH2 p.R172S | 0 | |||
| RHOA p.G17V | 0 | |||
| Patient 15†‡ | VAF in monocytes | |||
| TET2 p.570fs | 0.22 | |||
| IDH2 p.R172G | 0 | |||
| RHOA p.G17V | 0 | |||
| Patient 20 | VAF in abnormal T cells | VAF in granulocytes | ||
| TET2 p.R1440Tfs*38 | 0.689 | 0.327 | ||
| TET2 p.S794* | 0.045 | 0.294 | ||
| TET2 p.W1003* | 0.011 | 0.079 | ||
| TET2 p.H850Qfs*19 | 0.005 | 0.038 | ||
| DNMT3A p.R736H | 0.008 | 0.064 | ||
stop codon mutation.
Flow-sorted BM or PB samples that are different from the BM samples described in Table 1 and supplemental Figure 1 and Table 2. The BM sample from patient 2 reported in this table was obtained at the time of initial AITL diagnosis while the BM sample reported in Table 1 and supplemental Figure 1 and Table 2 was obtained ∼2 years later at the time of MDS diagnosis. The sample reported in this table from patient 3 is a PB sample obtained at the time of initial AITL diagnosis, while the BM sample reported in Table 1 and supplemental Figure 1 and Table 2 was obtained <1 year later at the time of AITL relapse. The sample reported in this table from patient 4 is a BM sample obtained at the time of AITL relapse, while the BM sample reported in Table 1 and supplemental Figure 1 and Table 2 was obtained ∼2.5 years earlier after completion of the first round of AITL-directed chemotherapy. The sample reported in this table from patient 14 is a PB sample obtained at the time of first AITL relapse, while the BM sample reported in Table 1 and supplemental Figure 1 and Table 2 was obtained <1 year later at the time of second AITL relapse. The sample reported in this table from patient 15 is a PB sample obtained during routine surveillance, while the BM sample reported in Table 1 and supplemental Figure 1 and Table 2 was obtained ∼3 years prior at initial AITL diagnosis.
Samples that were genotyped using droplet digital polymerase chain reaction.
BM biopsies (Figure 1A-C) were performed at various time points (Figure 1E), most commonly for staging purposes (n = 12) or cytopenias after therapy (n = 7) (Table 1). No patient had a prior diagnosis of a MN. BMs from 10 patients showed various degrees of AITL involvement by morphology (5% to 50% in 7 out of 22 cases [32%] and <5% in 3 out of 22 cases [14%]). The remaining 12 (55%) patients had no BM involvement morphologically, 3 of whom had measurable residual disease as detected by FC (0.0079% in patient 12 and 0.036% in patient 22) and/or TCR gene rearrangement analysis only (FC was negative in patient 7) (Figure 1A,D; supplemental Table 2).
Identical mutations were detected in the neoplastic T-cell and myeloid compartments of 15 (68%) patients, including TET2 (14/15) and DNMT3A (10/15) mutations (Figure 1D,F-H; Table 2; supplemental Figure 1; supplemental Table 2), consistent with the hypothesis that a subset of AITL originates from a TET2 and/or DNMT3A-mutated HSPC. The BMs from 9 patients had no morphologic involvement by AITL but were positive for TET2 and/or DNMT3A mutations, with VAFs of 2.4% to 46.8% and 2.8% to 36.2%, respectively (Figure 1F-G; supplemental Table 2), suggesting myeloid origin. Indeed, FC sorting of either BM or PB samples from 3 of the 9 patients (patients 4, 11, and 15) confirmed the mutations were present in the myeloid compartments (Table 2). Six patients had ≥5% involvement by AITL in the BM by morphology, 3 of whom had TET2 VAFs of ∼50% (50.3% in patient 6, 47.6% in patient 17, and 47.4% in patient 21), >4 times the percentage of neoplastic T cells (5% in patient 6, 5% in patient 17, 10% in patient 21) (Figure 1F; supplemental Table 2), inferring a myeloid origin. FC sorting of the BMs from the other 3 patients (patients 10, 13, and 20) confirmed the presence of identical TET2 with or without DNMT3A mutations in both the neoplastic T cells and myeloid populations in all 3 patients and in normal B cells in 1 case (patient 13) (Figure 2A; Table 2). To confirm the accuracy of our NGS studies, we FC sorted PB samples from 2 patients with <5% (patient 3) and 15% (patient 14) BM involvement by AITL and without evidence of shared mutations in the myeloid compartment based on VAFs from the bulk BM. We confirmed the presence of mutations in the sorted neoplastic T cells (patient 3) and not in the sorted myeloid cells (patients 3 and 14) (Table 2). Interestingly, patient 1, who died shortly after his BM biopsy, had unrelated TET2, RUNX1, and SRSF2 mutations in the BM, indicative of an independent high-risk CH (Figure 1H; supplemental Figure 1 and Table 2). Only 2 additional shared variants were identified in 2 different patients. Patient 15 harbored a shared PIK3CG p.V74M variant, while patient 22 demonstrated a shared CHEK2 p.D134G variant (supplemental Table 2). Both variants were likely somatic in nature based on the VAFs and occurred in the early clone. While these variants may play important roles in oncogenesis, including in T-cell lymphoma and MNs,21-23 whether they represented passenger or driver mutations is unclear. RHOA and IDH2 mutations identified in the lymphomas were not detected in the corresponding myeloid compartments (Table 2; supplemental Table 2).
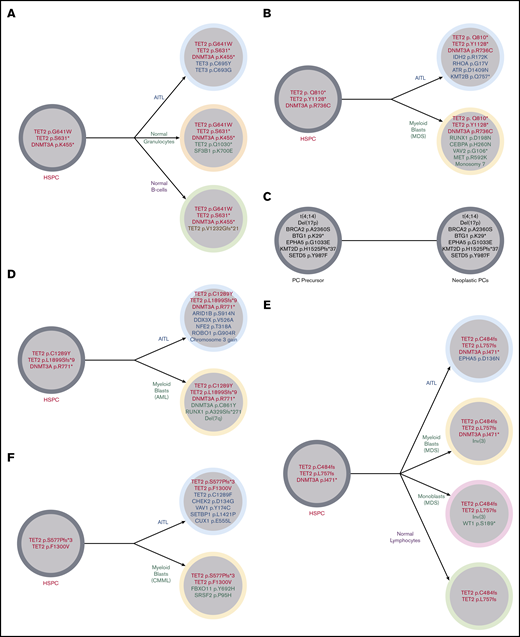
Illustration of the clonal architecture of hematopoietic cell populations from 5 patients. (A) Identical TET2 and DNMT3A mutations were detected in the FC-sorted neoplastic T cells (AITL), normal granulocytes, and normal B cells from the BM of patient 13, suggesting origin of all populations from a shared HSPC precursor harboring TET2 and DNMT3A mutations. This sequenced BM did not meet World Health Organization criteria for diagnosis of a MN. (B) Patient 2 developed MDS with a complex karyotype 2 years after being diagnosed with AITL. Identical DNMT3A and 2 TET2 mutations were identified in the FC-sorted neoplastic T cells from the patient’s original AITL staging BM (obtained 2 years prior to development of MDS) and the bulk BM obtained at the time of the MDS diagnosis (which showed no involvement by AITL), consistent with origin of both neoplasms from a common TET2- and DNMT3A-mutated HSPC precursor. Alterations limited to the AITL included RHOA, IDH2, ATR, and KMT2B mutations, while those limited to the MDS included CEBPA and RUNX1 mutations, consistent with the acquisition of separate and divergent genomic events in each neoplasm. (C) Patient 2 also had a history of smoldering plasma cell (PC) myeloma diagnosed 14 months prior to his AITL. FC sorting of neoplastic T cells and plasma cells and fluorescence in situhybridization analysis of enriched CD138+ plasma cells from his staging BM sample at the time of AITL diagnosis demonstrated differing sets of genetic alterations in each population, consistent with 2 unrelated neoplastic processes. (D) Patient 10 developed AML 2.7 years after his AITL diagnosis. FC-sorted leukemic myeloid blasts and neoplastic T cells from BM shared 2 TET2 mutations and 1 DNMT3A mutation. Alterations limited to the AML included del(7q), a RUNX1 mutation, and an additional DNMT3A mutation, while the AITL harbored a number of mutations (including ARID1B and ROBO1) and gain of chromosome 3 not seen in the AML. (E) Patient 11 developed MDS-EB-1 3.6 years after being diagnosed with AITL. Bulk AITL tissue and FC-sorted neoplastic BM myeloid blasts shared 2 TET2 mutations and 1 DNMT3A mutation; the same TET2 mutations were also identified in FC-sorted normal lymphocytes. Alterations limited to the neoplastic myeloid population included an inv(3), while only the neoplastic T cells had an EPHA5 mutation. (F) Patient 22 developed CMML-0 2.7 years after being diagnosed with AITL. Comparison of VAFs from bulk BM (negative for AITL) and tissue samples demonstrated 2 shared TET2 mutations in AITL and CMML. Only CMML harbored a SRSF2 mutation, while the AITL harbored a number of additional mutations (including an additional TET2 mutation) not identified in CMML. MDS, myelodysplastic syndrome.
Illustration of the clonal architecture of hematopoietic cell populations from 5 patients. (A) Identical TET2 and DNMT3A mutations were detected in the FC-sorted neoplastic T cells (AITL), normal granulocytes, and normal B cells from the BM of patient 13, suggesting origin of all populations from a shared HSPC precursor harboring TET2 and DNMT3A mutations. This sequenced BM did not meet World Health Organization criteria for diagnosis of a MN. (B) Patient 2 developed MDS with a complex karyotype 2 years after being diagnosed with AITL. Identical DNMT3A and 2 TET2 mutations were identified in the FC-sorted neoplastic T cells from the patient’s original AITL staging BM (obtained 2 years prior to development of MDS) and the bulk BM obtained at the time of the MDS diagnosis (which showed no involvement by AITL), consistent with origin of both neoplasms from a common TET2- and DNMT3A-mutated HSPC precursor. Alterations limited to the AITL included RHOA, IDH2, ATR, and KMT2B mutations, while those limited to the MDS included CEBPA and RUNX1 mutations, consistent with the acquisition of separate and divergent genomic events in each neoplasm. (C) Patient 2 also had a history of smoldering plasma cell (PC) myeloma diagnosed 14 months prior to his AITL. FC sorting of neoplastic T cells and plasma cells and fluorescence in situhybridization analysis of enriched CD138+ plasma cells from his staging BM sample at the time of AITL diagnosis demonstrated differing sets of genetic alterations in each population, consistent with 2 unrelated neoplastic processes. (D) Patient 10 developed AML 2.7 years after his AITL diagnosis. FC-sorted leukemic myeloid blasts and neoplastic T cells from BM shared 2 TET2 mutations and 1 DNMT3A mutation. Alterations limited to the AML included del(7q), a RUNX1 mutation, and an additional DNMT3A mutation, while the AITL harbored a number of mutations (including ARID1B and ROBO1) and gain of chromosome 3 not seen in the AML. (E) Patient 11 developed MDS-EB-1 3.6 years after being diagnosed with AITL. Bulk AITL tissue and FC-sorted neoplastic BM myeloid blasts shared 2 TET2 mutations and 1 DNMT3A mutation; the same TET2 mutations were also identified in FC-sorted normal lymphocytes. Alterations limited to the neoplastic myeloid population included an inv(3), while only the neoplastic T cells had an EPHA5 mutation. (F) Patient 22 developed CMML-0 2.7 years after being diagnosed with AITL. Comparison of VAFs from bulk BM (negative for AITL) and tissue samples demonstrated 2 shared TET2 mutations in AITL and CMML. Only CMML harbored a SRSF2 mutation, while the AITL harbored a number of additional mutations (including an additional TET2 mutation) not identified in CMML. MDS, myelodysplastic syndrome.
No difference in overall survival was seen between patients with and without CH (supplemental Figure 2). A trend toward improved progression-free survival was observed in patients without CH (median not reached vs 41 months, P = .2). Only 2 of 16 patients with CH (including patient 1 with unrelated CH) had no evidence of disease (AITL or MN) at last follow-up compared with 4 of 6 patients without CH (P = .025).
MNs in AITL patients result from divergent evolution of an early CH clone
Patients 2, 10, 11, and 22 subsequently developed MDS with a complex karyotype (including −7), AML (Figure 3), MDS-EB-1 (which progressed to AML within 6 months), and CMML-0, respectively, 2, 2.7, 3.6, and 2.7 years after their AITL diagnoses, respectively. All 4 patients shared identical CH-type mutations in their AITL and MN, including multiple TET2 mutations in 4 out of 4 patients and single DNMT3A mutations in 3 out of 3 patients with DNMT3A-mutated AITL, suggesting both malignancies arose from early clones harboring multiple CH-type mutations. The AITLs and MNs in all 4 patients also harbored multiple additional differing alterations that were not shared between them (Figure 2B-F).
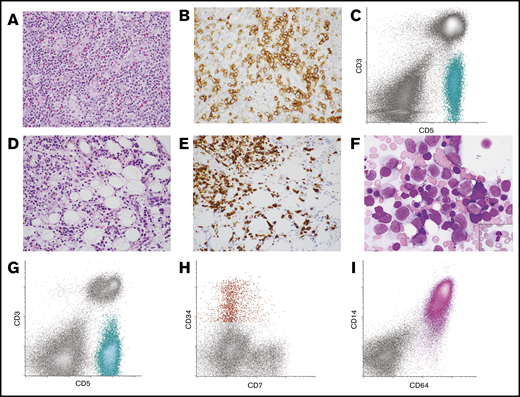
Lymph node and BM morphology with corresponding FC histograms from patient 10 with AITL and AML. (A-B) Lymph node was effaced by an infiltrate of small to intermediate-sized lymphoid cells with moderate amounts of pale cytoplasm in a background of mixed inflammatory cells and vascular proliferation (A, hematoxylin and eosin stain, original magnification ×400). (B) The neoplastic T cells expressed PD-1 by immunohistochemistry (original magnification ×400). (C) FC analysis of the lymph node demonstrated an abnormal T-cell population that was surface CD3(−) and CD5(+) (aqua population). These cells were also positive for CD4, CD2, and PD-1 (not shown). The findings were consistent with AITL. (D-F) Subsequent BM biopsy demonstrated aggregates of atypical lymphoid cells as well as increased blasts and promonocytes. (D) Hematoxylin and eosin–stained core biopsy, original magnification ×400. (E) CD3 immunohistochemistry performed on the core biopsy specimen highlighted the neoplastic T cells (original magnification ×400). (F) Wright-Giemsa–stained aspirate smear demonstrated frequent blasts/promonocytes as well as dysgranulopoiesis (inset) and dyserythropoiesis (original magnification ×1000). (G-I) FC analysis of the BM detected a surface CD3(−), CD5(+) abnormal T-cell population similar to that seen in the lymph node (aqua population) (G) as well as a small abnormal CD34(+) myeloid blast population with dim CD7 expression (red population) (H) and an expanded CD64(+) monoblast population (pink population) (I). The findings were consistent with BM involvement by both AITL and AML with monocytic differentiation.
Lymph node and BM morphology with corresponding FC histograms from patient 10 with AITL and AML. (A-B) Lymph node was effaced by an infiltrate of small to intermediate-sized lymphoid cells with moderate amounts of pale cytoplasm in a background of mixed inflammatory cells and vascular proliferation (A, hematoxylin and eosin stain, original magnification ×400). (B) The neoplastic T cells expressed PD-1 by immunohistochemistry (original magnification ×400). (C) FC analysis of the lymph node demonstrated an abnormal T-cell population that was surface CD3(−) and CD5(+) (aqua population). These cells were also positive for CD4, CD2, and PD-1 (not shown). The findings were consistent with AITL. (D-F) Subsequent BM biopsy demonstrated aggregates of atypical lymphoid cells as well as increased blasts and promonocytes. (D) Hematoxylin and eosin–stained core biopsy, original magnification ×400. (E) CD3 immunohistochemistry performed on the core biopsy specimen highlighted the neoplastic T cells (original magnification ×400). (F) Wright-Giemsa–stained aspirate smear demonstrated frequent blasts/promonocytes as well as dysgranulopoiesis (inset) and dyserythropoiesis (original magnification ×1000). (G-I) FC analysis of the BM detected a surface CD3(−), CD5(+) abnormal T-cell population similar to that seen in the lymph node (aqua population) (G) as well as a small abnormal CD34(+) myeloid blast population with dim CD7 expression (red population) (H) and an expanded CD64(+) monoblast population (pink population) (I). The findings were consistent with BM involvement by both AITL and AML with monocytic differentiation.
A PB sample from patient 2 obtained soon after his initial AITL diagnosis (∼2 weeks after his initial staging BM biopsy), prior to AITL-directed chemotherapy (and ∼2 years prior to his MDS diagnosis), demonstrated the same DNMT3A and 2 TET2 mutations as those detected in his AITL and MDS at relatively low VAFs (7%, 5%, and 5%, respectively). A concurrent FC analysis of that PB sample demonstrated an abnormal T-cell population that comprised 0.96% of the total white cells. As the VAFs of the DNMT3A and TET2 mutations were much greater (>4 times) than the percentage of circulating neoplastic T cells in this PB sample, it suggests these mutations were present in cellular compartments outside the AITL and is indicative of a low-level CH clone. At the time of MDS diagnosis, the VAFs had increased to 30% to 40%, consistent with a growth advantage conferred by these mutations under pressure of chemotherapy.
Discussion
Although this retrospective study has some selection bias, through comprehensive evaluation of the largest cohort of AITL patients to date using sensitive and accurate FC and genotyping techniques as well as FC sorting of a relatively large number of BM/PB samples, we demonstrate that AITL patients frequently harbor TET2 and DNMT3A mutant alleles in both neoplastic T-cell and myeloid compartments, confirming the findings of prior case studies.3,7,8 Additionally, using FC sorting of both neoplastic T cells and neoplastic myeloid populations, we identified identical TET2 with or without DNMT3A mutations in the AITLs and MNs of all 4 patients who developed MN, indicating both malignancies arose from a common TET2 with or without DNMT3A–mutated CH clone, as well as differing sets of genomic alterations in each neoplasm. Our data suggest that TET2 and DNMT3A mutations occur in HSPCs with the potential to clonally evolve to AITL and MN, which is driven by additional and divergent genetic events. Among patients without MNs, the sizes of the related CH clones in our cohort varied widely, from ∼2% to ∼50%. In addition, the CH clones often harbored ≥2 TET2 mutations (10 out of 15 [67%]) and/or both TET2 and DNMT3A mutations (9 out of 15 [60%]), which is more frequent than in the general population with CH (multiple mutations reported in ∼5% to 15%).11,12,24,25 The significance of CH with multiple mutations is unclear but may be associated with an increased risk of therapy-related MN.26 Overall, this pathobiology may place AITL patients at higher risk of MN, especially after chemotherapy, which may have important management and therapeutic implications.
Kommalapati et al27 evaluated the occurrence of AML after the diagnosis of AITL using Surveillance, Epidemiology, and End Results program database data and reported a higher risk of subsequent development of AML than that of the general United States population (standard incidence ratio, 23.1 between 2 and 11 months, 36.5 between 1 and 10 years, and 49.6 after 10 years). As this study was limited to patients who only developed AML (and did not include other MNs) after being diagnosed with T-cell lymphomas, these data may underestimate the true prevalence of MNs in AITL patients. Despite the possibility of selection bias, 4 of the 22 patients in our cohort developed MNs, an alarmingly high incidence. Our study infers that AITL patients should be evaluated for CH and monitored for therapy-related MN, particularly those with CH.
Our study depicts a variety of types of related MNs in AITL patients, including MDS, AML and MDS/MPN, with variable cytogenetic alterations and mutations. Interestingly, all 4 patients in our cohort with both AITL and MNs developed the MN after being diagnosed and treated for AITL with CHOP-based chemotherapy (cyclophosphamide, doxorubicin, and vincristine). In 3 of these patients, the MNs were discovered upon workup for cytopenias. Also of interest, all of the MNs in our cohort developed in a similar time frame of ∼2-4 years after the AITL diagnosis and ∼1-4 years after initiation of chemotherapy, typical of therapy-related MNs after topoisomerase II inhibitor (such as doxorubicin) therapy.28 In fact, in one of these patients (patient 2), we show that the CH clone was likely present at a low level at the time of initial AITL diagnosis and expanded more than fourfold at the time of MDS development, possibly due to the selective pressure of the AITL-directed chemotherapy. While theoretically, if AITL and MNs arise from a common CH-like clone, one may expect to see a combination of patients who develop MNs both before and after the development of AITL. Although we did identify 1 patient with a JAK2 V617F–positive MPN that preceded the diagnosis of AITL, no BM or PB samples were available for sequencing, precluding evaluation of a clonal relationship between the neoplasms. A recent study also described patients with MPNs preceding AITL, but clonal relatedness was not shown.29 In the literature, both patients with MNs preceding AITL3,7,18,20 and patients with MNs developing after AITL19,30 have been reported, although in only rare cases was a clonal link clearly demonstrated between the 2 neoplasms. Given that both scenarios have been reported, it may be that due to our sample size, we only identified patients who developed MNs following their AITL with confirmed clonal relationships. However, we cannot exclude the possibility that this reflects the underlying biology of this disease, such as a unique type of CH with greater propensity for AITL. Additional study would be needed to better understand this result.
Presented in poster form at the 12th annual T-Cell Lymphoma Forum, La Jolla, CA, 30-31 January 2020.
Original data are available from the corresponding author upon request.
Acknowledgments
This work was supported in part through the National Institutes of Health, National Cancer Institute cancer center support grant P30 CA008748. A.E.S. and A.D. are supported by a grant from the National Institutes of Health, National Cancer Institute (P50 CA192937).
Authorship
Contribution: N.E.L., M.R., A.D., and W.X. conceived the study, collected and analyzed the data, and wrote the manuscript; K.P.-D. annotated the sequencing data and wrote the manuscript; S.H., A.E.S., J.B., N.O., and M.E.A. collected data; Z.D.E.-P., A.J.M., A.K., and S.M.H. provided critical clinical information; Q.G. aided with flow cell sorting; Y.Z. reviewed the cytogenetic data; R.L.L. analyzed the data; and all authors approved the final version of the manuscript.
Conflict-of-interest disclosure: N.E.L. receives consultant fees from and is on the board of directors of United States Drug Testing Laboratories. A.J.M. has received research support from Seattle Genetics, Merck, Bristol-Myers Squibb, and Incyte; and honoraria from Kyowa Hakko Kirin Pharma, Miragen Therapeutics, Takeda Pharmaceuticals, ADC Therapeutics, Seattle Genetics, Cell Medica, and Bristol-Myers Squibb. A.K. has received research support from AbbVie Pharmaceuticals, Adaptive Biotechnologies, Pharmacyclics, and Seattle Genetics; and received research support from and acted on an advisory board for Celgene and participated in steering committees for AstraZeneca. S.M.H. has consulted for Aileron, ADCT Therapeutics, Merck, Corvus, Miragen, Innate Pharma, Millennium/Takeda, Portola, Affimed, Seattle Genetics, Astex, Celgene, Kyowa-Hakka-Kirin, Verastem, and Kura; and has received research support from Forty-Seven, Aileron, ADCT Therapeutics, Corvus, Millennium/Takeda, Portola, Seattle Genetics, Celgene, Infinity/Verastem, Trillium, and Daichii. M.E.A. has received speaker and consultant fees from Biocartis and Invivoscribe. R.L.L. is on the supervisory board of Qiagen; is a scientific advisor to Loxo (previous), Imago, C4 Therapeutics, and Isoplexis, each of which include an equity interest; received research support from Prelude; receives research support from and has consulted for Celgene and Roche and has consulted for Lilly, Janssen, Astellas, Morphosys and Novartis; and received honoraria from Roche, Lilly and Amgen for invited lectures and from Gilead for grant reviews. A.D. has received personal fees from Roche, Corvus Pharmaceuticals, Physicians' Education Resource, Seattle Genetics, Peerview Institute, Oncology Specialty Group, Celgene, Novartis, Takeda and EUSA Pharma; and research support from Roche. W.X. has received research support from Stemline Therapeutics. The remaining authors declare no competing financial interests.
The current affiliation for S.H. is Laboratory of Haematology, CHU Lyon-Sud, Hospices Civils de Lyon, Pierre-Bénite, France.
The current affiliation for N.O. is Laboratory of Pathology, National Cancer Institute, National Institutes of Health, Bethesda, MD.
Correspondence: Wenbin Xiao, Department of Pathology, Memorial Sloan Kettering Cancer Center, 1275 York Ave, New York, NY 10065; e-mail: xiaow@mskcc.org.

