

Key Points
Metabolic heterogeneity based on 18FDG-PET/CT predicts outcome of newly diagnosed DLBCL.

Abstract
Metabolic heterogeneity (MH) can be measured using 18F-fluorodeoxyglucose (18FDG) positron emission tomography/computed tomography (PET/CT), and it indicates an inhomogeneous tumor microenvironment. High MH has been shown to predict a worse prognosis for primary mediastinal B-cell lymphoma, whereas its prognostic value in diffuse large B-cell lymphoma (DLBCL) remains to be determined. In the current study, we investigated the prognostic values of MH evaluated in newly diagnosed DLBCL. In the training cohort, 86 patients treated with cyclophosphamide, doxorubicin, vincristine, and prednisone–like chemotherapies were divided into low-MH and high-MH groups using receiver operating characteristic analysis. MH was not correlated with metabolic tumor volume of the corresponding lesion, indicating that MH was independent of tumor burden. At 5 years, overall survivals were 89.5% vs 61.2% (P = .0122) and event-free survivals were 73.1% vs 51.1% (P = .0327) in the low- and high-MH groups, respectively. A multivariate Cox-regression analysis showed that MH was an independent predictive factor for overall survival. The adverse prognostic impacts of high MH were confirmed in an independent validation cohort with 64 patients. In conclusion, MH on baseline 18FDG-PET/CT scan predicts treatment outcomes for patients with newly diagnosed DLBCL.
Introduction
Diffuse large B-cell lymphoma (DLBCL) represents the largest entity of non-Hodgkin lymphoma.1 Although rituximab combined with cyclophosphamide, doxorubicin, vincristine, and prednisone has led to a remarkable improvement in the prognosis of DLBCL patients,2 a considerable proportion of patients fail to be cured.3 18F-fluorodeoxyglucose (18FDG) positron-emission tomography and computed tomography (PET/CT) plays a significant role in the diagnosis and assessment of malignant lymphoma. We previously reported that baseline total metabolic tumor volume (TMTV) on baseline 18FDG-PET/CT was positively correlated with the serum level of soluble interleukin-2 receptor (sIL-2R), and TMTV and sIL-2R were useful prognostic biomarkers in newly diagnosed DLBCL.4 High metabolic heterogeneity (MH) on 18FDG-PET/CT is the index of heterogeneity of intratumoral 18F-fluorodeoxyglucose uptake distribution, and it is associated with worse prognosis for various tumors.5 Recently, high MH on the baseline 18FDG-PET/CT image has been shown to predict worse prognosis of primary mediastinal B-cell lymphoma.6 However, its prognostic value in DLBCL remains to be determined. In the current study, we evaluated the prognostic values of baseline MH in 150 newly diagnosed DLBCL patients.
Patients and methods
Patients
We retrospectively analyzed the prognostic values of MH on baseline 18FDG-PET/CT in 2 independent cohorts; this was the same population that we used in a previous study to explore the prognostic values of TMTV and sIL-2R.4 In brief, the training cohort consisted of 86 newly diagnosed DLBCL patients treated at Sapporo Hokuyu Hospital between 2008 and 2013. The validation cohort included 64 patients treated at Aiiku Hospital between 2008 and 2014. DLBCL was diagnosed histologically, according to the 4th edition of the World Health Organization’s classification. Clinical stage was determined according to the Ann Arbor staging system, and treatment response was evaluated according to the Lugano classification.7 National Comprehensive Cancer Network–International Prognostic Index (NCCN-IPI) scores were calculated as previously described.8 The study procedures were in accordance with the Declaration of Helsinki and institutional ethical guidelines; studies were conducted under the auspices of the institutional ethics committee and were approved by the Institutional Review Board of each institute.
Image acquisition and reconstruction
18FDG-PET/CT images were acquired before initiation of chemotherapy using scanner 1 (Gemini GXL; Philips Healthcare, Tokyo, Japan) in the training cohort and scanner 2 (GE Discovery ST Elite; GE Healthcare, Tokyo, Japan) in the validation cohort. All patients fasted for ≥6 hours before the injection of fluorodeoxyglucose (∼4 MBq/kg). Plasma glucose levels < 200 mg/dL were accepted for imaging studies, according to European Association of Nuclear Medicine guidelines for clinical studies.9 Two-minute emission scanning was initiated at 70 ± 10 minutes postinjection. The transaxial and axial fields of view were 70 cm and 8 cm, respectively, for scanner 1 and 60 cm and 10 cm, respectively, for scanner 2. Three-minute emission scanning in 3-dimensional mode was performed for each bed position. Attenuation was corrected with radiograph computed tomography images acquired without contrast media. Images were reconstructed using an iterative method. Each reconstructed image had a matrix size of 144 × 144, with a voxel size of 4.0 × 4.0 × 4.0 mm, for scanner 1, and a matrix size of 128 × 128, with a voxel size of 4.7 × 4.7 × 3.3 mm, for scanner 2.
Image analyses
Standardized uptake value (SUV) was calculated as (tissue radioactivity concentration [Bq/mL]) × (body weight [g])/(injected radioactivity [Bq]). TMTV was defined as the volume of lymphoma visualized on PET/CT scans with SUV greater than or equal to an absolute threshold of 4.0, as previously described.10 Tumor boundary delineation on PET/CT was performed using Metavol software (Hokkaido University, Sapporo, Japan; http://www.metavol.org). The algorithm details were described previously.11 Briefly, all of the voxels above the threshold were extracted from the entire image, so that all of the voxels of tumor uptake and nontumor uptake, including physiological uptake in the urinary tract, heart, and brain, as well as inflammatory accumulation, were highlighted. Then, the operator manually selected the tumor lesions. In our previous study, the cutoff value of TMTV was determined to be 150 cm3, because that predicted failure for overall survival (OS) and event-free survival (EFS).4
MH in the lesion with the largest metabolic tumor volume (MTV) was estimated using the area under the curve of cumulative SUV-volume histogram (AUC-CSH), as previously shown.12,13 The largest lesion coincided with the hottest lesion in 126 of 150 (84%) patients. Briefly, all of the voxels within the selected lesion were collected to draw a histogram. Then, the histogram was transformed to CSH, where the x-axis represents the ratio of each SUV/SUVmax (maximum standardized uptake of FDG by malignant lesion), and the y-axis represents the number of voxels that are higher than the corresponding SUV (Figure 1). Thus, AUC-CSH has an inverse relationship to MH. All of the images were retrospectively analyzed by a nuclear medicine physician blinded to the clinical information.
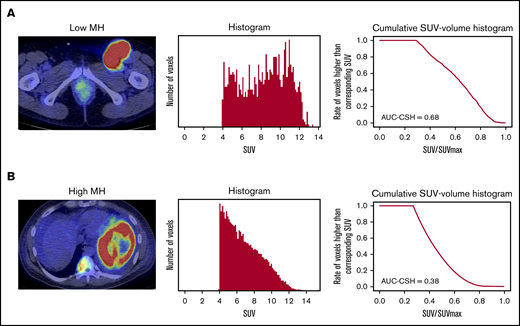
Evaluation of AUC-CSH on18FDG-PET/CT. Axial PET/CT imaging (left panels) and the corresponding histogram drawn by number of the voxels with corresponding SUV (middle panels) and cumulative SUV-volume histogram (right panels) in a patient with low MH (A) and a patient with high MH (B).
Evaluation of AUC-CSH on18FDG-PET/CT. Axial PET/CT imaging (left panels) and the corresponding histogram drawn by number of the voxels with corresponding SUV (middle panels) and cumulative SUV-volume histogram (right panels) in a patient with low MH (A) and a patient with high MH (B).
Statistical analysis
OS was calculated from the day of diagnosis until death or last follow-up. EFS was defined as time from diagnosis to disease progression, relapse after response, death, or last follow-up. The probabilities of OS and EFS were estimated using a Kaplan-Meier method, and differences between the groups were analyzed using the log-rank test. The baseline patient characteristics were tableted to check imbalance in the demographic information. The risk factors at diagnosis for OS or EFS were evaluated by multivariate Cox regression using stepwise variable selection. Fisher’s exact test was used for associations between categorical variables. The correlations between MH and TMTV and between MH and MTV of the corresponding lesion were assessed using Pearson’s product-moment correlation coefficient. All P values were 2-sided, and a P value of .05 was used as the cutoff for statistical significance. All of the statistical analyses were performed using EZR (http://www.jichi.ac.jp/saitama-sct/SaitamaHP.files/statmedEN.html).14
Results
Patient characteristics and treatment outcomes
Patient characteristics are shown in Table 1. Although the training cohort was composed of patients with significantly younger age, better performance status, less advanced clinical stage, and lower NCCN-IPI score compared with the validation cohort, other parameters were comparable between 2 cohorts. Overall response rate (ORR) in the training cohort was comparable to that in the validation cohort: 82% ORR (complete remission [CR], 78%; partial remission [PR], 5%) with a median follow-up of 33.1 months and 77% ORR (CR, 64%; PR, 13%) with a median follow-up of 32.8 months, respectively.
Patient characteristics
| Characteristics | Training cohort (n = 86) | Validation cohort (n = 64) | P |
|---|---|---|---|
| Sex, male/female, n | 44/42 | 31/33 | .512 |
| Age, median (range), y | 71 (24-90) | 74 (33-86) | .019 |
| ECOG performance status | <.01 | ||
| 0 or 1 | 81 (94) | 45 (70) | |
| ≥2 | 5 (6) | 19 (30) | |
| Ann Arbor stage | <.01 | ||
| I or II | 54 (63) | 12 (19) | |
| III | 11 (13) | 13 (20) | |
| IV | 21 (24) | 39 (61) | |
| Extranodal sites | .281 | ||
| 0 | 60 (70) | 22 (34) | |
| ≥1 | 26 (30) | 42 (66) | |
| Bone marrow involvement | .541 | ||
| Yes | 10 (12) | 11 (17) | |
| No | 76 (88) | 53 (83) | |
| B symptoms | .330 | ||
| Yes | 12 (14) | 29 (58) | |
| No | 74 (86) | 35 (42) | |
| LDH | .285 | ||
| ≤Normal | 45 (52) | 21 (33) | |
| >Normal | 41 (48) | 43 (67) | |
| TMTV, cm3 | .411 | ||
| Median (range) | 167.23 (4.61-5445.50) | 236.32 (76.62-677.09) | |
| ≥150 | 44 (51) | 26 (41) | |
| ≥150 | 42 (49) | 38 (59) | |
| MH (AUC-CSH) | 1.000 | ||
| Median (range) | 0.48 (0.24-0.93) | 0.49 (0.33-0.75) | |
| Low (>0.48) | 43 (50) | 32 (50) | |
| High (≤0.48) | 43 (50) | 32 (50) | |
| NCCN-IPI | .014 | ||
| Low or low-intermediate | 47 (55) | 15 (24) | |
| High-intermediate | 33 (38) | 20 (31) | |
| High | 6 (7) | 29 (45) | |
| Treatment | <.01 | ||
| R-CHOP | 81 (94) | 27(42) | |
| R-THP-COP | 5 (6) | 36 (56) | |
| R-CVP | 0 (0) | 1 (2) | |
| Response | |||
| CR | 67 (78) | 41 (64) | .069 |
| PR | 4 (5) | 8 (13) | .126 |
| SD | 11 (12) | 9 (14) | .814 |
| PD | 4 (5) | 6 (9) | .326 |
| Follow-up, mo | |||
| Median (range) | 33.1 (3.6-97.3) | 32.8 (1.4-111.5) |
Unless otherwise noted, data are n (%).
ECOG, Eastern Cooperative Oncology Group; LDH, lactate dehydrogenase; PD, progressive disease; R-CHOP, rituximab, cyclophosphamide, doxorubicin, vincristine, and prednisolone; R-CVP, rituximab, cyclophosphamide, vincristine, and prednisolone; R-THP-COP, rituximab, therarubicin, cyclophosphamide, vincristine, and prednisolone; SD, stable disease.
High MH at diagnosis predicts worse prognosis
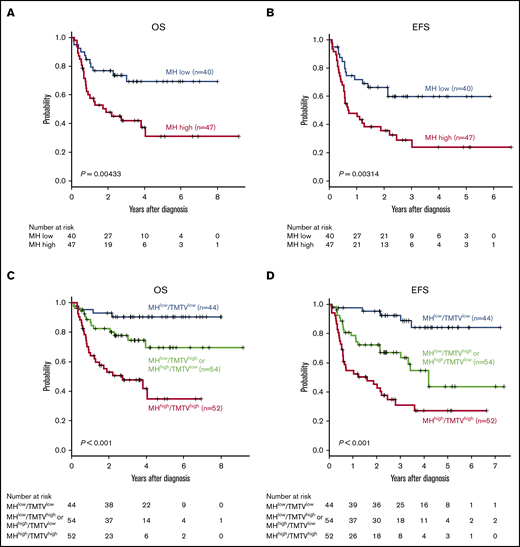
MH in the largest lesion was estimated using AUC-CSH on baseline 18FDG-PET/CT. MH was not significantly different in the training and validation cohorts, with a median AUC-CSH of 0.48 and 0.49, respectively (Table 1). Pearson’s correlation test demonstrated that AUC-CSH was not correlated with MTV of the corresponding lesion (R2 = −0.14; P = .0841; Figure 2A) or TMTV (R2 = −0.137; P = .208; Figure 2B), suggesting that MH is independent of tumor burden. Receiver operating characteristic analyses in the training cohort demonstrated that AUC-CSH of 0.48 and 0.49 were the best cutoff values for 5-year EFS and OS, respectively; because these 2 values were very close, 0.48 was used as the cutoff value between MHhigh and MHlow. We found that OS and EFS at 5 years were significantly lower in the high-MH group than in the low-MH group (OS, 89.5% vs 61.2%; P = .0122 and EFS, 73.1% vs 51.1%; P = .0327; Figure 3A-B).
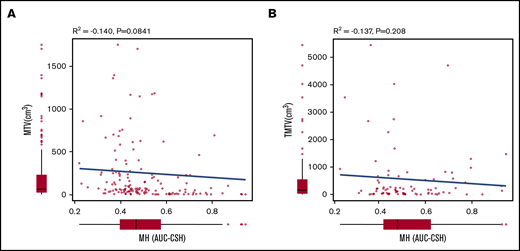
MH is not correlated with MTV of the corresponding lesion or TMTV. Pearson product-moment correlation between AUC-CSH and MTV of the corresponding lesion (A) and AUC-CSH and TMTV (B).
MH is not correlated with MTV of the corresponding lesion or TMTV. Pearson product-moment correlation between AUC-CSH and MTV of the corresponding lesion (A) and AUC-CSH and TMTV (B).

MH on baseline18FDG-PET-CT predicts worse prognosis of newly diagnosed DLBCL. Kaplan-Meier plots of OS (A,C) and EFS (B,D) for the training cohort (A-B) and the validation cohort (C-D).
MH on baseline18FDG-PET-CT predicts worse prognosis of newly diagnosed DLBCL. Kaplan-Meier plots of OS (A,C) and EFS (B,D) for the training cohort (A-B) and the validation cohort (C-D).
We analyzed various prognostic factors for OS and EFS (Table 2). In univariate analysis, high MH was associated with poor 5-year OS and EFS. Therefore, we performed multivariate analysis including parameters that were statistically significant upon univariate analysis in the training or validation cohort and found that only MH remained an independent prognostic factor (Table 3).
Univariate analysis of the risk factors associated with 5-year OS and EFS
| Characteristics | Training cohort | Validation cohort | ||||||
|---|---|---|---|---|---|---|---|---|
| OS, % | P | EFS, % | P | OS, % | P | EFS, % | P | |
| Sex | .55 | .08 | .8 | .81 | ||||
| Male | 51.4 | 31.8 | 51.7 | 44.8 | ||||
| Female | 56.7 | 38.1 | 57.1 | 48.6 | ||||
| Age, y | .07 | .64 | .53 | .10 | ||||
| <70 | 33.8 | 21.4 | 31.6 | 31.6 | ||||
| ≥70 | 32.0 | 22.3 | 22.2 | 44.4 | ||||
| ECOG performance status | 1.00 | .32 | .12 | .11 | ||||
| 0 or 1 | 34.7 | 12.0 | 31.1 | 36.6 | ||||
| 2 | 29.1 | 10.0 | 10.5 | 21.1 | ||||
| Ann Arbor stage | .50 | .81 | .07 | .07 | ||||
| I or II | 53.0 | 33.3 | 50.0 | 25.0 | ||||
| III or IV | 45.6 | 21.9 | 42.3 | 46.2 | ||||
| Extranodal sites, n | .76 | .11 | .48 | .11 | ||||
| 0 | 21.7 | 19.2 | 40.9 | 32.0 | ||||
| 1 | 19.2 | 8.3 | 16.7 | 12.9 | ||||
| Bone marrow involvement | .63 | .50 | .52 | .21 | ||||
| Yes | 40.0 | 20.0 | 50.0 | 38.2 | ||||
| No | 33.2 | 10.5 | 60.0 | 56.7 | ||||
| B symptoms | .67 | 1.00 | <.01 | <.01 | ||||
| Yes | 36.7 | 16.7 | 31.0 | 27.6 | ||||
| No | 33.5 | 10.8 | 74.3 | 62.9 | ||||
| LDH | .76 | .08 | .03 | <.01 | ||||
| Normal | 15.6 | 13.3 | 42.7 | 40.9 | ||||
| >Normal | 12.2 | 9.8 | 16.3 | 17.2 | ||||
| MH | <.01 | <.01 | .01 | .02 | ||||
| Low | 34.9 | 20.0 | 46.9 | 31.3 | ||||
| High | 9.3 | 7.0 | 18.8 | 15.6 | ||||
Multivariate analysis of the risk factors associated with 5-y OS
| Characteristics | Training cohort | Validation cohort | ||||
|---|---|---|---|---|---|---|
| Relative risk | 95% CI | P | Relative risk | 95% CI | P | |
| ECOG performance status 2 | 1.48 | 0.67-18.2 | .14 | 1.44 | 0.72-2.89 | .30 |
| LDH > normal | 2.10 | 0.67-6.59 | .20 | 1.71 | 0.79-3.68 | .17 |
| MHhigh | 4.75 | 1.25-18.1 | .02 | 4.92 | 1.09-17.03 | .04 |
Validation of prognostic values for MH in the validation cohort
Subsequently, the prognostic impacts of MH were validated in the independent validation cohort. The best AUC-CSH cutoff value for 5-year EFS and OS in this cohort was 0.49. Because this value was very close to the value used in the training cohort, we used a common cutoff value of 0.48 to distinguish MH high and MHlow in the training and validation cohorts. We confirmed that 5-year OS and EFS in patients with high MH were significantly lower than in patients with low MH (OS, 68.6% vs 37.1%; P = .0254 and EFS, 57.3% vs 32.6%; P = .0375; Figure 3C-D). We also confirmed that MH was an independent poor prognostic factor for 5-year OS and EFS in univariate and multivariate analyses (Tables 2 and 3). Altogether, we validated that MH is a promising prognostic biomarker in newly diagnosed DLBCL.
Characteristics of MHhigh DLBCL
Next, we used all 150 patients in the training and validation cohorts to further explore the prognostic values of MH in DLBCL. There were significantly more male patients and patients with elevated LDH in the MHhigh group than in the lower MH group (Table 4). There was no significant difference between the MHhigh and MHlow groups in terms of age, performance status, clinical stage, NCCN-IPI risk status, or response to initial chemotherapy. In terms of TMTV, there was no significant difference between the MHhigh or MHlow groups, consistent with the fact that there was no correlation between TMTV and MH.
Comparison of patient characteristics in the MHhigh and MHlow groups
| Characteristics | MHhigh (n = 75) | MHlow (n = 75) | P |
|---|---|---|---|
| Sex, male/female, n | 46/31 | 29/44 | .022 |
| Age, median (range), y | 72 (25-90) | 75 (24-90) | .276 |
| ECOG performance status | |||
| 0 or 1 | 61 (81) | 65 (87) | .505 |
| ≥2 | 14 (19) | 10 (13) | |
| Ann Arbor stage | .688 | ||
| I or II | 35 (47) | 31 (41) | |
| III | 10 (13) | 14 (19) | |
| IV | 30 (40) | 30 (40) | |
| Extranodal sites | .870 | ||
| 0 | 42 (56) | 40 (53) | |
| ≥1 | 33 (44) | 35 (47) | |
| Bone marrow involvement | 1.000 | ||
| Yes | 10 (13) | 11 (15) | |
| No | 65 (87) | 64 (85) | |
| B symptoms | .142 | ||
| Yes | 25 (33) | 16 (21) | |
| No | 50 (67) | 59 (79) | |
| LDH | <.01 | ||
| ≤Normal | 24 (32) | 42 (56) | |
| >Normal | 51 (68) | 33 (44) | |
| TMTV, cm3 | .234 | ||
| Median (range) | 278.02 (4.82-5445.50) | 186.78 (4.61-4024.78) | |
| <150 | 23 (31) | 44 (59) | |
| ≥150 | 52 (69) | 31 (41) | |
| NCCN-IPI | .254 | ||
| Low or low-intermediate | 28 (37) | 35 (47) | |
| High-intermediate | 31 (41) | 21 (28) | |
| High | 16 (21) | 31 (41) | |
| Treatment | .586 | ||
| R-CHOP | 56 (75) | 52 (69) | |
| R-THP-COP | 19 (25) | 22 (30) | |
| R-CVP | 0 (0) | 1 (1) | |
| Response | |||
| CR | 58 (77) | 50 (67) | .203 |
| PR | 6 (8) | 6 (8) | 1.000 |
| SD | 9 (12) | 11 (15) | .811 |
| PD | 6 (8) | 4 (5) | .745 |
Unless otherwise noted, data are n (%).
Analyses using NCCN-IPI score and TMTV
Subgroup analyses of patients with NCCN-IPI high or high-intermediate risk (n = 87) demonstrated that high MH stratified treatment outcomes in this poor prognostic group (5-year OS, 69.3% vs 31.1%, P = .00433; 5-year EFS, 59.7% vs 24.1%, P = .00314) (Figure 4A-B). In 65 patients with NCCN-IPI low or low-intermediate risk, MH did not have an effect on 5-year OS (93.2% vs 88.6%, P = .283) as a result of the minimal mortality in this subgroup, and there was a trend toward worse 5-year EFS (77.6% vs 51.6%, P = .0838) in MHhigh patients. We have previously reported that baseline TMTV was a prognostic biomarker of DLBCL in this cohort.4 To compare the prognostic impact of MH and TMTV, we performed a multivariate analysis including TMTV, MH, and items of NCCN-IPI and found that only TMTV remained an independent risk factor for 5-year EFS (hazard ratio [HR], 2.49; 95% confidence interval [CI], 1.57-3.94; P < .001) and 5-year OS (HR, 2.75; 95% CI, 1.72-4.38; P < .001), likely as a result of the very strong effect of TMTV on prognosis.
MH in combination with NCCN-IPI or TMTV stratifies the risk of newly diagnosed DLBCL. Kaplan-Meier plots of OS (A) and EFS (B) in patients with NCCN-IPI high or high-intermediate. Kaplan-Meier plots of OS (C) and EFS (D) in 3 groups based on MH plus TMTV: low MH and low TMTV (n = 44), high MH or high TMTV (n = 54), and high MH and high TMTV (n = 52).
MH in combination with NCCN-IPI or TMTV stratifies the risk of newly diagnosed DLBCL. Kaplan-Meier plots of OS (A) and EFS (B) in patients with NCCN-IPI high or high-intermediate. Kaplan-Meier plots of OS (C) and EFS (D) in 3 groups based on MH plus TMTV: low MH and low TMTV (n = 44), high MH or high TMTV (n = 54), and high MH and high TMTV (n = 52).
Finally, based on the combination of baseline MH and TMTV, we could stratify 150 patients into 3 groups with significantly different outcomes: MHlow and TMTVlow (n = 44), MHhigh or TMTVhigh (n = 54), and MHhigh and TMTVhigh (n = 52) (5-year OS, 90.4% vs 69.5% vs 34.8%, respectively; P = .00000244 and 5-year EFS, 84.1% vs 43.6% vs 27.0%, respectively; P = .0000000776; Figure 4C-D). We confirmed that TMTVhigh/MHhigh was an independent risk factor for 5-year EFS (HR, 2.53; 95% CI, 1.40-3.59; P = .0021) and 5-year OS (HR, 3.11; 95% CI, 1.40-4.16; P < .001) in a multivariate analysis with items of NCCN-IPI.
To prevent overfitting effects by combining 2 cohorts, we confirmed that high MH was associated with worse prognosis in the NCCN-IPI high- or high-intermediate-risk subgroup, and a model integrating MH and TMTV successfully stratified patients into 3 risk groups in the training and validation cohorts (supplemental Figure 1).
Discussion
Malignant cells have distinct metabolic profiles from normal cells. These tumor-related metabolic profiles can be idiosyncratic phenotypes that are specific for certain subtypes of tumors or more convergent phenotypes that are commonly observed in various malignancies.5 Enhancement of glycolysis is a cardinal metabolic alteration of tumor cells that was described by Otto Warburg in the 1920s, and excess glucose uptake is detected with 18FDG-PET/CT.15 Single-cell metabolic analyses showed that the degree of glycolysis enhancement varies, even within a single lesion.16 The heterogeneity of glucose uptake in the tumor can be visualized by 18FDG-PET/CT, and emerging evidence indicates that high MH evaluated with 18FDG-PET/CT predicts a worse prognosis for multiple malignancies, such as colorectal cancer, oropharyngeal squamous cell carcinoma, pancreatic adenocarcinoma, and non–small cell lung cancer.17-20 A recent study reported that high MH is a strong prognostic factor in patients with newly diagnosed primary mediastinal B-cell lymphoma6 ; that was the first report identifying MH as a prognostic biomarker of malignant lymphoma. In the current study, we further expanded that MH is a prognostic biomarker in DLBCL.
The tumor metabolic profile could vary at the single-cell level, possibly based on the genetic background of each tumor cell, whereas MH on 18FDG-PET/CT does not necessarily represent heterogeneity of cell-intrinsic metabolic profiles. Extrinsic factors, such as altered oxygen and substrate delivery based on the quantity and quality of tumor vasculature, and mechanisms of adaptation to altered microenvironment used by tumor cells could contribute to high MH and affect their sensitivity to therapeutic agents and, possibly, affect treatment outcomes21 . For example, hypoxic status and cell cycling of tumor cells could enhance glycolysis and glucose uptake, resulting in suppression of tumor-infiltrating T lymphocytes due to competition for glucose.22 Alternatively, metabolic activities of stromal and immune cells in the tumor microenvironment could affect MH.23-26
Our findings are consistent with a recent report showing that high MH in the lesion with the greatest uptake (the hottest lesion) was a risk factor for DLBCL.27 We found that the largest lesion represented the hottest lesion in the majority of our patients (84%), and high MH in the largest tumor lesion predicted a worse prognosis in our cohort. Although MH in the largest lesion and MH in the hottest lesion seem to be useful prognostic biomarkers of DLBCL, it remains to be clarified whether these 2 MHs could have different impacts on the prognosis of DLBCL. Another methodological difference between our study and the previous study is the method used for tumor boundary delineation. Although the previous study detected the lesion with SUV greater than or equal to an absolute threshold of SUV 2.5 (TMTV 2.5), we used the threshold of SUV 4.0 (TMTV 4). TMTV 41%, the fixed threshold method for tumor detection besed on 41% of the SUVmax, is the most widely used method for tumor boundary delineation. However, we found that our cohorts included some patients with extremely high SUVmax (eg, >30); in such cases, we discovered that the high threshold (>12.3) caused underestimation of tumor volume when using TMTV 41%. On the other hand, we found that using TMTV 2.5 included physiological uptake and/or neighboring lesions more frequently compared with the use of TMTV 4; hence, more manual interaction was required to modify the tumor boundary, possibly leading to the repeatability error. Thus, we chose to use TMTV 4 in the current study; however, the contouring method needs to be optimized in future studies.
Various prognostic factors of DLBCL have been advocated so far, and all of them reflect some aspect of the quantity and/or the quality of the tumor: LDH,8 clinical stage,8 cell of origin,28,29 CD5 positivity,30 status of Epstein-Barr virus,31 and double-hit lymphoma.32 18FDG-PET/CT estimates tumor volume and outputs it numerically as TMTV. We and other investigators previously reported that baseline TMTV is a prognostic biomarker of DLBCL.4 Although MH did not persist as a significant risk factor after multivariate analyses including TMTV, because of the strong impact of TMTV on prognosis, we found that the combination of MH and TMTV stratifies patients into 3 risk groups. The previous report27 also mentioned that TMTV is a more significant risk factor compared with MH, whereas a model integrating MH and TMTV is useful; MH status could stratify patients with high TMTV into 2 risk groups. It has been proposed that evaluation of the quantity and the quality of tumors is important for predicting the prognosis of DLBCL patients,33,34 suggesting that integrated analyses of TMTV (quantity) and MH (quality) on the baseline 18FDG-PET-CT are useful for such purposes.
Evaluation of the quality of the tumor in malignant lymphoma by 18FDG-PET/CT is still under development. Although genetic profiling could define distinct subgroups of DLBCL that predict clinical outcomes, gene sequencing is not yet practical for identification of genetic heterogeneity in DLBCL.33 It is possible the high MH represents a certain genetic background of DLBCL. Comprehensive studies of these factors at diagnosis are required to clarify the relationship between genetic background and MH of DLBCL. Our study has some limitations, including its retrospective nature, small sample size, and lack of information about Ki67 positivity and double-hit or double-expressor status. Additionally, the differences in the scanners and the imaging methods used between the training and the validation cohorts might affect our results, because cross-calibration of scanners was not performed. For this reason, we performed receiver operating characteristic analysis in each cohort separately to determine the cutoff value of MH, which led to almost consistent MH cutoff values in the training and validation cohorts. Further studies are warranted to clarify the versatility of this cutoff value. At a minimum, it was demonstrated that MH at diagnosis is a poor prognostic factor in DLBCL in different cohorts independently; this is a notable result that should lead to future investigations.
In summary, we found that MH based on baseline 18FDG-PET/CT is a prognostic factor in patients with newly diagnosed DLBCL. MH in combination with TMTV provides a novel approach to the risk stratification of newly diagnosed DLBCL.
Requests for data sharing should be e-mailed to the corresponding author.
Acknowledgment
The authors thank the nursing and medical staffs who looked after the patients.
Authorship
Contribution: H.S. designed the study, recruited and treated patients, analyzed data, and wrote the manuscript; K.H. analyzed voxel data sets; K. Izumiyama, K.M., E.T., K. Itoh, M.K., A.M., and S.O. recruited and treated patients; D.H. designed and supervised the study and wrote the manuscript; and T.T. supervised the study and wrote the manuscript.
Conflict-of-interest disclosure: The authors declare no competing financial interests. A complete list of the members of the North Japan Hematology Study Group appears in “Appendix.”
Correspondence: Hajime Senjo, Department of Hematology, Faculty of Medicine, Hokkaido University, North 15 West 7, Kita-ku, Sapporo 060-8638, Japan; e-mail: hajimesenjo@gmail.com.
Appendix: study group members
The members of the North Japan Hematology Study Group are: Masanobu Morioka, T.T., Toshimichi Ishihara, Hiroshi Iwasaki, Tomoyuki Endo, S.O., Yasutaka Kakinoki, Mitsutoshi Kurosawa, Hajime Kobayashi, Takeshi Kondo, Hajime Sakai, Junji Tanaka, Yutaka Tsutsumi, Satoshi Hashino, D.H., Yoshihito Haseyama, Takuto Miyagishima, A.M., Satoshi Yamamoto, Naoki Takezako, Masanori Tanaka, Makoto Saito, K. Izumiyama, Naoki Kobayashi, Masahiro Ogasawra. K.M., Akio Shigematsu, Shojiro Takahashi, Kaoru Kahata, Masao Nakagawa, Masahiro Onozawa, Junichi Sugita, Hideki Goto, Soichi Shiratori, Emi Yokoyama, Takahide Ara, Hiroyuki Ohigashi, Shuichiro Takahashi, and Masahiro Imamura.

