Key Points
KDM5A inhibition led to APL NB4 cell differentiation and retarded growth, and greatly sensitized NB4 cells to ATRA treatment.
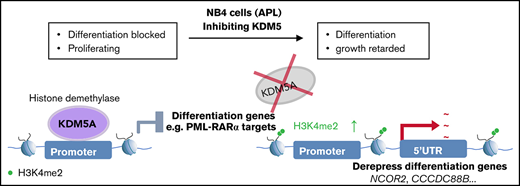
KDM5A suppressed PML-RARα target genes primarily by repressing H3K4me2 at the promoter and 5′ end intragenic regions.

Abstract
Epigenetic abnormalities are frequently involved in the initiation and progression of cancers, including acute myeloid leukemia (AML). A subtype of AML, acute promyelocytic leukemia (APL), is mainly driven by a specific oncogenic fusion event of promyelocytic leukemia–RA receptor fusion oncoprotein (PML-RARα). PML-RARα was reported as a transcription repressor through the interaction with nuclear receptor corepressor and histone deacetylase complexes leading to the mis-suppression of its target genes and differentiation blockage. Although previous studies were mainly focused on the connection of histone acetylation, it is still largely unknown whether alternative epigenetics mechanisms are involved in APL progression. KDM5A is a demethylase of histone H3 lysine 4 di- and tri-methylations (H3K4me2/3) and a transcription corepressor. Here, we found that the loss of KDM5A led to APL NB4 cell differentiation and retarded growth. Mechanistically, through epigenomics and transcriptomics analyses, KDM5A binding was detected in 1889 genes, with the majority of the binding events at promoter regions. KDM5A suppressed the expression of 621 genes, including 42 PML-RARα target genes, primarily by controlling the H3K4me2 in the promoters and 5′ end intragenic regions. In addition, a recently reported pan-KDM5 inhibitor, CPI-455, on its own could phenocopy the differentiation effects as KDM5A loss in NB4 cells. CPI-455 treatment or KDM5A knockout could greatly sensitize NB4 cells to all-trans retinoic acid–induced differentiation. Our findings indicate that KDM5A contributed to the differentiation blockage in the APL cell line NB4, and inhibition of KDM5A could greatly potentiate NB4 differentiation.
Introduction
Acute myeloid leukemia (AML) is the most common type of acute leukemia in adults and the second most common leukemia in children. Uncontrolled proliferation of clonal neoplastic hematopoietic precursor cells leads to the disruption of normal hematopoiesis and bone marrow failure. Acute promyelocytic leukemia (APL) is an AML subtype mainly caused by promyelocytic leukemia (PML)-RA receptor fusion oncoprotein (PML-RARα). PML-RARα acts as an altered transcription factor and interacts with nuclear receptor corepressor and histone deacetylase (HDAC) corepressor complexes.1-4 Previous studies reported that PML-RARα suppressed target gene expression in APL cells and caused differentiation blockage at the promyelocytic stage.5 The current standard treatment of all-trans retinoic acid (ATRA) has greatly improved the clinical outcomes of patients with APL. The chemotherapy of ATRA combined with arsenic trioxide is an especially feasible treatment in low- and high-risk patients with APL, with a higher cure rate and less relapse.6-11 ATRA or ATRA–arsenic trioxide chemotherapy functions mainly through inducing degradation of PML-RARα and differentiation,12 but the detailed mechanisms of the differentiation blockage and how PML-RARα target genes are repressed remain to be elucidated.
Epigenetic alterations are considered to play important roles in the initiation and progression of leukemia, and targeting epigenetic factors renders potential strategies in treating APL. For instance, due to the connection to HDACs mentioned earlier, HDAC inhibitors were soon tested for their efficacy in treating APL.13,14 More recently, lysine-specific demethylase 1 (LSD1) inhibitors were also studied for their potential in curing APL.15,16 Although these agents could all potentiate the ATRA sensitivities in APL, they exhibited none or a very limited stand-alone effect as single agents.13-16
The KDM5 family proteins are demethylases of H3K4me3 and H3K4me2,17-19 two active histone marks for transcription activation. Together with LSD1, KDM5 family proteins shape the epigenomes of H3K4me1, H3K4me2, and H3K4me3. The KDM5A protein was first reported to be a binding protein of the tumor suppressor gene pRB and regulated cellular differentiation in various biological systems.20 Wenchu Lin and Jian Cao et al also found that KDM5A/RBP2 deletion could reduce the proliferation and enhance the differentiation of Men1-defective pancreatic cancer.21 Interactions of KDM5A with NuRD and Notch-RBP-J repressor complexes were also reported,22,23 indicating a transcriptional suppression function of KDM5A. Importantly, it was reported that drug-resistant lung cancer cells contained elevated KDM5A, and inhibition of KDM5A could sensitize the resistant lung cancer cells to gefitinib.24,25 In breast cancer, KDM5A was reportedly involved in disease progression and metastasis, and importantly, inhibitor treatment could increase breast cancer cell sensitivities to antiestrogen treatment and cyclin-dependent kinase inhibitors.26-28 Recently, loss of KDM5A in HL60 was shown to induce apoptosis and sub-G1 arrest.29 Altogether, these lines of evidence prompted us to explore the possibility of KMD5A as a drug target in APL.
Here, we found that knocking out KDM5A (KDM5A KO) in NB4, an APL cell line, significantly inhibited cell proliferation and colony formation abilities, and led to robust myeloid differentiation. Mechanistically, we revealed that loss of KDM5A resulted in elevated H3K4me2 levels in the promoters and 5′ intragenic regions of 4140 target genes and upregulated the expression of 621 genes, including 42 PML-RARα target genes. Administration of a reported KDM5 inhibitor, CPI-455,25 could phenocopy differentiation effects as KDM5A KO. Inhibition of KDM5A also greatly potentiated the ATRA effect by at least 10-fold.
Methods
Cell culture
The human APL cell line NB4 (kindly provided by Kankan Wang, Ruijin Hospital) was cultured in RPMI 1640 supplemented with 10% fetal bovine serum (Biological Industries), penicillin (50 U/mL), and streptomycin (50 µg/mL) at 37°C in a 5% carbon dioxide humidified atmosphere.
Reagents
The reagents used were CPI-455 (MedChemExpress, HY-100421), retinoic acid (ATRA; MedChemExpress, HY-14649), nitroblue tetrazolium chloride (NBT; Solarbio, N8140), phorbol 12-myristate 13-acetate (MultiSciences, 70-CS0001), and Wright-Giemsa Stain kit (Baso, B4017).
CRISPR-Cas9 system
CRISPR-Cas9 gene knockout was performed by using the lentiCRISPR V2 system30 and acted as protocol recommended. Single guide RNAs (sgRNAs) were designed as follows: KDM5A-sgRNA1, TATCGGCCGCATCCGGCCTT; KDM5A-sgRNA2, GGCCTTTGGCGGAGAAAAC; KDM5B-sgRNA, TCTTGTGGATGAAAGCGAA; Control-sgRNA1, AGCTGGACGGCGACGTAAA; and Control-sgRNA2, GTGAACCGCATCGAGCTGA.
The lentiCRISPR v2 plasmid was a gift from Feng Zhang (Addgene plasmid #52961; http://n2t.net/addgene:52961; RRID: Addgene_52961).
Proliferation assay
NB4 cells treated with knockout sgRNAs were seeded at 10 000 cells/mL. Cell counts were conducted on days 1, 2, 3, and 4 after seeding. Statistical significance was determined by using two-way analysis of variance.
Colony formation assays
Cultured NB4 cells were plated 500 cells per well in a 24-well plate in methylcellulose (MethoCult H4434, Stem Cell Technologies) and incubated at 37°C. Colony formation was measured 10 days after plating.
Flow cytometric analysis
Cells were harvested, washed twice with phosphate-buffered saline, and incubated for 30 minutes with a phycoerythrin-conjugated human CD11b antibody (BD Pharmingen, #555388) or allophycocyanin-conjugated human CD11b antibody (Invitrogen, 17-0118-42), and fluorescein isothiocyanate–conjugated human CD11c antibody (Invitrogen, 11-0116-42). Fluorescence-activated cell sorting was performed on a BD LSRII FACS machine (Becton Dickinson).
NBT test
Cells (30 000) were added to 100 μL of 0.25 mg/mL NBT solution containing 0.1 μg/mL phorbol 12-myristate in RPMI 1640 supplemented with 10% fetal bovine serum (Biological Industries) in a 96-well plate. They were then incubated at 37°C for 30 minutes. Samples were examined under a microscope (Nikon, 40×).
Morphologic analysis
The Wright-Giemsa stain was performed by using a kit (Baso, BA4017) following the manufacturer’s protocol. Basically, cytospin-prepared 25 000 cells were incubated with 300 μL Solution A for 30 seconds, and then diluted with 600 μL Solution B and incubated for 10 minutes. After washes with water, samples were examined under a microscope (Nikon, 40×).
Chromatin immunoprecipitation and next-generation sequencing
Chromatin immunoprecipitation (ChIP) was performed as previously descripted.31 For histone modifications, 3 × 10⁶ cells per IP and 2 μg of primary antibodies were used; for KMD5A ChIP, 4 × 10⁶ cells per IP and 3 μg of antibody were used. The obtained DNA was then quantified by PicoGreen and processed for ChIP-sequencing (ChIP-seq) library preparation by using a VAHTS Universal DNA Library Prep Kit for MGI (Vazyme, NDM607-02) with a VAHTS Universal Adapter Ligation Module for Illumina (Vazyme, N204-01) or used for quantitative polymerase chain reaction (qPCR). For library preparation, 2 ng of immunoprecipitated DNA was used. Antibodies used for ChIP were as follows: H3K4me1 (Abcam, no. 8895), H3K4me2 (Abcam, no. 32356), H3K4me3 (Active Motif, no. 39159), KDM5A (Bethyl Laboratories, A300-897A), and anti–immunoglobulin G rabbit (Jackson ImmunoResearch Laboratories, lot no. 134230). ChIP-seq peaks were called by MACS2.32 Differential peaks were identified by DiffBind.33 ChIP-seq heatmaps and density plots were drawn by ngsplot.34 The ChIP-seq data reported in this article have been deposited in the Gene Expression Omnibus database (accession number GSE152397). The H3K4me1 ChIP-seq tracks in NB4 were generated from previously published data35 (Gene Expression Omnibus accession number GSE30254).
RNA extraction, qPCR, and RNA-sequencing
A minimum of 2 × 10⁶ cells from treated and control samples were used for RNA extraction. Total RNAs were purified from all samples using TRIzol (Invitrogen) according to the manufacturer’s protocol. The RNA was converted to complementary DNA by using Maxime RT premix (iNtron) with random primers. Gene expression was analyzed with real-time PCR using SYBR Green Master Mix (Ampliqon). RNA preparation was performed from 3 separate preparations of treated and control cells. Relative gene expression (fold change) was calculated with REST software.
Messenger RNA–sequencing libraries were prepared according to the TruSeq low sample protocol (Illumina). RNA-sequencing was performed by Illumina HiSeq 2500 (Illumina). The FASTQ data were mapped to human genome hg19 by using STAR (020201)36 and assembled by using HOMER to determine integer counts and counts per million (CPM). The differential expression was calculated by DESeq237 using CPM. The RNA-sequencing data reported in this article have been deposited in the GEO database (accession number GSE152397).
Statistical analysis
The growth curve, column graphs, pie graphs, box plots, and the volcano plot were analyzed and drawn by using GraphPad Prism Software. Data are presented as an average of at least 3 independent experiments. For all experiments with error bars, the standard deviation was calculated and presented as mean ± standard deviation. P values < .05 were considered statistically significant (*P < .05; **P < .01; ***P < .001; ****P < .0001). Comparisons between 2 groups were analyzed by using the Student t test, and multiple comparisons were analyzed by using two-way analysis of variance.
Results
KDM5A KO in NB4 cells prohibited proliferation and induced cell differentiation
Previous studies reported that the inhibition of LSD1/KDM1A could reactivate the ATRA-induced differentiation pathway in AML through reshaping of the H3K4me2 landscape and resulted in favorable outcomes such as differentiation and on-target cytotoxicity.15,38 Histone H3K4 methylations occur in 3 states (H3K4me1, H3K4me2, and H3K4me3), which can be regulated by both KDM1 and KDM5 family demethylases.39 We therefore hypothesized that inhibiting KDM5 family member(s) might result in beneficial effects, such as promoting cell differentiation, through a similar or related mechanism.
To test this idea, we knocked out KDM5A by CRISPR-Cas9 in the APL cell line NB4 carrying the PML-RARα fusion event. Growth analysis of the control and knockout cells was performed by cell counting for 4 consecutive days. We found that the proliferation of NB4 was significantly suppressed upon KDM5A loss (Figure 1A). Moreover, because the ability of colony formation is a hallmark of malignant transformation, a methylcellulose assay was used to examine whether KDM5A loss could affect the colony formation ability of NB4. After 14 days of culture, we found that KDM5A KO NB4 cells formed fewer colonies (Figure 1B-C). These data showed that KDM5A was required for the proliferation and colony formation of NB4 cells. We also knocked out KDM5B, a paralogue of KDM5A, in NB4 cells, but the proliferation was not affected (supplemental Figure 1D-E), and we therefore focused on KDM5A in the rest of the study.
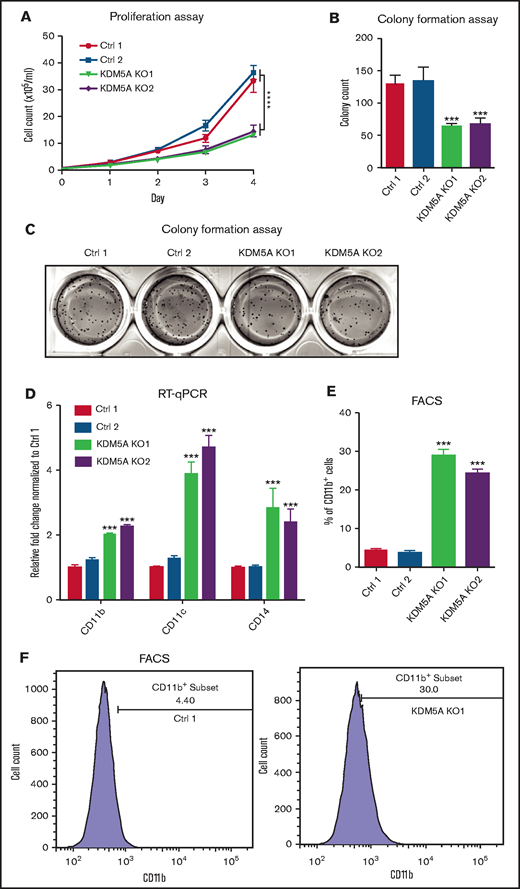
KDM5A KO in APL cell line NB4 prohibited proliferation, colony formation, and induced differentiation. (A) Proliferation assay of NB4 cells transduced with 2 control sgRNAs (Ctrl) and 2 KDM5A sgRNAs (KDM5A KO). Cell counts were measured at the indicated days after seeding. Data are shown as means ± standard error of the mean of triplicate analysis. The counts of KDM5A-KO cell lines at day 4 were compared with those in control cell lines. Statistical significance was determined by two-way analysis of variance. ****P < .0001. The P values of both KDM5A-KO groups were < .0001. (B-C) Bar graph and photos showing colony formation of the indicated NB4 cell lines using a 14-day methylcellulose assay. Colony counts were compared between 2 control cell lines and 2 KDM5A-KO cell lines, and statistical significance was determined by two-way analysis of variance. ***P < .001. (D) RT-qPCR analysis of differentiation markers CD11b, CD11c, and CD14 in the indicated cell lines. (E-F) Differentiation marker CD11b level in NB4 cells transduced with control sgRNAs and KDM5A sgRNAs measured by using flow cytometry. The statistical significance of RT-qPCR and percentage of CD11b+ cells was determined by two-way analysis of variance. ***P < .001. FACS, fluorescence-activated cell sorting.
KDM5A KO in APL cell line NB4 prohibited proliferation, colony formation, and induced differentiation. (A) Proliferation assay of NB4 cells transduced with 2 control sgRNAs (Ctrl) and 2 KDM5A sgRNAs (KDM5A KO). Cell counts were measured at the indicated days after seeding. Data are shown as means ± standard error of the mean of triplicate analysis. The counts of KDM5A-KO cell lines at day 4 were compared with those in control cell lines. Statistical significance was determined by two-way analysis of variance. ****P < .0001. The P values of both KDM5A-KO groups were < .0001. (B-C) Bar graph and photos showing colony formation of the indicated NB4 cell lines using a 14-day methylcellulose assay. Colony counts were compared between 2 control cell lines and 2 KDM5A-KO cell lines, and statistical significance was determined by two-way analysis of variance. ***P < .001. (D) RT-qPCR analysis of differentiation markers CD11b, CD11c, and CD14 in the indicated cell lines. (E-F) Differentiation marker CD11b level in NB4 cells transduced with control sgRNAs and KDM5A sgRNAs measured by using flow cytometry. The statistical significance of RT-qPCR and percentage of CD11b+ cells was determined by two-way analysis of variance. ***P < .001. FACS, fluorescence-activated cell sorting.
Because numerous studies have shown that the malignant transformation of APL cells is frequently coupled with differentiation blockage, we next wondered whether KDM5A loss could promote myeloid differentiation. Expression of 3 differentiation hallmark genes (CD11b, CD11c, and CD14) was detected. They were all found to be significantly elevated in the KDM5A KO NB4 cells (Figure 1D). Flow cytometry analysis also revealed an approximately sixfold increase in CD11b+ cell populations upon KDM5A loss (Figure 1E-F), indicating a gain of differentiation potential. Altogether, these data indicate that KDM5A was required for the cancerous growth and suppressed NB4 differentiation.
KDM5A primarily bound gene promoters and opposed H3K4me2 at the promoters and surrounding regions
To further investigate the underlining mechanism, we profiled the genome-wide distribution pattern of KDM5A in NB4 cells, and H3K4me2 and H3K4me3 in both control and KDM5A KO NB4 cells by ChIP-seq. First, a total of 1947 high-confidential KDM5A peaks were identified in 1930 genes. The top 10 enriched pathways of KDM5A binding genes are shown in supplemental Table 1C. Among these peaks, 1276 are located at promoter regions (transcription start site ± 2 kb) (Figure 2A). Because KDM5A is a histone H3K4me2/3 demethylase, we then queried whether KDM5A KO could lead to the resetting of the chromatin environment (ie, H3K4me2 and H3K4me3 levels) of the target genes. We ranked KDM5A binding events over 1930 genes based on the intensities of ChIP-seq signals (Figure 2B). Surprisingly, in 1930 genes with KDM5A occupancy, no obvious changes in H3K4me3 were observed. Instead, a significantly elevated H3K4me2 level was noted around the KDM5A binding sites. Such alteration of H3K4me2 was also confirmed by density plot analysis (Figure 2C), and H3K4me3 only exhibited a very mild decrease.
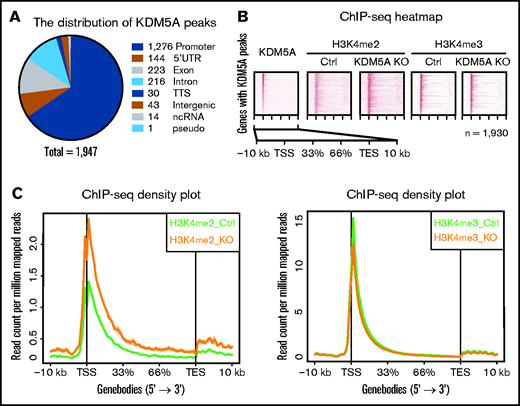
KDM5A KO led to the elevation of H3K4me2 of KDM5A target genes. (A) Pie chart showing the genomic distribution of KDM5A ChIP-seq peaks, annotated by using HOMER. The numbers represent the peak number in each category. (B) Heatmap analysis of the ChIP-seq profiles of KDM5A in NB4 and H3K4me2 and H3K4me3 in the control (Ctrl) and KDM5A-KO NB4 cells at KDM5A bound genes. Gene bodies ± 10 kb are shown, sorted by the intensity of KDM5A binding at promoter regions. (C) ChIP-seq signal density plots showing the global levels of H3K4me3 and H3K4me2 at KDM5A bound genes ± 10 kb. TES, transcription end site; TSS, transcription start site.
KDM5A KO led to the elevation of H3K4me2 of KDM5A target genes. (A) Pie chart showing the genomic distribution of KDM5A ChIP-seq peaks, annotated by using HOMER. The numbers represent the peak number in each category. (B) Heatmap analysis of the ChIP-seq profiles of KDM5A in NB4 and H3K4me2 and H3K4me3 in the control (Ctrl) and KDM5A-KO NB4 cells at KDM5A bound genes. Gene bodies ± 10 kb are shown, sorted by the intensity of KDM5A binding at promoter regions. (C) ChIP-seq signal density plots showing the global levels of H3K4me3 and H3K4me2 at KDM5A bound genes ± 10 kb. TES, transcription end site; TSS, transcription start site.
We then analyzed the genome-wide changes of H3K4me2 and H3K4me3 in the KDM5A KO NB4 cells and identified a total of 4989 significant upregulated H3K4me2 peaks, covering 4140 genes and 2819 promoters. We noticed that the increase of H3K4me2 was not only limited to promoters but also extended into 5' intragenic regions (Figure 3A-B). Again, no significant changes in global H3K4me3 were noted, other than a mild decrease (Figure 3B). No significant differential H3K4me3 peaks were identified by using DiffBind.
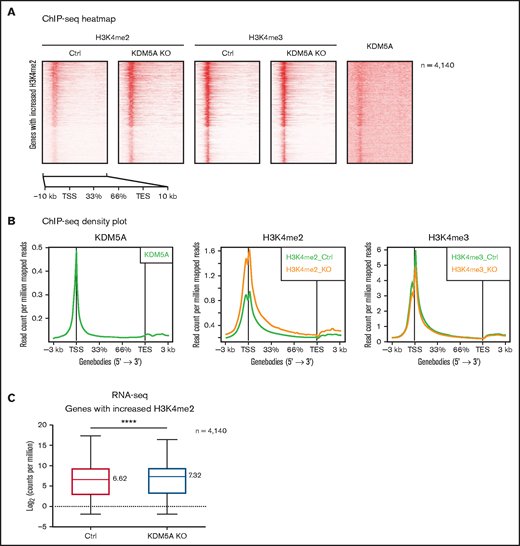
KDM5A KO led to the increase of H3K4me2 at promoters and 5' intragenic regions correlated with upregulation of gene expression. (A) Heatmap analysis of the ChIP-seq profiles of KDM5A in NB4 and H3K4me2 and H3K4me3 in the control (Ctrl) and KDM5A-KO NB4 cells. Gene bodies with upregulated H3K4me2 (in KDM5A-KO NB4 cells) ± 3 kb are shown, sorted according to H3K4me2 binding intensity in control NB4. (B) ChIP-seq signal density plots showing the global levels of H3K4me3 and H3K4me2 at all genes ± 3 kb. (C) Box plot showing the expression levels of genes with increased H3K4me2 in KDM5A-KO, in the control and KDM5A-KO NB4 cells. Gene expression levels are presented as log2CPM. Statistical significance was determined by using Student’s t test. ****P < .0001.
KDM5A KO led to the increase of H3K4me2 at promoters and 5' intragenic regions correlated with upregulation of gene expression. (A) Heatmap analysis of the ChIP-seq profiles of KDM5A in NB4 and H3K4me2 and H3K4me3 in the control (Ctrl) and KDM5A-KO NB4 cells. Gene bodies with upregulated H3K4me2 (in KDM5A-KO NB4 cells) ± 3 kb are shown, sorted according to H3K4me2 binding intensity in control NB4. (B) ChIP-seq signal density plots showing the global levels of H3K4me3 and H3K4me2 at all genes ± 3 kb. (C) Box plot showing the expression levels of genes with increased H3K4me2 in KDM5A-KO, in the control and KDM5A-KO NB4 cells. Gene expression levels are presented as log2CPM. Statistical significance was determined by using Student’s t test. ****P < .0001.
Increase of H3K4me2 at promoters and 5′ intragenic regions correlated with upregulation of gene expression in the KDM5A KO NB4 cells
Although H3K4me2 has been considered as an active histone mark for transcription, such increases in promoter and 5′ intragenic H3K4me2 have not been previously reported. Intriguingly, regions with elevated H3K4me2 were enriched for the binding motifs of transcription factors promoting hematopoietic differentiation, such as ETS1, PU.1, SpiB, and C/EBP (supplemental Table 1B). It indicated that increased H3K4me2 might promote the recruitment of these transcription factors, possibly by creating a more permissive chromatin environment, and result in transcription upregulation. We therefore examined the transcriptional outcome of the upregulated H3K4me2 covered 4140 genes by RNA-sequencing and found a global increase in their expression level (median log2CPM from 6.62 to 7.32) (Figure 3C).
Upregulation of PML-RARα target genes upon loss of KDM5A was associated with increased H3K4me2
We analyzed the differentially expressed genes between the control and KDM5A KO cells, and found 621 upregulated and 62 downregulated genes in KDM5A KO cells (fold change >2; P < .05) (Figure 4A), supporting a transcription repressive role of KDM5A. We next evaluated the gene pathways of the differentially expressed genes by using Kyoto Encyclopedia of Genes and Genomes (KEGG) and Gene Set Enrichment Analysis (GSEA). Through the analyses, the differentially expressed genes were found to be enriched for genes that related to the acute myeloid leukemia pathway (false discovery rate [FDR] = 0.0056) and B-cell receptor signaling pathway (FDR = 0.015). Marker gene analysis also suggested that KMD5A was involved in the MYC regulatory pathway (FDR = 0.000) and the phosphatidylinositol 3-kinase–protein kinase B (PI3K-AKT) signaling pathway (FDR = 0.005) in NB4 cells (supplemental Figure 2A).

KDM5A KO led to the activation of PML-RARα target genes. (A) Volcano graph showing the gene expression changes upon KDM5A loss in NB4. (B) Box plot showing the expression of PML-RARα target genes in the control and KDM5A-KO NB4 cells. Gene expression levels are presented as log2CPM. The median log2CPM of control and KDM5A-KO NB4 cells were labeled. Statistical significance was determined by using Student’s t test. ****P < .0001 . (C) RT-qPCR examination of the expression of the select PML-RARα target genes. Statistical significance was determined by using Student’s t test. *P < .05, ***P < .001, ****P < .0001. (D) H3K4me2 ChIP-qPCR validation of the select PML-RARα target genes. The statistical significance was determined by using Student’s t test. **P < .01, ***P < .001, ****P < .0001. (E) Density plots of the indicated ChIP-seq signals over PML-RARα target genes ± 3 kb. (F) Heatmap showing the KDM5A binding in NB4 cells, and H3K4me2 and H3K4me3 levels in the control (Ctrl) and KDM5A-KO NB4 cells, over KDM5A bound PML-RARα target genes ± 3 kb, sorted according to KDM5A binding intensity. (G) ChIP-seq snapshots of 2 select PML-RARα target genes for KDM5A, H3K4me1, and input in NB4; H3K4me2, H3K4me3, and RNA-sequencing in the control and KDM5A-KO NB4 cells. TES, transcription end site; TSS, transcription start site.
KDM5A KO led to the activation of PML-RARα target genes. (A) Volcano graph showing the gene expression changes upon KDM5A loss in NB4. (B) Box plot showing the expression of PML-RARα target genes in the control and KDM5A-KO NB4 cells. Gene expression levels are presented as log2CPM. The median log2CPM of control and KDM5A-KO NB4 cells were labeled. Statistical significance was determined by using Student’s t test. ****P < .0001 . (C) RT-qPCR examination of the expression of the select PML-RARα target genes. Statistical significance was determined by using Student’s t test. *P < .05, ***P < .001, ****P < .0001. (D) H3K4me2 ChIP-qPCR validation of the select PML-RARα target genes. The statistical significance was determined by using Student’s t test. **P < .01, ***P < .001, ****P < .0001. (E) Density plots of the indicated ChIP-seq signals over PML-RARα target genes ± 3 kb. (F) Heatmap showing the KDM5A binding in NB4 cells, and H3K4me2 and H3K4me3 levels in the control (Ctrl) and KDM5A-KO NB4 cells, over KDM5A bound PML-RARα target genes ± 3 kb, sorted according to KDM5A binding intensity. (G) ChIP-seq snapshots of 2 select PML-RARα target genes for KDM5A, H3K4me1, and input in NB4; H3K4me2, H3K4me3, and RNA-sequencing in the control and KDM5A-KO NB4 cells. TES, transcription end site; TSS, transcription start site.
More importantly, an overall expression increase (1.58-fold) was noted for all 456 PML-RARα target genes40 (median log2CPM from 7.96 to 8.62) (Figure 4B), and 42 of them were within the 621 differentially upregulated genes (by twofold) in the KDM5A KO NB4 cells. We randomly selected 6 of these genes and validated the expression changes by RT-qPCR (Figure 4C) and the H3K4me2 changes by ChIP-qPCR (Figure 4D). These data indicate that KDM5A knockout in NB4 led to the derepression of PML-RARα target genes through fine-tuning the epigenetic mark, H3K4me2, in their promoters and 5' intragenic regions. Supporting this notion, we further found that the regions with increased H3K4me2 upon KDM5A loss were most statistically enriched for the promoters bound by PML-RARα in NB4 and 2 APL primary blasts reported previously40 (Figure 4E) (supplemental Table 1A). Consistently, 50 of these genes also exhibited direct KDM5A occupancy at the promoters (Figure 4F); 2 examples (RAVER1 and ACSF3) are shown in Figure 4G, as snapshots in the track view.
KDM5A inhibitor alone induced the differentiation of NB4
The aforementioned results showed that KDM5A KO led to H3K4me2 elevation and derepression of PML-RARα target genes and robust myeloid differentiation in NB4 cells. However, it was unclear whether the effects were mediated by the catalytic activity of KDM5A and whether the effects could be induced by a small chemical inhibitor. Hence, we took advantage of a previously reported inhibitor of KDM5 family demethylases, CPI-455. It inhibited the catalytic activity of KDM5A by abolishing the cofactor binding.25 After 4 days of dosing with different concentrations in NB4 cells, we observed overt differentiation at the concentration as low as 5 μM, detected by flow cytometry analyses of the differentiation markers (CD11b and CD11c). At a higher concentration of 20 μM, the CD11b+ population could be further increased (Figure 5A). To note, we observed no significant cell death under these concentrations, which suggests that the phenotype was not due to the side effect of general cytotoxicity, unlike what was reported for the HDAC inhibitor.14 More differentiation-related phenotypes were also verified by cell morphology changes, such as kidney-shaped or segmented nuclei, a feature similar to differentiated granulocytes (Figure 5B).
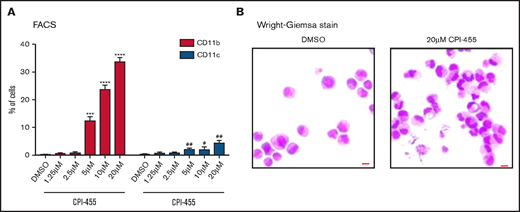
KDM5A inhibition induced NB4 differentiation. (A) Differentiation markers CD11b and CD11c in NB4 cells treated with indicated concentrations of a KDM5 inhibitor, CPI-455, measured by using flow cytometry. Statistical significance was determined by using Student’s t test. ***P < .001, ****P < .0001, P values for percentage of CD11b+ cells. #P < .05, ##P < .01, P values for percentage of CD11c+ cells. (B) The morphology of NB4 cells treated with dimethyl sulfoxide (DMSO) or 20 μM KDM5 inhibitor CPI-455. Bar = 15 μm. FACS, fluorescence-activated cell sorting.
KDM5A inhibition induced NB4 differentiation. (A) Differentiation markers CD11b and CD11c in NB4 cells treated with indicated concentrations of a KDM5 inhibitor, CPI-455, measured by using flow cytometry. Statistical significance was determined by using Student’s t test. ***P < .001, ****P < .0001, P values for percentage of CD11b+ cells. #P < .05, ##P < .01, P values for percentage of CD11c+ cells. (B) The morphology of NB4 cells treated with dimethyl sulfoxide (DMSO) or 20 μM KDM5 inhibitor CPI-455. Bar = 15 μm. FACS, fluorescence-activated cell sorting.
Synergistic effect of KDM5A inhibition and ATRA in inducing NB4 cell differentiation
We next asked whether KDM5A knockout or inhibition by CPI-455 could sensitize NB4 cells to ATRA treatment. The control and KDM5A KO NB4 cells were treated with various concentrations of ATRA, and the proliferation and differentiation potentials were then monitored (Figure 6A). We found that the KDM5A KO NB4 cells grew much slower under the treatment of 0.5 nM ATRA compared with the control NB4 cells under treatment of 0.5 nM or even 10 nM ATRA. We also found that loss of KDM5A greatly potentiated NB4 differentiation to ATRA treatment through several independent assays, including CD11b/c expression, Wright-Giemsa staining, and the NBT test. As shown in Figure 6B to D, much lower doses of ATRA readily induced stronger differentiation phenotypes of the NB4 KDM5A KO cells compared with the control NB4 cells. Finally, we wanted to investigate whether the pharmacologic inhibition of KDM5A using CPI-455 could phenocopy KDM5A loss. Indeed, we found that 0.1 nM ATRA could significantly retard the growth of NB4 cells together with 5 μM CPI-455 at a comparable level as 10 nM ATRA treatment singly (Figure 7A). Consistently, combining treatment with 0.5 nM ATRA, 2.5 μM CPI-455 also greatly potentiated NB4 differentiation (Figure 7B-D). Taken together, our findings showed that KDM5A inhibition could significantly induce NB4 differentiation, either as a stand-alone treatment or with the combination of ATRA.
![KDM5A KO lowered the exposure of ATRA to induce NB4 cell differentiation. (A) Proliferation assay of control (Ctrl) cells or KDM5A-KO cells treated with 0.5 nM ATRA or vehicle (dimethyl sulfoxide [DMSO]) and control cells treated with 10 nM ATRA for the indicated days. Viable cells were detected by using a trypan blue exclusion assay. The counts of the KO1 and KO2 cells with 0.5 nM ATRA were compared with the Ctrl cells with 10 nM ATRA. Statistical significance was determined by two-way analysis of variance. ****P < .0001. (B) CD11b+ or CD11c+ cells were detected by flow cytometry of control cells or KDM5A KO cells treated with indicated concentrations of ATRA for 4 days. ***P < .001, ###P < .001. (C) The morphology of control cells or KDM5A KO cells treated with 0.5 or 10 nM ATRA for 4 days. Bar = 15 μm. (D) The NBT test of control cells or KDM5A KO cells treated with indicated concentrations of ATRA or vehicle (DMSO) for 3 days. Values represent means ± standard deviation of the percentages of NBT-positive cells, n = 6.](https://ash.silverchair-cdn.com/ash/content_public/journal/bloodadvances/5/17/10.1182_bloodadvances.2020002819/3/m_advancesadv2020002819f6.png?Expires=1765352711&Signature=Q-FSXqOYi1-gdRzsWdr-BYK-NJOo0JmiKgiIWOuTcxJdQgeEnq8nY60H6Z~5gbOZHhL7Vxx1cFa6yDZWLH0yYtefJhMGpQ9IrcfveKelTnh-PdPj7JE4tGPaYgnQ23tsqKfo650urspoFmuSItOho6ao~O4PLi8NorGKbV~Z5sAF68EVTRJghayuSogkThtVidvi1Hv1vu82rdgtI1eHt5J83nbIBHKnZ8rbHL0CC1LD93JtnbOC4rzU5HyoWAwAPpPltuRTZdF9IVwGCFYWiTUFG-U2IUg~QpErLZ4Sg-~ZIueJqISgEz0NsF183ALTEqclHKw6u-wsIZBwgzWtjQ__&Key-Pair-Id=APKAIE5G5CRDK6RD3PGA)
KDM5A KO lowered the exposure of ATRA to induce NB4 cell differentiation. (A) Proliferation assay of control (Ctrl) cells or KDM5A-KO cells treated with 0.5 nM ATRA or vehicle (dimethyl sulfoxide [DMSO]) and control cells treated with 10 nM ATRA for the indicated days. Viable cells were detected by using a trypan blue exclusion assay. The counts of the KO1 and KO2 cells with 0.5 nM ATRA were compared with the Ctrl cells with 10 nM ATRA. Statistical significance was determined by two-way analysis of variance. ****P < .0001. (B) CD11b+ or CD11c+ cells were detected by flow cytometry of control cells or KDM5A KO cells treated with indicated concentrations of ATRA for 4 days. ***P < .001, ###P < .001. (C) The morphology of control cells or KDM5A KO cells treated with 0.5 or 10 nM ATRA for 4 days. Bar = 15 μm. (D) The NBT test of control cells or KDM5A KO cells treated with indicated concentrations of ATRA or vehicle (DMSO) for 3 days. Values represent means ± standard deviation of the percentages of NBT-positive cells, n = 6.
KDM5A KO lowered the exposure of ATRA to induce NB4 cell differentiation. (A) Proliferation assay of control (Ctrl) cells or KDM5A-KO cells treated with 0.5 nM ATRA or vehicle (dimethyl sulfoxide [DMSO]) and control cells treated with 10 nM ATRA for the indicated days. Viable cells were detected by using a trypan blue exclusion assay. The counts of the KO1 and KO2 cells with 0.5 nM ATRA were compared with the Ctrl cells with 10 nM ATRA. Statistical significance was determined by two-way analysis of variance. ****P < .0001. (B) CD11b+ or CD11c+ cells were detected by flow cytometry of control cells or KDM5A KO cells treated with indicated concentrations of ATRA for 4 days. ***P < .001, ###P < .001. (C) The morphology of control cells or KDM5A KO cells treated with 0.5 or 10 nM ATRA for 4 days. Bar = 15 μm. (D) The NBT test of control cells or KDM5A KO cells treated with indicated concentrations of ATRA or vehicle (DMSO) for 3 days. Values represent means ± standard deviation of the percentages of NBT-positive cells, n = 6.
![KDM5A inhibition enhanced the differentiation-inducing effect of ATRA at a lower dose. (A)Proliferation assay of NB4 cells treated with 5 μM CPI-455 and/or 0.1 or 0.5 nM ATRA, 10 nM ATRA, or vehicle (dimethyl sulfoxide [DMSO]) for the indicated days. Viable cells were detected by using a trypan blue exclusion assay. Statistical significance was determined by two-way analysis of variance. ****P < .0001, ####P < .0001. (B) CD11b+ or CD11c+ cells were detected by flow cytometry of NB4 cells treated with 2.5 μM CPI-455 and/or 0.5 nM ATRA, or vehicle (DMSO) for 4 days. ***P < .001, *P < .05 (C) The morphology of NB4 cells treated with 2.5 μM CPI-455 and/or 0.5 nM ATRA, or vehicle (DMSO) for 4 days. Bar = 15 μm. (D) The NBT test of NB4 cells treated with 2.5 μM CPI-455 and/or 0.5 nM ATRA, or vehicle (DMSO) for 3 days. The values represent mean ± standard deviation of the percentages of NBT-positive cells, n = 6. FACS, fluorescence-activated cell sorting.](https://ash.silverchair-cdn.com/ash/content_public/journal/bloodadvances/5/17/10.1182_bloodadvances.2020002819/3/m_advancesadv2020002819f7.png?Expires=1765352711&Signature=zoZtA7fd84h4O0dXUHIwxsVIHJkeehArZjrhimg3xWZzhcIO0KS8LGCGxILMmWZndtaap5T4BW1Lmj7Vzt-1up4yx8XESuajAS1H91wSg6GtInpkEWjaA9Hq5kSBVNnK0RUZIZSaq~O0dF8fQN60HHKY7rfTIdRAYGLj-gz--er~kxxTz-NBx5L1bpkHXUmXO7neLzK0JerPlw9g-EUvj1vz5GdBsnUwOYyYnRxMbo-OLT6foqBjI3yQSSvPYJF5HCpCV~9W9j7TrPTI0EL2eCxcgsF9mixD5w~f6Ih6-WKbw~C-tMVOdGTuEzj5tRYtnjz-tLIiXhmSjFezPitq7Q__&Key-Pair-Id=APKAIE5G5CRDK6RD3PGA)
KDM5A inhibition enhanced the differentiation-inducing effect of ATRA at a lower dose. (A)Proliferation assay of NB4 cells treated with 5 μM CPI-455 and/or 0.1 or 0.5 nM ATRA, 10 nM ATRA, or vehicle (dimethyl sulfoxide [DMSO]) for the indicated days. Viable cells were detected by using a trypan blue exclusion assay. Statistical significance was determined by two-way analysis of variance. ****P < .0001, ####P < .0001. (B) CD11b+ or CD11c+ cells were detected by flow cytometry of NB4 cells treated with 2.5 μM CPI-455 and/or 0.5 nM ATRA, or vehicle (DMSO) for 4 days. ***P < .001, *P < .05 (C) The morphology of NB4 cells treated with 2.5 μM CPI-455 and/or 0.5 nM ATRA, or vehicle (DMSO) for 4 days. Bar = 15 μm. (D) The NBT test of NB4 cells treated with 2.5 μM CPI-455 and/or 0.5 nM ATRA, or vehicle (DMSO) for 3 days. The values represent mean ± standard deviation of the percentages of NBT-positive cells, n = 6. FACS, fluorescence-activated cell sorting.
KDM5A inhibition enhanced the differentiation-inducing effect of ATRA at a lower dose. (A)Proliferation assay of NB4 cells treated with 5 μM CPI-455 and/or 0.1 or 0.5 nM ATRA, 10 nM ATRA, or vehicle (dimethyl sulfoxide [DMSO]) for the indicated days. Viable cells were detected by using a trypan blue exclusion assay. Statistical significance was determined by two-way analysis of variance. ****P < .0001, ####P < .0001. (B) CD11b+ or CD11c+ cells were detected by flow cytometry of NB4 cells treated with 2.5 μM CPI-455 and/or 0.5 nM ATRA, or vehicle (DMSO) for 4 days. ***P < .001, *P < .05 (C) The morphology of NB4 cells treated with 2.5 μM CPI-455 and/or 0.5 nM ATRA, or vehicle (DMSO) for 4 days. Bar = 15 μm. (D) The NBT test of NB4 cells treated with 2.5 μM CPI-455 and/or 0.5 nM ATRA, or vehicle (DMSO) for 3 days. The values represent mean ± standard deviation of the percentages of NBT-positive cells, n = 6. FACS, fluorescence-activated cell sorting.
Discussion
Epigenetic therapies present great promise in the treatment of myeloid malignancy, as well as specific solid tumors, but few targets have been identified and evaluated. Our findings showed that KDM5A was required for the suppression of PML-RARα genes, and loss of KDM5A effectively induced growth retardation and differentiation in NB4 cells. Knockout or pharmacologic inhibition of KDM5A led to the upregulated H3K4me2 level and the expression level of PML-RARα target genes and promoted differentiation of the APL cell line NB4.
Although previous attempts at using HDAC and LSD1 inhibitors to treat APL had been conducted, none of them could induce differentiation as a single agent, despite the fact they could sensitize the ATRA effect. For instance, the LSD1 inhibitor ORY-1001 could increase promoter H3K4me2 and upregulate the expression of target genes, and further lead to the differentiation of non-APL cell lines, but APL cell line NB4 was the cell line least sensitive to ORY-1001.16 Here we show that the inhibition of KDM5A alone could induce NB4 differentiation. Further studies are needed to understand whether different mechanisms of differentiation blockage are involved in the APL and non-APL types of AML.
Our findings also revealed an important function of KDM5A in regulating promoter and 5' intragenic H3K4me2 to repress gene expression, including PML-RARα target genes. Consistent with our findings, Sakamoto et al41 reported that compared with ATRA-tolerant AML, ATRA-sensitive AML contained a higher H3K4me2 level at the promoters of PML-RARα target genes, including RARα, C/EBPs, and PU.1. In another study, it was reported that in CD4+ T cells, a higher H3K4me2 level was associated with more chromatin accessibility and permissive environment for target gene expression.42 Here, our data revealed that the KDM5A-regulated H3K4me2 regions are indeed enriched for the binding motifs of hematopoietic differentiation-related transcription factors, such as ETS1, PU.1, SPIB, and C/EBP (supplemental Table 1B). Therefore, these studies, together with ours, highlighted a linkage among KDM5A, H3K4me2, the activity of tissue/cell type–specific transcription factors, and proper hematopoietic differentiation. Our findings may have broader implications and call for future translational studies using KDM5A as a potential therapeutic target in various cancer types.
KDM5A was reported as an H3K4me3 and H3K4me2 demethylase. Surprisingly, in our study, we found that loss of KDM5A did not affect the H3K4me3 pattern at promoter regions in NB4 cells but resulted in an H3K4me2 increase at the promoter and 5' intragenic regions. We speculate that the promoter H3K4me3 may be under a less dynamic regulation by demethylases, as the focal nucleosomes at transcription start site regions might already be fully modified by H3K4me3. However, H3K4me2 is extended to more flanking regions, such as 5' intragenic regions, and is subjected to the more dynamic regulation of KDM5A. Similarly, in our previous study in breast cancer cells, we found that loss of KDM5C also did not cause significant changes in promoter H3K4me3 but led to increased enhancer H3K4me3,43 in which the H3K4me3 levels were considerably lower compared with those of the promoter H3K4me3. Here, our study reveals KDM5A function in regulating H3K4me2 and highlighted an important role of H3K4me2 in activating transcription in NB4 cells. Whether such regulation exists in other biological systems remains to be further investigated. We also noticed that the upregulated H3K4me2 peaks were more than KDM5A ChIP-seq peaks, which could be due to certain technical limitations involved in ChIP-seq assays (eg, limited KDM5A antibody quality to identify all binding events) (supplemental Figure 1C). Another possibility is that KDM5A may regulate distant sites through long-range chromatin interactions.
Of note, another histone demethylase (KDM3B) was also recently reported as a differentiation barrier of NB4. As an H3K9me1/2 demethylase, knocking down KDM3B led to increased H3K9me1 levels and chromatin accessibility and decreased H3K9me2 level at promoters, including the PML-RARα target genes,44 suggesting that multiple mechanisms are involved in the differentiation blockage of NB4. However, no inhibitor of KDM3B has been developed, and thus the effect of pharmacologic inhibition of KDM3B remains unclear.
KDM5B is a paralogue of KDM5A. Although the 2 proteins share strong similarities in the catalytic regions, the C terminal halves are different, and they therefore may interact with unique partners and function differentially. Stankov et al45 found that H3K4me3 was positively correlated with the proliferation of mixed-lineage leukemia (MLL)-associated leukemia, which was regulated by KDM5B. The c-kit+ MLL-associated leukemia stem cells contained a lower level of KDM5B and a higher level of H3K4me3. When leukemia stem cells undergo differentiation, KDM5B expression needs to be increased to maintain a globally lower H3K4me3 level for differentiation.45,46 These findings indicated distinct roles of KDM5A and KDM5B in leukemogenesis. Of note, not only KDM5A but CPI-455 could also inhibit KDM5B and other KDM5 members such as KDM5C.25 Thus, the differentiation effect of CPI-455 should be considered as a compromised outcome of inhibition of all KDM5 proteins, and our findings call for the future development of KDM5A-specific inhibitors.
Acknowledgments
The authors thank Zhigang Lu for the suggestions on the revised manuscript.
This project was supported by the National Key Research and Development program of China (2016YFA0101800 [F.L.] and 2018YFA0108700), the National Natural Science Foundation of China (31925010, 91953121, 81773014 [F.L.]), and Shanghai Municipal Science and Technology Major Project (2017SHZDZX01).
Authorship
Contribution: S. Xu, Z.S., S.W., and S. Xing performed most of the experiments while S.W. conducted the bioinformatics analysis; D.Y., B.R., and Y.Z. assisted with cellular assays; Y.T., X.S., K.X., K.W., H.G., and M.S. provided the NB4 cell line and technical support; F.L. conceived the project and cowrote the manuscript with S.W. and S. Xu; and F.L. and S.W. revised the manuscript.
Conflict-of-interest disclosure: The authors declare no competing financial interests.
Correspondence: Fei Lan, Fudan University, 131 Dong’An Rd, 515, Shanghai 200032, China; e-mail: fei_lan@fudan.edu.cn; or Zhennan Shi, Fudan University, 131 Dong’An Rd, 509, Shanghai 200032, China; e-mail: sznsci@gmail.com.