

Abstract
The present study was designed to test the concept that platelets release a humoral factor that plays a regulatory role in megakaryopoiesis. The results showed that, among various hematoregulatory cytokines examined, transforming growth factor-β1 (TGF-β1) was by far the most potent enhancer of mRNA expression of bone marrow stromal thrombopoietin (TPO), a commitment of lineage specificity. The TPO, in turn, induced TGF-β receptors I and II on megakaryoblasts at the midmegakaryopoietic stage; at this stage, TGF-β1 was able to arrest the maturation of megakaryocyte colony-forming units (CFU-Meg). This effect was relatively specific when compared with its effect on burst-forming unit-erythroid (BFU-E) or colony-forming unit–granulocyte-macrophage (CFU-GM). In patients with idiopathic thrombocytopenic purpura (ITP), the levels of both TGF-β1 and stromal TPO mRNA were correlatively increased and an arrest of megakaryocyte maturation was observed. These in vivo findings are in accord with the aforementioned in vitro results. Thus, the results of the present investigation suggest that TGF-β1 is one of the pathophysiological feedback regulators of megakaryopoiesis.
THROMBOPOIETIN (TPO), one of the most potent stimulators of platelet production, had been shown to be produced by various organs such as the liver, kidney, spleen, and lung.1-5 Because the mode of TPO production by these organs is constitutive, serum levels of TPO had been proposed to be regulated by adsorption of TPO on the surface of platelets (sponge theory).6 However, we have recently found that bone marrow (BM) stromal cells nonconstitutively produced it, relative to the platelet counts, ie, higher levels of TPO mRNA were found in patients with idiopathic thrombocytopenic purpura (ITP) than in normal subjects, and these high levels were normalized upon treatment.7Therefore, it was speculated that there must be some sensor(s) on stromal cells to detect the platelet counts in the circulation, although the mechanism was unknown.
Alternatively, regulation of platelet formation by growth suppressors acting directly on megakaryopoiesis has also been proposed. Among these, transforming growth factor-β1 (TGF-β1) has attracted particular interest as a candidate for a mediator of feedback signal from the end product of megakaryopoiesis (platelets), because it is highly concentrated in platelets.8 Several investigators have indeed demonstrated a dose-dependent suppression of megakaryocyte colony-forming units (CFU-Meg) by TGF-β1.9,10 However, the fact that a similar growth inhibition by TGF-β1 has reportedly been observed with progenitors of erythroid, myeloid, and primitive hematopoiesis, although the inhibition was relatively intense on CFU-Meg, raised a question as to the specificity of TGF-β1 action on megakaryopoiesis. Contrarily, some in vivo experiments using murine models are suggestive of selectivity of TGF-β1 on megakaryopoiesis. Systemic administration of TGF-β1 was shown to evoke thrombocytopenia but not suppress the neutrophil and lymphocyte counts.11 In TGF-β1 gene knockout mice, an excess of megakaryopoiesis with increased platelet count in circulation was reported.12 13Taking these facts into account, we postulated that, in vivo, TGF-β1, in addition to its direct inhibitory action on CFU-Meg, specifically regulates the production of TPO by stromal cells and thereby indirectly defines its specificity on megakaryocyte lineage.
In the present investigation, therefore, we examined the effect of TGF-β1 on expression of TPO in stromal cells obtained from normal volunteers as well as its effect on CFU-Meg induced by TPO. We also elucidated the concentrations of BM TGF-β1, levels of stromal TPO mRNA, and profiles of BM megakaryopoiesis in normal subjects and patients with ITP.
The results obtained clearly indicated that TGF-β1 is indeed a feedback regulator of megakaryopoiesis in humans.
MATERIALS AND METHODS
Patients and normal subjects.
Six patients with ITP admitted to our hospital from 1996 to 1997 were examined after informed consent was obtained. Five of the patients underwent steroid therapy. Normal subjects were volunteer doctors in our department and were also fully informed of the experimental protocol.
Cytokines.
Recombinant human granulocyte colony-stimulating factor (G-CSF), TPO, erythropoietin (EPO), interleukin-3 (IL-3), and IL-6 were kindly provided by Kirin Brewery Co, Ltd (Maebashi, Japan). Recombinant human TGF-β1 (rhTGF-β1) in active form and recombinant human tumor necrosis factor-α (TNF-α) were purchased from Genzyme Corp (Boston, MA).
Treatment of BM stromal cells with TGF-β1, TNF, IL-3, IL-6, TPO, G-CSF, or EPO.
BM stromal cells were prepared according to the previously published Dexter’s method.14-16 One milliliter of BM blood was taken from the iliac bone crest of patients with ITP and normal subjects using a heparinized syringe as described elsewhere. To examine the modulation of TPO mRNA expression by various hematoregulatory cytokines, BM stromal cells (1 × 10⁶ cells) obtained from a normal subject (Y.H.) were incubated with various cytokines in RPMI 1640 medium containing 10% fetal calf serum (FCS) and 10% horse serum (HS) at 37°C in humidified 5% CO2 for 24 hours and then collected in RPMI 1640. The concentration range for each cytokine (TGF-β1, 0.1 to 2.0 ng/mL; TNF-α, 50 to 500 U/mL; IL-3, 5 to 50 ng/mL; IL-6, 5 to 50 ng/mL; TPO, 10 to 100 ng/mL; EPO, 0.2 to 2 U/mL; and G-CSF, 10 to 100 ng/mL) was determined to cover their upper limit of pathophysiological concentrations in biological fluid.17,18 In certain pathological conditions, circulating TGF-β1 often reach concentrations as high as 1.0 ng/mL. TNF-α at 500 U/mL has been previously used to stimulate growth factors mRNA expressions such as granulocyte-macrophage colony-stimulating factor (GM-CSF), IL-6, and IL-1β in normal human BM stromal cells.19 In some pathological conditions, the concentration of IL-3 or IL-6 in biological fluid may reach as high as 50 ng/mL. TPO at 100 ng/mL, 100 ng/mL of G-CSF, and 2 U/mL of EPO have been routinely used for stimulation of CFU-Meg,20,21colony-forming unit–granulocyte-macrophage (CFU-GM),22 and burst-forming unit-erythroid (BFU-E).23
Assay of hematopoietic progenitors (CFU-Meg, CFU-GM, and BFU-E).
CD34+ cells from normal subjects were collected from a suspension of BM mononuclear cells using immunomagnetic beads according to the method of Debili et al.24 The recovery rate (65.6% ± 3.8%) and purity (93.1% ± 2.9%) of CD34+ cells were sufficiently high for fluorescence-activated cell sorting (FACS). CD34+ cells (1 × 10³) were cultured in a 35-mm diameter plate (Corning, Corning, NY) in the presence of rhTGF-β1 (0.1 or 1.0 ng/mL) and TPO (1.0, 10.0, or 100 ng/mL), G-CSF (100 ng/mL), or EPO (2 U/mL) in 20% FCS containing 0.8% methylcellulose following the previous reported method.24The plates were then incubated at 37°C in an atmosphere of 5% CO2 in air in a humidified incubator. After 14 days, the cultures were examined microscopically and the number of colonies formed in the presence of each TPO, G-CSF, or EPO were scored as CFU-Meg (>4 cells), CFU-GM (>50 cells), or BFU-E (>50 cells), respectively. To determine at which stage of megakaryopoiesis TGF-β1 acts, CD34+ cells from normal subject (Y.H.) were incubated with 1.0 ng/mL rhTGF-β1 in the presence of TPO (100 ng/mL) for 14 days and the number of CFU-Meg colonies were scored at days 0, 2, 4, 6, 8, 10, 12, and 14, respectively. CD34+ cells that were preincubated with 1.0 ng/mL of rhTGF-β1 for 24 hours were also cultured with 100 ng/mL of TPO and CFU-Meg colony numbers were scored at day 14.
Preparation of standard mRNAs of TPO, G-CSF, and GAPDH for TaqMan polymerase chain reaction (PCR).
To quantitate an absolute amount of TPO and G-CSF mRNA in stromal cells by TaqMan PCR, standard curves for both cytokine mRNA were prepared.25 Briefly, total mRNA was prepared from stromal cells of Y.H. using RNA Sol B (Tel-Test, Inc, Friendswood, TX) according to the acid guanidium isothiocyanate extraction method.3,26 The first cDNA strand was synthesized using total mRNA (1 μg) at 42°C for 30 minutes in buffer containing 100 ng of oligo (dT), 500 mmol/L dNTPs, 10 mmol/L dithiothreitol (DTT), 200 U of SuperScript II RNase H-reverse transcriptase (Life Technologies, Inc, Gaithersburg, MD), and 1× reverse transcriptase buffer with a 20 μL reaction volume. The mixture was then denatured at 94°C for 3 minutes and cooled on ice. For amplification of the open reading frame, the following primers were used for TPO, G-CSF, and GAPDH mRNA, respectively: 5′ (102-126 nt), 3′ (1138-1163 nt); 5′ (32-53 nt), 3′ (636-655 nt); and 5′ (112-132 nt), 3′ (708-744 nt), respectively.1 27 These oligomers (1 μg) were phosphorylated at 5′-end by incubation with 10 U of T4 polynucleotide kinase (Takara Shuzo, Kyoto, Japan) at 37°C for 1 hour. PCR amplification was performed with 35 cycles of 94°C for 30 seconds and 68°C for 3 minutes by using Advantage-GC cDNA PCR kit (Clontech Laboratories, Inc, Palo Alto, CA). The PCR products were electrophoresed on a 1% agarose gel and a fragment of 1,062 bp (TPO) or 624 bp (G-CSF) in size was extracted by Geneclean kit (BIO 101, Inc, Vista, CA). TPO or G-CSF cDNA was subcloned into the EcoRV site of pPCR-Script Amp SK(+) cloning vector (Stratagene, La Jolla, CA). To prepare the linear template DNA, the cloning vector containing TPO or G-CSF cDNA was digested with HindIII. Sense RNA of TPO or G-CSF was synthesized using T3 RNA polymerase. The linearized vector (0.5 μg) was incubated at 37°C for 1 hour with 10 U of T3 RNA polymerase (Takara Shuzo), 10 U of placental ribonuclease inhibitor (Takara Shuzo), 500 mmol/L NTPs, and 10 mmol/L DTT. After incubation, 10 U of RNase-free DNase I was added and incubated at 37°C for 30 minutes to digest out the template DNA. The transcribed RNA was purified by extraction with phenol/chloroform and concentrated by ethanol precipitation. The pellet was rinsed with 75% ethanol, dried, and dissolved in diethyl pyrocarbonate (DEPC)-water. The concentration of RNA was calculated by absorbance at 260 nm. Serially diluted RNAs with DEPC-water containing 100 μg/mL of yeast tRNA as a carrier were subjected to TaqMan reverse transcriptase-PCR (RT-PCR) followed by the method as described below. The TPO and G-CSF mRNA were amplified linearly in a range of 4 log dilutions of input molecules.
TaqMan real time quantitative RT-PCR assay for mRNAs of TPO, G-CSF, and GAPDH.
According to our previous report,7 TaqMan RT-PCR assay was conducted. In brief, oligonucleotides for TaqMan RT-PCR assay were labeled with FAM (6-carboxyfluorescein), JOE (6-carboxy-4,5-dichloro-2,7-dimethoxyfluorescein), or TAMRA (6-carboxytetramethylrodamine). RNA from stromal cells incubated with or without cytokines as described above was applied for reverse transcription and amplification using TaqMan EZ RT-PCR kit (Perkin Elmer, Foster City, CA) according to the manufacturer’s protocol. A master mixture that contained all reagents required for RT-PCR was prepared to give a final concentration of 1× TaqMan EZ buffer, 0.3 mmol/L dNTPs, 3 mmol/L manganese acetate, 0.01 U/mL AmpErase UNG, and 0.1 U/mL rTth DNA polymerase. Total RNA extracts (containing unknown amounts of target TPO, G-CSF, and GAPDH mRNA from BM stromal cells) were added to the master mixture. This mixture was used to generate two sets of tubes, set I and set II. To detect the amount of the TPO, G-CSF, and GAPDH mRNA RT-PCR amplicon, a target hybridization probe and primers were added to set I and an internal control hybridization probe and primers were added to set II to give final probe concentrations of 100 and 200 nmol/L primers. Each mixture was transferred to a set of thermocycler tubes. The increase in fluorescence (Δ Rn) was proportional to the concentration of template in the PCR. Threshold Δ Rn is calculated by multiplying the standard deviation of 3 Rn-values (no template controls) by 6.965 according to the manufacturer’s protocol for TaqMan RT-PCR Kit. The PCR cycle number at the threshold line represents cycle of threshold (CT).
RT-PCR for TGF-β receptor I and II mRNA.
BM CD34+ cells of normal subjects were cultured in α-minimum essential medium (α-MEM) containing TPO (100 ng/mL) and 20% plasma. The cells were harvested on days 0, 2, 4, 7, and 14 and mRNA was extracted on each day. An aliquot of 1.0 μg RNA from each sample was reverse transcribed according to the above-mentioned method. Using an oligonucleotide primer of TGF-β receptor I (5′, 1342-1360 nt; 3′, 1672-1690 nt)28 and II (5′, 1722-1740 nt; 3′, 2009-2027 nt),29 40 cycles of PCR were conducted. The amplified products were electrophoresed on 5% polyacrylamide gels and stained with ethidium bromide.
Preparation of platelet lysate.
Platelet pellets were obtained by centrifugation at 800g for 30 minutes from 100 mL of platelet-rich plasma from a healthy volunteer, followed by 5 cycles of freezing and thawing of the pellet in phosphate-buffered saline. Acidification of lysate (0.5 mL) was performed by incubation with 1 mL of 0.23 mol/L HCl.30After 12 hours, the concentrations of latent and active TGF-β1 were measured and stored at −20°C until use.
Assay for TGF-β.
The concentrations of TGF-β1 (both active and latent forms) in BM and peripheral blood (PB) plasma of patients with ITP and normal subjects and those of platelet lysates prepared as described below were measured using an enzyme-linked immunosorbent assay (ELISA) kit (Promega Co, Madison, WI).31 Briefly, 1 mL of BM and PB samples were diluted with normal saline (3-fold) containing 100 U/mL of heparin; BM and PB samples (containing 100 U/mL heparin) were then placed on ice and centrifuged within 1 hour after collection at 2°C to 8°C for 30 minutes at 1,000g. The supernatants were collected as platelet-poor plasma for the following assay. The total (active + latent) TGF-β1 was assayed after acid activation of the plasma or platelet lysate by adding 1 μL of 1 N HCl to 50 μL diluted plasma (1:5 in Dulbecco’s phosphate-buffered saline [DPBS]). The reaction solution was mixed and incubated at room temperature for 15 minutes before it was neutralized by 1 μL of 1 N of NaOH. It was further diluted to 1:150 in DPBS buffer (containing K−, Na+, Cl−, HPO4−, Ca2+, and Ma2+, pH 7.35) before ELISAs. To measure the amount of active TGF-β1, the acidification procedure was omitted. Concentration of latent TGF-β1 was calculated as a concentration of total TGF-β1 minus active TGF-β1. The color change of the final reaction was measured at a wavelength of 450 nm for the optimal density, and the standard curve (TGF-β1 concentrationv absorbances) was also a linear in a linear-linear scale.
Assay for TPO.
Concentrations of TPO in conditioned media from BM stromal cells stimulated with TGF-β1 or platelet lysates were measured using an ELISA kit (R&D Systems, Rochester, MN) following the instructions of the provided manufacturer’s manual as previously described.7
Measurement of megakaryocyte numbers.
BM aspirates of patients with ITP or normal subjects were obtained from iliac bone crest during diagnostic procedures. After BM aspirates were 20-fold diluted with Turk medium, and the megakaryocyte number was counted with Fuchs-Rosenthal calculation glass (Kayagaki, Tokyo, Japan). Although counting megakaryocytes from aspirate may not be as accurate as counting from biopsy samples, the latter technique was not used in this particular investigation because it was difficult to obtain informed consent for biopsy from normal volunteers. The morphology of megakaryocytes was studied on May-Grunwald-Giemsa–stained smears by light microscopy. Immature megakaryocytes with a low cytoplasm-to-nucleus ratio, nongranular cytoplasm, and a nucleus that appears uniformly stippled were identified following the method reported by Odell and Jacson.32
Statistical analysis.
Means and standard errors were assessed using the Mann-Whitney U-tests. A P value of less than .05 was accepted as statistically significant.
RESULTS
Suppression of CFU-Meg by TGF-β1 at midmegakaryopoiesis.
The effects of TGF-β1 on CFU-Meg from 3 normal subjects were examined in the presence of TPO. As shown in Fig 1, CFU-Meg was suppressed by TGF-β1 in a dose-dependent manner. TGF-β1 also suppressed CFU-GM and BFU-E, but to a lesser extent. For example, at 0.1 ng/mL of TGF-β1, CFU-Meg were suppressed 5 times more than CFU-GM and twice more than BFU-E. Therefore, suppression by TGF-β1 was considered to be relatively specific for CFU-Meg as compared with CFU-GM or BFU-E.

Dose-dependent suppression of CFU-Meg, CFU-GM, and BFU-E colony formation by TGF-β1. CD34+ cells for colony assays were obtained from 3 different normal volunteers (cases no. 1, 2, and 3). CFU-Meg colony assay from 1 × 10³ of CD34+ cells was performed with TPO at a concentration of 100 ng/mL (○), 10 ng/mL (•), or 1.0 ng/mL (▪) in the presence of 0.1 and 1.0 ng/mL of TGF-β1. CFU-GM and BFU-E colony assay was performed with 100 ng/mL of G-CSF and 2 U/mL of EPO, respectively, in the presence of TGF-β1 (0.1 or 1.0 ng/mL). Data are shown as the mean of triplicate colony number with error bars as SD.
Dose-dependent suppression of CFU-Meg, CFU-GM, and BFU-E colony formation by TGF-β1. CD34+ cells for colony assays were obtained from 3 different normal volunteers (cases no. 1, 2, and 3). CFU-Meg colony assay from 1 × 10³ of CD34+ cells was performed with TPO at a concentration of 100 ng/mL (○), 10 ng/mL (•), or 1.0 ng/mL (▪) in the presence of 0.1 and 1.0 ng/mL of TGF-β1. CFU-GM and BFU-E colony assay was performed with 100 ng/mL of G-CSF and 2 U/mL of EPO, respectively, in the presence of TGF-β1 (0.1 or 1.0 ng/mL). Data are shown as the mean of triplicate colony number with error bars as SD.
We next determined if the suppression of CFU-Meg by TGF-β1 was limited to a specific stage of megakaryopoiesis. TGF-β1 was added at various times to CFU-Meg formed in the presence of TPO (Fig 2). CD34+ cells that were not exposed to TPO stimulation showed no susceptibility to TGF-β1. The effect of TGF-β1 was weak at early stages (days 0 to 2), became apparent between days 4 and 6, and then at later stages returned to low levels (days 8 to 14). The results indicate that the suppressive effect of TGF-β1 is seen primarily at mid-megakaryopoiesis.
![Fig. 2. Stage-specific suppression of CFU-Meg by TGF-β1. CFU-Meg colony assay was performed with CD34+ cells incubated with TGF-β1 (1.0 ng/mL) in a delayed addition fashion at days 0, 2, 4, 6, 8, 10, 12, and 14 ([▩] presence of TPO in culture medium; [▧] presence of TGF-β1 in the culture medium). CFU-Meg colony assays, without TGF-β1 and with TGF-β1 preincubation for 24 hours, were also performed.](/view-large/figure/9132886/blod41817002x.jpeg)
Stage-specific suppression of CFU-Meg by TGF-β1. CFU-Meg colony assay was performed with CD34+ cells incubated with TGF-β1 (1.0 ng/mL) in a delayed addition fashion at days 0, 2, 4, 6, 8, 10, 12, and 14 ([▩] presence of TPO in culture medium; [▧] presence of TGF-β1 in the culture medium). CFU-Meg colony assays, without TGF-β1 and with TGF-β1 preincubation for 24 hours, were also performed.
Stage-specific suppression of CFU-Meg by TGF-β1. CFU-Meg colony assay was performed with CD34+ cells incubated with TGF-β1 (1.0 ng/mL) in a delayed addition fashion at days 0, 2, 4, 6, 8, 10, 12, and 14 ([▩] presence of TPO in culture medium; [▧] presence of TGF-β1 in the culture medium). CFU-Meg colony assays, without TGF-β1 and with TGF-β1 preincubation for 24 hours, were also performed.
Induction of TGF-β receptor I and II by TPO at midmegakaryopoietic stage.
The above-noted observations prompted us to examine the expression of receptors for TGF-β during megakaryopoiesis. The results are shown in Fig 3. The expression(s) of TGF-β receptors I and II was demonstrated to be evident only on days 2 to 4 and not on earlier or later days. This finding was compatible with the above-noted results showing that the maximal suppression of CFU-Meg by TGF-β1 is observed at the midmegakaryopoietic period.

Serial expression of mRNAs for TGF-β receptors I and II in culture. CD34+ cells were cultured in -MEM containing TPO (100 ng/mL). mRNAs for TGF-β receptors I and II were examined by RT-PCR.
Serial expression of mRNAs for TGF-β receptors I and II in culture. CD34+ cells were cultured in -MEM containing TPO (100 ng/mL). mRNAs for TGF-β receptors I and II were examined by RT-PCR.
Modulation of TPO expression in BM stromal cells by cytokines.
If TGF-β1 is indeed a feedback regulator for megakaryopoiesis, there should be a certain mechanism(s) that defines strict specificity of TGF-β action on megakaryopoiesis besides its relatively selective effect on CFU-Meg. We hypothesized that TGF-β1, as compared with other hematoregulatory cytokines, such as IL-3, IL-6, G-CSF, EPO, and TNF, might preferentially induce the stromal production of TPO, which, in turn, promotes commitment of stem cells into specific differentiation of megakaryolineage. Because, at present, there is no method to obtain large quantities of stromal cells directly from BM, we used the Dexter culture method that provides stromal cells comparable to their in vivo antecedents.33-35 Quantification of mRNA in stromal cells was performed using TaqMan RT-PCR. This method has been recently proven to be far more sensitive than RNAse protection assay and more accurate than competitive RT-PCR. The absolute amounts of mRNA in stromal cells were assessed by using standard curves of synthesized mRNA (Fig 4A). When normal BM stromal cells were treated with TGF-β1, expression of TPO mRNA showed an apparent and dose-dependent increment up to 7 times that of untreated cells (Fig 4B). TNF also showed an increment but to a much lesser degree, almost one fourth at maximal level than that of TGF-β1–treated stromal cells. TPO itself and IL-6 rather suppressed stromal TPO mRNA. G-CSF, EPO, and IL-3 showed essentially no effect on TPO mRNA expression.

(A) Standard curves of mRNAs for TPO (A), G-CSF (B), and GAPDH (C) in TaqMan RT-PCR analysis. Each standard mRNA preparation, synthesized using the method as shown in the text, was applied to the TaqMan RT-PCR system. The actual weight of each mRNA inputted to the system were plotted versus each cycle of threshold (CT). Absolute amounts of mRNA in stromal samples was determined by extrapolation to the x-axis. (B) Analysis of TPO mRNA expression in BM stromal cells treated with various cytokines. BM stromal cells obtained using Dexter culture method were cultured in -MEM with various cytokines for 24 hours. One microgram of total cellular RNA was isolated and TaqMan RT-PCR was performed with oligonucleotide primer for TPO. GAPDH was used as the internal control. Threshold Rn value and CT were obtained as described in Materials and Methods. TPO mRNA level and GAPDH mRNA level can be determined by standard curve of applied RNA weight and CT value. (C) Analysis of G-CSF mRNA expression in BM stromal cells treated with TGF-β1. BM stromal cells, obtained using the Dexter culture method, were cultured in -MEM with 0.3, 1.0, and 2.0 ng/mL of TGF-β1 for 24 hours. One microgram of total cellular RNA was isolated and TaqMan RT-PCR was performed with oligonucleotide primer for G-CSF. GAPDH was used as the internal control. G-CSF mRNA level and GAPDH mRNA level can be determined by standard curve of applied RNA weight and CT values.
(A) Standard curves of mRNAs for TPO (A), G-CSF (B), and GAPDH (C) in TaqMan RT-PCR analysis. Each standard mRNA preparation, synthesized using the method as shown in the text, was applied to the TaqMan RT-PCR system. The actual weight of each mRNA inputted to the system were plotted versus each cycle of threshold (CT). Absolute amounts of mRNA in stromal samples was determined by extrapolation to the x-axis. (B) Analysis of TPO mRNA expression in BM stromal cells treated with various cytokines. BM stromal cells obtained using Dexter culture method were cultured in -MEM with various cytokines for 24 hours. One microgram of total cellular RNA was isolated and TaqMan RT-PCR was performed with oligonucleotide primer for TPO. GAPDH was used as the internal control. Threshold Rn value and CT were obtained as described in Materials and Methods. TPO mRNA level and GAPDH mRNA level can be determined by standard curve of applied RNA weight and CT value. (C) Analysis of G-CSF mRNA expression in BM stromal cells treated with TGF-β1. BM stromal cells, obtained using the Dexter culture method, were cultured in -MEM with 0.3, 1.0, and 2.0 ng/mL of TGF-β1 for 24 hours. One microgram of total cellular RNA was isolated and TaqMan RT-PCR was performed with oligonucleotide primer for G-CSF. GAPDH was used as the internal control. G-CSF mRNA level and GAPDH mRNA level can be determined by standard curve of applied RNA weight and CT values.
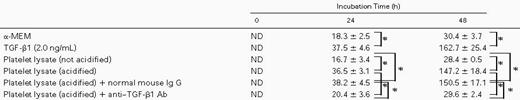
The increment of TPO expression in stromal cells by TGF-β1 was further verified by the measurement of TPO protein. As shown in Table 1, TPO concentrations in conditioned medium of stromal cells cultured for 24 hours and 48 hours with TGF-β1 were 37.5 ± 4.6 pg/mL and 162.7 ± 25.4 pg/mL, respectively. These were significantly higher than those (18.3 ± 2.5 pg/mL and 30.4 ± 3.7 pg/mL) of culture supernatants without TGF-β1.
Concentrations of TPO Protein in the Supernatant of BM Stromal Cells Stimulated With TGF-β1 or Platelet Lysate
 |
|
Bone marrow stromal cells were suspended in 96-well plates at a concentration of 5 × 10⁴/250 μL per well. After 24 hours of culture, the cells were refed with or without active TGF-β1 or platelet lysate. The concentration of TGF-β1 in platelet lysate was diluted to 2.0 ng/mL with α-MEM. The supernatants were removed after 24 and 48 hours of incubation and then assessed for ELISA. The platelet lysates were preincubated with 100 mg/mL of a polyclonal neutralizing anti–TGF-β1 antibody or an irrelevant mouse IgG1 at 37°C for 2 hours. Numbers represent TPO concentrations in picograms per milliliter.
Abbreviation: ND, not detectable.
P < .05.
To rule out the effect of agents other than TGF-β1 originating from platelets, we investigated the effect of anti–TGF-β antibody on TPO production of BM stromal cells by platelet lysates (Table 1). TPO concentrations in culture supernatant were 36.5 ± 3.1 pg/mL and 147.2 ± 18.4 pg/mL for 24 and 48 hours after incubation, respectively. This increment was blocked when the lysate was incubated with 100 μg/mL of anti–TGF-β1 polyclonal antibody (Selotec, Oxford, UK) but not with an irrelevant mouse Ig G1. These results clearly showed that TGF-β1, and no other factors originating from platelets, stimulates BM stromal TPO production.
We further studied the effect of TGF-β1 on stromal mRNA of 2 other essential hematopoietic factors: G-CSF and EPO. As shown in Fig 4C, the levels of G-CSF mRNA in TGF-β1–treated cells did show an increment, but only twice those of nontreated cells when treated at the same concentrations used for stimulation of TPO mRNA. EPO mRNA was not detectable in the stromal cell preparation; therefore, no effect due to TGF-β1 treatment was observed. Taken collectively, TGF-β1 was found to be a potent and considerably specific upregulator of TPO mRNA in stromal cells.
Increased expression levels of TPO mRNA in stromal cells and TGF-β concentrations in BM from the patients with ITP.
The pathophysiological significance of the previously stated in vitro findings were validated by examining the levels of BM TGF-β1 and stromal TPO mRNA expression in normal subjects and patients with ITP. Quantification of the stromal TPO mRNA was similarly performed using TaqMan RT-PCR. In Table 2 are shown the mean concentrations of active TGF-β1 together with those of latent form in BM and PB of normal subjects and patients with ITP. Both active and latent values in ITP were higher (P < .05) than those in normal subjects and returned to near-normal values after steroid therapy. As shown in Fig 5, in each case without exception, the level of active and latent TGF-β1 in BM was higher than that in PB. There was a strong positive correlation between values of TGF-β1 in BM and those in PB of these patients (active TGF-β1, r = .82; latent TGF-β1, r = .85). The inclination is steeper in latent TGF-β1 (y = 2.05x − 0.34) than in active TGF-β1 (y = 1.23x + 0.032). When the data of these results were plotted (Fig 6), a positive correlation between these concentrations of active TGF-β1 and levels of TPO mRNA was observed.
Laboratory Findings on Megakaryopoiesis of Normal Subjects and the Patients With ITP Before and After PSL Treatment
 |
|
Immature megakaryocyte indicates a megakaryocyte with a low cytoplasm-to nucleus ratio, nongranular cytoplasm, and a nucleus that appears uniformly stippled. Data represent the mean ± SD.
P < .05.

Relationship between BM and PB TGF-β concentrations. The concentrations of TGF-β1 (both active and latent forms) in BM and PB plasma were measure by ELISA. (•) Normal subject; (□) patient with ITP; (▵) patient with ITP after PSL treatment. A positive correlation was observed in both active and latent TGF-β1 (r= .82 and .85, respectively). In each subject, the TGF-β1 concentrations in BM were consistently higher than those in the PB. (A) Active TGF-β1; (B) latent TGF-β1.
Relationship between BM and PB TGF-β concentrations. The concentrations of TGF-β1 (both active and latent forms) in BM and PB plasma were measure by ELISA. (•) Normal subject; (□) patient with ITP; (▵) patient with ITP after PSL treatment. A positive correlation was observed in both active and latent TGF-β1 (r= .82 and .85, respectively). In each subject, the TGF-β1 concentrations in BM were consistently higher than those in the PB. (A) Active TGF-β1; (B) latent TGF-β1.

Relationship between the concentration of BM TGF-β1 and TPO mRNA expression in BM stromal cells. (•) Normal subject; (□) patient with ITP; (▵) patient with ITP after PSL treatment. Positive correlation was observed (r = .72).
Relationship between the concentration of BM TGF-β1 and TPO mRNA expression in BM stromal cells. (•) Normal subject; (□) patient with ITP; (▵) patient with ITP after PSL treatment. Positive correlation was observed (r = .72).
Maturation arrest of megakaryocytes in BM of ITP patients.
BM trephines of ITP patients showed a higher number of megakaryocytes than normal subjects with hypolobulation (maturation arrest) that tended to normalize as the TGF-β1 concentration returned to normal in those who underwent steroid therapy (Table 2), consistent with the in vitro finding that TGF-β–treated CFU-Meg is impaired at middifferentiation stages but not at earlier stages (Fig 7).

Regulation of megakaryopoiesis. TPO mRNA expression in BM stromal cells is enhanced by TGF-β1, which suppresses the TPO-promoted CFU-Meg with relative specificity at midmegakaryopoiesis by interacting with receptors I and II, which were induced by TPO itself in normal subjects (A). Increased TGF-β1 from destroyed platelets or megakaryocytes markedly upregulates TPO mRNA expression in stromal cells. The subsequent production of TPO stimulates stem cells to commit to the megakaryocyte lineage. The expression of the TGF-β receptor on megakaryoblasts renders them susceptible to suppression by TGF-β1 in patients with ITP (B).
Regulation of megakaryopoiesis. TPO mRNA expression in BM stromal cells is enhanced by TGF-β1, which suppresses the TPO-promoted CFU-Meg with relative specificity at midmegakaryopoiesis by interacting with receptors I and II, which were induced by TPO itself in normal subjects (A). Increased TGF-β1 from destroyed platelets or megakaryocytes markedly upregulates TPO mRNA expression in stromal cells. The subsequent production of TPO stimulates stem cells to commit to the megakaryocyte lineage. The expression of the TGF-β receptor on megakaryoblasts renders them susceptible to suppression by TGF-β1 in patients with ITP (B).
DISCUSSION
Inhibition of CFU-Meg by TGF-β has been previously shown by several investigators. However, in their investigations, relatively nonspecific stimulators for CFU-Meg, such as combined preparations of plasma of aplastic anemia, phytohemagglutinin (PHA)-stimulated lymphocyte conditioned medium, IL-3, or IL-6, were used because of the unavailability of TPO; therefore, the inhibitory effects were not discussed in reference to genuine TPO activity.9 10
In the present study, we first demonstrated that TGF-β did strongly suppress TPO-induced CFU-Meg in a dose-dependent manner. The magnitude of suppression on CFU-Meg was greater than on G-CSF–induced CFU-GM or on EPO-induced BFU-E. Interestingly, the suppression was rather stage-specific (middifferentiation), with no effect on primitive stem cells, resulting in a maturational arrest of megakaryopoiesis. This observation is consistent with previous reports by Roberts and Sporn,36 who found a lack of responsiveness to TGF-β in matured megakaryocyte, and Kuter et al,37 who found the inhibition by TGF-β on endomitosis of megakaryocytes. In support of a stage-specific suppression of megakaryopoiesis, we also found that TPO induced the expression of TGF-β receptors on megakaryoblasts at midmegakaryopoiesis (Fig 3).
However, to establish the concept of feedback regulation, it may be required to prove further specificity of TGF-β action on megakaryopoiesis. In this context, because we have recently disclosed the fact that BM stromal TPO is a key regulator of megakaryopoiesis, we hypothesized that TGF-β may enhance expression of stromal TPO, which specifically induced proliferation and differentiation of megakaryocytes. To analyze the effect of TGF-β on TPO mRNA expression of BM stromal cells, we used TaqMan real time RT-PCR, because the expression level of TPO mRNA in BM stromal cells was far lower than the detection limit of RNAse protection assay. TGF-β was found to apparently stimulate stromal TPO mRNA expression, whereas other hemato-regulatory cytokines were shown to either suppress it (TPO and IL-6), slightly enhance it (TNF), or have no effect (G-CSF, EPO, and IL-3). Furthermore, when the effect of TGF-β1 on the other major hematopoietic cytokine, G-CSF, which is produced by stromal cells and defines the myeloid lineage specificity, was compared with that on TPO, the latter was stronger by far. Because another lineage-defining cytokine, EPO, was not produced by stromal cells, the effect of TGF-β1 on this particular cytokine was not examined in the present study. Thus, the specificity of TGF-β1 action on megakaryopoiesis is considered to be doubly assured at 2 steps: (1) an induction of stromal TPO and (2) at suppression of CFU-Meg. TGF-β1 selectively enhances the stromal TPO, which commits the stem cell specifically to the megakaryocyte lineage and, in turn, suppresses megakaryopoiesis at the middifferentiation period. We then verified these in vitro experimental results by in vivo comparison of the concentrations of BM TGF-β1, expression of stromal TPO mRNA, and BM profiles of megakaryopoiesis between patients with ITP and normal subjects. We focused our interest on ITP because, in this pathological state, TGF-β1 is speculated to be released from megakaryocytes or platelets that have been degradated by autoantibodies, and potency of megakaryopoiesis itself is not deteriorated. In patients with ITP, both active and latent TGF-β1 were higher (P < .05) than those in normal subjects and returned to near-normal values after steroid therapy. The levels of active and latent TGF-β1 in BM were higher than those in PB in each case without exception. This indicates that TGF-β1 in BM were mainly derived from cells in BM, most likely megakaryocytes and platelets.38-41 A strong positive correlation between values of TGF-β1 in BM and PB was observed; however, the inclination was steeper in latent TGF-β1 than in active TGF-β1. This may be explained by assuming the faster clearance of active TGF-β1, which interacts with TGF-β1 receptors expressed on megakaryocytes, than of latent TGF-β1, which normally exist as a complex with α2-macroglobulin (receptor-inaccessible form) in plasma. These results clearly suggest that active TGF-β1 is one of the key factors defining the TPO production by stromal cells. Nevertheless, the above-mentioned in vitro findings were compatible with the subsequently made in vivo observations that megakaryocytes in ITP patients were increased but hypo-lobulated (immature), had a profile of maturation arrest without any particular change in other hematopoietic lineages, and tended to become normal after steroid therapy. This unique BM feature is in agreement with that previously documented for ITP.42,43 In addition to ITP, there are some pathological conditions in which the relationship between levels of circulation TPO and platelet counts is unexplainable by the sponge theory. For example, in busulfan-treated mice, plasma TPO after platelet transfusion are elevated to such a high level as to be unaccountable for by the sponge theory.6However, this may be explained by assuming that transfused platelets supplied sufficient TGF-β to the stromal cells to produce TPO. Another example is found with NF-E2−/− mice in which normal serum thrombopoietin levels are seen in the face of profound thrombocytopenia.44 It may be that stromal cells had not been exposed to TGF-β due to innate platelet insufficiency. Measurement of TGF-β levels in these mice will confirm the above-noted assumption. Another pathological condition that indicates a relationship between TGF-β and megakaryopoiesis may be essential thrombocythemia. We have recently found that, in this particular disease, there is a mutation as kinase domain of type II receptor for TGF-β (data not shown). Elucidation as to whether this mutation has pathognomonic meaning is warranted.
As for the physiological test of the animal model, Carlino et al11 have already reported that, when TGF-β (0.1% wt/vol) was administered daily subcutaneously from day 0 to day 13 to C3H/He mice, a highly significant decrease was seen in platelet count in circulation, and the megakaryocyte count increased inversely. With regard to the gene knock-out effect, Shull et al12 have already observed that, in TGF-β (−/−) mice, there was an increase of platelets in the circulation as well as of neutrophils and monocytes. However, this phenomenon may not be solely ascribed to the direct effect of TGF-β1 deletion on hematopoiesis but possibly to the hyperimmunoreactive state caused by TGF-β1 depletion. In this context, Letterio et al,13 using TGF-β (−/−) major histocompatibility complex (MHC) class II (−/−) double knockout mice, demonstrated an excess of megakaryopoiesis accompanied by a slight increase of granulocyte count.
These previous observations in TGF-β–administered or TGF-β knockout mice strongly support our model of megakaryopoiesis regulated by TGF-β and TPO.
In conclusion, we propose the concept of feedback regulation on megakaryopoiesis by TGF-β1 released from platelets or megakaryocytes; TGF-β1 from destroyed platelets or megakaryocytes stimulates TPO synthesis in stromal cells and, in turn, stimulates stem cells (CD34+ cells) to commit to the megakaryocyte lineage and to express TGF-β1 receptors that render them susceptible to suppression by TGF-β1 (Fig 7).
ACKNOWLEDGMENT
The authors thank Dr Susan Feldman for her editorial assistance; Dr Irving Listowsky for helpful discussion and critical reading of our manuscript; Dr Kohei Miyazono for helpful discussion; and Kevin Litton for critical reading of our manuscript.
Supported in part by a Grant-in-Aid for Scientific Research from the Ministry of Education, Science and Culture of Japan.
The publication costs of this article were defrayed in part by page charge payment. This article must therefore be hereby marked “advertisement” in accordance with 18 U.S.C. section 1734 solely to indicate this fact.

This feature is available to Subscribers Only
Sign In or Create an Account Close Modal