Abstract
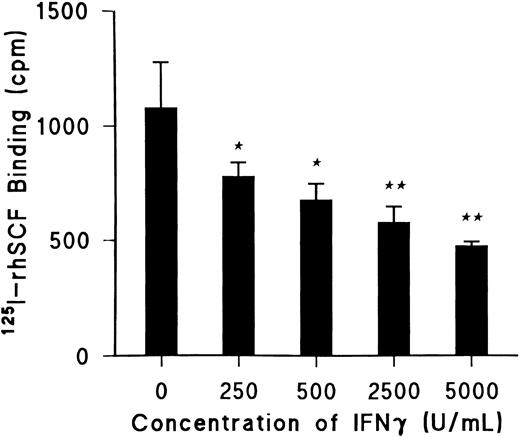
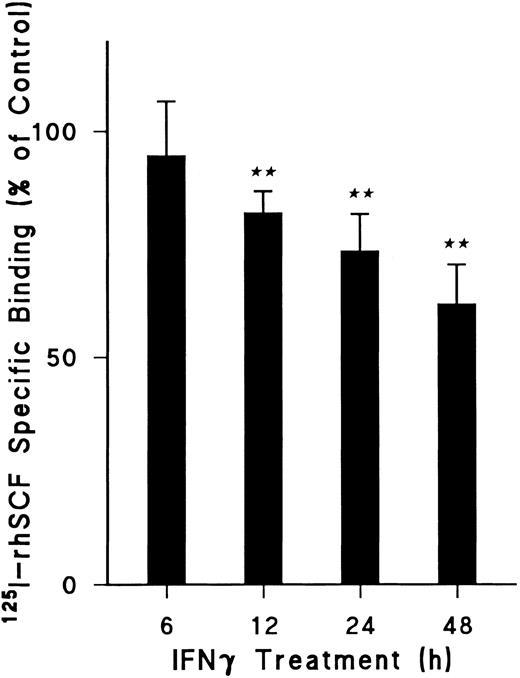
Interferon γ (IFNγ) has been shown to inhibit proliferation and differentiation of erythroid progenitor cells and to produce apoptosis of erythroid cells, whereas stem cell factor (SCF ), erythropoietin (EP), and insulin-like growth factor-I (IGF-I) have distinct roles in enhancing erythroid cell production and preventing apoptosis. The mechanism by which IFNγ exerts an inhibitory effect on the positive roles of these growth factors is unknown. Although some inhibitory cytokines including IFNγ have been shown to downregulate growth factor receptors, the effect of IFNγ on SCF, EP, and IGF-I receptors of human erythroid progenitor cells has not been defined. We obtained highly purified day-5 or day-6 erythroid colony-forming cells (ECFCs) from human blood in sufficient quantity and purity for radiolabeled cytokine binding studies and analysis of mRNA. When day-5 ECFCs were incubated with increasing concentrations of recombinant human (rh) IFNγ for 24 hours at 37°C, specific binding of 125I-rhSCF to SCF receptors was significantly decreased by 25% to 40% in a dose-dependent fashion, with the maximum effect at 2,500 to 5,000 U/mL of IFNγ. The decrease was apparent by 12 hours of incubation and was only slightly lower by 24 hours. The numbers of SCF and EP receptors, but not of IGF-I receptors, per ECFC, calculated by Scatchard analysis, were significantly decreased by 30% and 23% to 25%, respectively, after incubation with 2,500 U/mL rhIFNγ for 24 hours at 37°C, whereas the binding affinities were not affected. This decrease in SCF receptors was confirmed by flow cytometry using an anti–c-kit mouse monoclonal antibody. Northern blot analysis showed that the mRNAs for the SCF and EP receptors, but not for the IGF-I receptors, were decreased by 50% to 60% after 3 hours of incubation at 37°C with 2,500 U/mL of rhIFNγ. This persisted for 24 hours without alteration of the stability of the SCF and EP receptor mRNAs. These observations suggest that one means by which IFNγ inhibits erythroid cell proliferation and differentiation and produces apoptosis may be through the reduction of the number of target receptors for SCF and EP and that this occurs through transcriptional inhibition of the corresponding mRNAs.
HUMAN INTERFERON γ (IFNγ) is a multifunctional cytokine secreted by activated T lymphocytes and natural killer cells. It is a potent inducer of activation and differentiation of mononuclear phagocytes and lymphocytes and also exerts antiviral, antiproliferative, and immunomodulatory activities on a wide variety of cells.1,2 IFNγ also has been shown to inhibit the growth of granulocyte-macrophage colony-forming units (CFU-GM), burst-forming units-erythroid (BFU-E), and colony-forming units-erythroid (CFU-E) in vitro.3-7 Because blood IFNγ levels are elevated and vary directly with the degree of the anemia in patients with hematologic malignancies8 and human immunodeficiency virus seropositivity9 and because IFNγ directly inhibits erythroid progenitor colony formation,6,7 IFNγ appears to have a prominent role in producing the anemia associated with chronic disease.10-12
Recently, our laboratory showed that the incubation of recombinant human (rh) IFNγ with mature highly purified human BFU-E inhibited erythroid colony formation, cell proliferation, and differentiation and produced apoptosis of the maturing erythroid cells.7 Erythropoietin (EP) and stem cell factor (SCF ) or insulin-like growth factor-I (IGF-I) were shown to act synergistically to promote proliferation and/or differentiation of erythroid progenitor cells and prevent apoptosis in vitro.13,14 SCF and EP can overcome the inhibitory effect of rhIFNγ on erythroid progenitor cells in vitro,5,7 and high doses of EP can correct the anemia associated with chronic disease.11,12,15 Thus, IFNγ and these growth factors have opposing effects on erythroid progenitor cells, but the mechanisms by which these opposing effects occur is unknown. Although some inhibitory factors, such as transforming growth factor β1 (TGF-β1)16-19 and tumor necrosis factor α (TNFα),20 have been shown to suppress hematopoietic cell growth by downregulating SCF receptors, and IFNγ has been shown to downregulate interleukin-6 (IL-6), IL-4, and macrophage mannose receptors,21-23 the effect of IFNγ on growth factor receptor expression of erythroid progenitor cells is unknown.
A method has been reported from our laboratory by which human erythroid colony-forming cells (ECFCs) can be highly purified, starting with peripheral blood BFU-E, in a sufficient amount for analysis of EP-, IGF-I–, SCF-, and IFNγ-specific binding,24-28 as well as molecular analysis of specific mRNA.29 In this report, we show that the incubation of rhIFNγ with day-5 to day-6 ECFCs decreases the number of receptors and the steady-state levels of mRNAs for the SCF and EP receptors, but not for the IGF-I receptors, indicating that this may be one mechanism by which IFNγ opposes the positive influence of these growth factors.
MATERIALS AND METHODS
Blood.Four hundred milliliters of blood was collected in sodium heparin (20 U/mL) from normal donors after informed consent was obtained. The studies were approved by the Vanderbilt University and Department of Veterans Affairs Medical Center (Nashville, TN) Institutional Review Boards.
Generation of ECFCs.ECFCs were prepared by a modified method described previously.14,24 Light-density mononuclear cells were obtained by density centrifugation using Ficoll-Hypaque (1.077 g/mL). Platelets were removed by cell centrifugation through Dulbecco's phosphate-buffered saline (PBS) containing 13.6 mmol/L sodium citrate (D-PBS) with 10% bovine serum albumin (BSA; Intergen Co, Purchase, NY). This was followed by T-lymphocyte depletion using sheep erythrocyte rosetting and by adherent cell depletion with overnight incubation in polystyrene flasks at 37°C. Negative panning was then performed using CD11b, CD2, CD45, and CD16 monoclonal antibodies (MoAbs) to purify BFU-E to approximately 0.4%. The remaining cells were then cultured at 3 to 5 × 10⁵ cells/mL in Iscove's modified Dulbecco's medium (IMDM; Sigma Chemical Co, St Louis, MO) with 20% heat-inactivated fetal calf serum (FCS; Hyclone Laboratories, Logan, UT); 5% heat-inactivated, pooled, human AB serum; 1% deionized BSA; 5 × 10⁻⁵ mol/L 2-mercaptoethanol (2-ME); 500 U/mL penicillin; 40 μg/mL streptomycin; 50 U/mL rhIL-3 (Genetics Institute, Boston, MA); 10 μg/mL rh insulin (Eli Lilly Co, Indianapolis, IN); and 2 U/mL rhEP (Amgen Inc, Thousand Oaks, CA) in 10-mL polystyrene tissue culture flasks. After incubation at 37°C in 5% CO2 /95% humidified air for 4 or 5 days (day-5 or day-6 cells), the cells were collected and ECFCs were further enriched by centrifugation through 10% BSA and then by centrifugation over Ficoll-Hypaque. In some experiments, negative panning was performed again at this time with CD2, CD5, CD7, CD11b, CD15, CD20, and CD45 MoAbs to obtain more purified ECFCs.28 The ECFCs had greater than 95% viability and 33% to 79% purity on day 6. The cells were resuspended in 2 mL of IMDM containing 0.1% deionized BSA and were incubated for 30 minutes at 37°C to remove surface cytokines, which might be bound to cell surface receptors, before radiolabeled cytokine binding measurements.25-28
Plasma clot assay for ECFCs.Cells were cultured at a concentration of 103/mL in a mixture containing IMDM; 15% heat-inactivated FCS; 5% heat-inactivated, pooled, human type AB serum; 1% deionized BSA; penicillin and streptomycin; 2 mg/mL fibrinogen (Sigma); 0.2 U/mL bovine thrombin (Parke-Davis, Morris Plains, NJ); 10 μg/mL rh insulin; and 2 U/mL rhEP. The incubations were performed in 48-well flat-bottomed tissue culture plates (Costar, Cambridge, MA) with 0.2 mL/well and on day 15 the cells were fixed and stained with 3, 3′ dimethoxybenzidine and hematoxylin. Colonies of 2 or more hemoglobinized cells were scored as ECFCs and the purity was determined by the plating efficiency. Data are expressed as means ± SD and significance was calculated using the t-test.
Treatment with rhIFNγ.Purified day-5 or day-6 ECFCs were incubated with 0 to 5,000 U/mL rhIFNγ (4.75 × 10⁷ U/mg; Genzyme Corp, Cambridge, MA) for the indicated periods in IMDM with 20% FCS; 5% heat-inactivated, pooled, human type AB serum; 1% deionized BSA; 5 × 10⁻⁵ mol/L 2-ME; 50 U/mL rhIL-3; 10 μg/mL rh insulin; penicillin; streptomycin; and 2 U/mL rhEP.
Binding to ECFCs.Cells incubated with and without rhIFNγ were collected in IMDM at 0°C containing 0.1% deionized BSA, and 0.5 to 5 × 10⁵ cells in 50 μL were incubated in the presence of varying concentrations of 125I-rhSCF,27125I-rhEP,24,25 or 125I-rhIGF-I26 (Amersham Corp, Arlington Heights, IL). After 48 hours of incubation at 0°C, the cells were collected in 0.125 mL of PBS at 0°C and then layered over 0.9 mL of 10% BSA in PBS, at 0°C, in microfuge tubes. These were spun at 15,000g at 3°C for 4 minutes, after which they were rapidly frozen in ethanol and dry ice. The tips of the tubes were cut off, and the radioactivity of the cell pellets was counted in a gamma counter (Nuclear Chicago, Chicago, IL). Nonspecific binding was determined with a 100-fold excess of unlabeled rhSCF (Amgen), rhEP (Amgen), and rhIGF-I (Intergen). Specific binding was calculated by subtracting nonspecific binding from total binding, and Scatchard analysis was performed. Data are expressed as means ± SD for three experiments and significance was calculated using the paired t-test.
DNA probes.The SCF receptor probe was a 2.2-kb EcoRI/Bgl II fragment obtained from the full-length cDNA clone of human c-kit (provided by Amgen). The EP receptor probe was a 1.1-kb EcoRI/BamHI DNA fragment obtained from the human EP receptor clone ER2.29 The human IGF-I receptor probe was a 40-base single-stranded synthetic oligonucleotide derived from the 5′ end of the coding region and of antisense orientation [IGF-1-R (Pr-1); Calbiochem, Cambridge, MA].30 The actin probe was a Pst I cDNA fragment containing the entire α-actin coding region obtained from mouse actin clone PAM91.29
RNA extraction and Northern blot analysis.Total RNA was extracted from day-6 cells treated, or not treated, with IFNγ using ULTRASPEC RNAzol (BIOTECX Laboratories, Inc, Houston, TX).31 The total cellular RNA extracted from ECFCs was quantitated by determining absorbance at 260 nm. Northern blot analysis was performed by previously described methods.29 Briefly, samples of 20 μg of RNA were fractionated on a 0.8% agarose gel containing 0.66 mol/L formaldehyde. After electrophoresis, the gels were photographed and blotted onto nylon membranes (Quiagen Inc, Chatsworth, CA). Membranes were blocked by incubation in a prehybridization buffer containing 6× SSC (1× SSC = 0.15 mol/L NaCl, 0.015 mol/L sodium citrate), 50% formamide, 5× Denhardt's solution (0.1% Ficoll, 0.1% polyvinylpyrrolidone, and 0.1% BSA), and 0.5% sodium dodecyl sulfate (SDS) for 2 to 3 hours at 42°C. Hybridization was accomplished by adding 1 × 10⁶ cpm/mL of the SCF or EP receptor DNA probes, which had been 32P-labeled by the random priming labeling method (Prime-I+ RmT; Stratagene, La Jolla, CA), or the IGF-I receptor probe, which was 32P-labeled by the DNA 5′-End Labelling Kit purchased from Boehringer Mannheim (Indianapolis, IN). After 16 to 20 hours of hybridization at 42°C, the membranes were washed with 2× SSC with 0.5% SDS at 26°C for 20 minutes, followed by 0.1× SSC with 0.1% SDS at 55°C for 1.5 hours, and exposed on Kodak X-Omat film (Eastman Kodak, Rochester, NY) at −70°C.
The relative amounts of total RNA present in each lane were estimated by scanning a photographic-negative of the ethidium bromide-stained gel over the 18S ribosomal RNA band. The autoradiographic hybridization signal in each lane was then normalized to the amount of total RNA present in that lane by comparing it with the peak area of 18S RNA in the densitometric scan of the stained gels. Previous studies have shown that the estimates of RNA amounts based on photography and scanning of stained gels were linear with respect to the amounts of RNA loaded into the gels.29 In all RNA analyses of ECFCs, normalization of RNA loading and blot transfer was also checked by rehybridizing the blots with the probe for the RNA of actin. Actin mRNA is maintained at constant levels in ECFCs in the presence of EP during the periods analyzed.
Actinomycin D chase experiments were performed to determine the half-lives of mRNAs as previously described.29 After day-6 ECFCs were treated with and without 2,500 U/mL rhIFNγ for 5 hours, RNA synthesis was inhibited by the addition of actinomycin D (5 μg/mL) for various time periods up to 4 hours. Previous experiments have shown a 30-minute lag period before this concentration of actinomycin D fully inhibits RNA synthesis and this 30-minute period was subtracted from the apparent half-life of the mRNA.29 Quantitation of the autoradiographic signal was performed with a laser scanning densitometer (BioRad video densitometer model 620; BioRad, Richmond, CA). Statistical comparison of mRNA half-lives for control and IFNγ-treated cells was made by using two-way analysis of variance (ANOVA).32
Flow cytometric analysis.Data acquisition was performed on a Becton Dickinson FACscan flow cytometer with data saved as listmode files (Becton Dickinson, San Jose, CA). SCF receptor expression was evaluated by flow cytometry on cells incubated at 37°C with and without rhIFNγ for 24 hours from day 5 to day 6. The cells were collected in PBS, containing 0.1% deionized BSA, at 0°C. Cells were washed twice with PBS and were then resuspended at a concentration of 5 × 10⁵ cells/mL in 1 mL PBS containing 0.1% BSA and were incubated with 10 μg/mL anti–c-kit mouse MoAb (SR-1; Amgen) at 0°C for 30 minutes. The same concentration of murine IgG2a (Zymed Laboratories, Inc, San Francisco, CA) was used as an isotype control in each experiment. After being washed twice, 5 × 10⁵ cells were resuspended in 1 mL PBS containing 0.1% BSA. The cells were incubated with 20 μg/mL FITC-F(ab′)2 goat antimouse IgG(H+L) (Zymed) at 0°C for 30 minutes and were then washed twice before fixation with 1% paraformaldehyde in PBS and storage at 4°C in the dark before analysis.
Offline analysis of flow cytometry.Flow cytometric listmode data files were analyzed using the “Subtract Histogram” feature of WinList 3.0 from Verity Software House, Inc (Topsham, ME). This statistic uses an enhanced normalized subtraction (ENS) method with the Kolmorgorov-Smirnov (KS) statistic, ie, the maximum absolute difference (Dmax) between two cumulative probability distributions, as a means to more accurately estimate the positive distribution in two overlapping populations and determine a more accurate percentage of test histogram that is positive or the part that remains after subtraction.33 In this study, the experimental histogram was always subtracted from the control. Thus, each subtracted histogram shows the uninhibited control and that part of the control that remains after the experimental histogram data is subtracted. The ENS method has a mean error of −0.85 compared with −2.69 to −7.73 for prior methods.33
RESULTS
IFNγ reduces SCF-specific binding.Day-5 ECFCs were incubated at 37°C with increasing concentrations of rhIFNγ between 0 and 5,000 U/mL for 24 hours, and specific binding of 125I-rhSCF was determined using 0.5 nmol/L 125I-rhSCF as previously described (Fig 1).27 rhIFNγ significantly decreased 125I-rhSCF–specific binding in a dose-dependent manner by 25% (P < .03) at the lowest dose of 250 U/mL and by 40% (P < .01) at the highest dose of 5,000 U/mL. The total number of ECFCs in the control and rhIFNγ-treated cultures after 24 hours of incubation with rhIFNγ was unchanged. As a result of this information, 2,500 U/mL of rhIFNγ was chosen for incubation with the ECFCs in all further experiments to determine its effect on specific binding.
IFNγ significantly decreases 125I-rhSCF–specific binding to ECFC in a dose-dependent manner. Day-5 ECFCs were incubated at 37°C with various concentrations of rhIFNγ between 0 and 5,000 U/mL for 24 hours and specific binding of 0.5 nmol/L 125I-rhSCF was determined. (★) P < .03 between control cells and cells treated with 250 or 500 U/mL rhIFNγ; (★★) P < .01 between the control cells and cells treated with 2,500 or 5,000 U/mL rhIFNγ. At 24 hours, ECFC purity was 42% ± 4% for control cells and 43% ± 4% for 5,000 U/mL rhIFNγ-treated cells with no significant changes in total cell concentrations. Data are expressed as means ± SD of triplicates.
IFNγ significantly decreases 125I-rhSCF–specific binding to ECFC in a dose-dependent manner. Day-5 ECFCs were incubated at 37°C with various concentrations of rhIFNγ between 0 and 5,000 U/mL for 24 hours and specific binding of 0.5 nmol/L 125I-rhSCF was determined. (★) P < .03 between control cells and cells treated with 250 or 500 U/mL rhIFNγ; (★★) P < .01 between the control cells and cells treated with 2,500 or 5,000 U/mL rhIFNγ. At 24 hours, ECFC purity was 42% ± 4% for control cells and 43% ± 4% for 5,000 U/mL rhIFNγ-treated cells with no significant changes in total cell concentrations. Data are expressed as means ± SD of triplicates.
To delineate the most appropriate incubation period, time course experiments were performed (Fig 2). A significant reduction of 125I-rhSCF–specific binding was observed by 12 hours of incubation with rhIFNγ (P < .001) and continued at 24 hours (P < .001). Although this reduction was enhanced at 48 hours of incubation, the specific binding of IFNγ-treated cells could not be precisely compared with control cells at this time because the concentration of total cells and ECFCs in the IFNγ group was decreased beyond that of the control cells. For this reason, 24 hours of incubation with or without rhIFNγ was selected for all further experiments because no significant difference in total cell number or ECFC percentage occurred during this period.
Effect of duration of IFNγ incubation with day-5 ECFCs on reduction of 125I-rhSCF–specific binding. Control cells not treated with rhIFNγ were incubated for the same periods of time at 37°C and then specific binding was determined as in Fig 1. Data are expressed as a percentage of the control and as means ± SD of three experiments. (★★) P < .001 between control cells and rhIFNγ-treated cells. ECFC purity was 61% ± 9% for control cells and 57% ± 5% for rhIFNγ-treated cells at 24 hours (P = .17), with no significant change in total cell concentrations over 24 hours (P < .5).
Effect of duration of IFNγ incubation with day-5 ECFCs on reduction of 125I-rhSCF–specific binding. Control cells not treated with rhIFNγ were incubated for the same periods of time at 37°C and then specific binding was determined as in Fig 1. Data are expressed as a percentage of the control and as means ± SD of three experiments. (★★) P < .001 between control cells and rhIFNγ-treated cells. ECFC purity was 61% ± 9% for control cells and 57% ± 5% for rhIFNγ-treated cells at 24 hours (P = .17), with no significant change in total cell concentrations over 24 hours (P < .5).
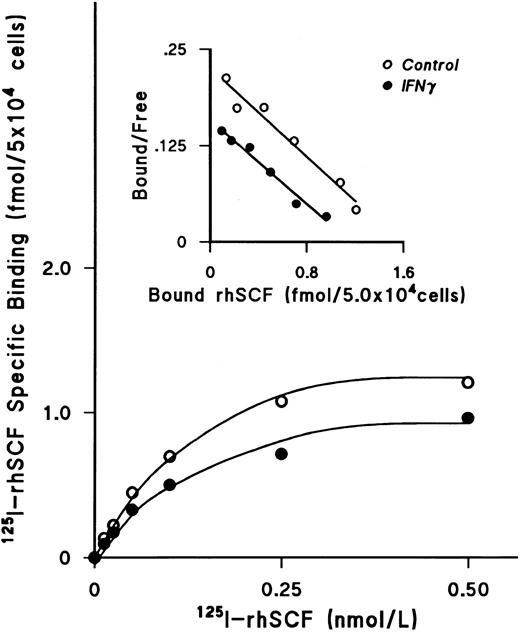
IFNγ downregulates SCF receptors.We next examined the effect of rhIFNγ on specific binding of increasing concentrations of 125I-rhSCF to ECFCs to determine the affinity and number of SCF receptors (Fig 3). After day-5 ECFCs were incubated at 37°C with 2,500 U/mL of rhIFNγ for 24 hours, saturation of specific binding to control and IFNγ-treated cells was reached at a concentration of 0.5 nmol/L of 125I-SCF and the level of specific binding to the rhIFNγ-treated cells was significantly lower than that to the control cells. Scatchard analysis was performed, which showed a single class of SCF receptors in both groups. A summary of three individual experiments is shown in Table 1. Although the value of the kd in the control and rhIFNγ-treated cells was not significantly different, the number of receptors per cell, or per ECFC, in the rhIFNγ-treated cells was 30% lower than that of the control cells. This was confirmed by flow cytometric analysis, which showed that, after day-5 cells were incubated in a similar manner with rhIFNγ, untreated control cells expressed 34% to 44% more relative c-kit fluorescence than did cells exposed to rhIFNγ (Fig 4).
IFNγ downregulates 125I-rhSCF–specific binding to ECFCs. The effect of rhIFNγ on 125I-SCF–specific binding was examined to determine the affinity and number of SCF receptors. Day-5 ECFCs were incubated with 2,500 U/mL of rhIFNγ for 24 hours and then specific binding of 125I-rhSCF was measured. The level of 125I-rhSCF–specific binding in the rhIFNγ group (•) was significantly lower than in the control group (○). Scatchard analysis shows a single class of SCF receptors in both groups, with reduction of the receptor number after rhIFNγ treatment, but no effect on the kd. A summary of triplicate experiments is shown in Table 1. ECFC purity in this experiment was 53% ± 7% in the control group and 48% ± 1% in the rhIFNγ group.
IFNγ downregulates 125I-rhSCF–specific binding to ECFCs. The effect of rhIFNγ on 125I-SCF–specific binding was examined to determine the affinity and number of SCF receptors. Day-5 ECFCs were incubated with 2,500 U/mL of rhIFNγ for 24 hours and then specific binding of 125I-rhSCF was measured. The level of 125I-rhSCF–specific binding in the rhIFNγ group (•) was significantly lower than in the control group (○). Scatchard analysis shows a single class of SCF receptors in both groups, with reduction of the receptor number after rhIFNγ treatment, but no effect on the kd. A summary of triplicate experiments is shown in Table 1. ECFC purity in this experiment was 53% ± 7% in the control group and 48% ± 1% in the rhIFNγ group.
IFNγ Downregulates SCF Receptors While Not Affecting kd
| Cell Type . | ECFC Purity . | kd . | No. of Receptors Per Cell . | No. of Receptors Per ECFC . |
|---|---|---|---|---|
| . | (%) . | (nmol/L) . | . | . |
| Control | ||||
| 1 | 49 ± 4 | 0.139 | 18,984 | 38,744 |
| 2 | 53 ± 7 | 0.129 | 24,116 | 45,502 |
| 3 | 36 ± 5 | 0.133 | 24,136 | 67,046 |
| Mean | 46 ± 7 | 0.134 ± 0.004 | 22,412 ± 2,424 | 50,431 ± 12,068 |
| IFNγ | ||||
| 1 | 51 ± 4 | 0.147 | 14,046 | 27,541 |
| 2 | 48 ± 1 | 0.119 | 16,100 | 33,543 |
| 3 | 37 ± 4 | 0.135 | 16,831 | 45,489 |
| Mean | 45 ± 6 | 0.134 ± 0.011 | 15,659 ± 1,179 | 35,524 ± 7,460 |
| P value | >.78 | >.95 | .019 | .047 |
Day-5 ECFCs, at a concentration of 1 × 10⁶/mL, were cultured with and without 2,500 U/mL IFNγ for 24 hours at 37°C. The cells were then incubated with increasing concentrations of 125I-rhSCF (0 to 0.5 nmol/L) for 48 hours at 0°C, and specific binding was determined. The kd and number of receptors were calculated by Scatchard analysis. Data are expressed as means ± SD and significance was calculated using the paired t-test.
Dose-response effect of IFNγ on relative c-kit fluorescence. Day-5 cells were incubated with rhIFNγ (500 U/mL [A], 1,000 U/mL [B], 2,500 U/mL [C], and 5,000 U/mL [D]) for 24 hours at 37°C and then antibody was added and data were analyzed as described in the Materials and Methods. Expression of c-kit fluorescence is shown for untreated control cells (□) and control cells remaining (▪) after subtraction of data from IFNγ-treated cells. The figures in the upper right corners indicate the relative fluorescence of control cells over that of IFNγ-treated cells. ECFC purity in control cells was 76% ± 2% and in rhIFNγ-treated cells was 76% ± 3% (500 U/mL), 76% ± 3% (1,000 U/mL), 80% ± 1% (2,500 U/mL), and 72% ± 4% (5,000 U/mL), respectively.
Dose-response effect of IFNγ on relative c-kit fluorescence. Day-5 cells were incubated with rhIFNγ (500 U/mL [A], 1,000 U/mL [B], 2,500 U/mL [C], and 5,000 U/mL [D]) for 24 hours at 37°C and then antibody was added and data were analyzed as described in the Materials and Methods. Expression of c-kit fluorescence is shown for untreated control cells (□) and control cells remaining (▪) after subtraction of data from IFNγ-treated cells. The figures in the upper right corners indicate the relative fluorescence of control cells over that of IFNγ-treated cells. ECFC purity in control cells was 76% ± 2% and in rhIFNγ-treated cells was 76% ± 3% (500 U/mL), 76% ± 3% (1,000 U/mL), 80% ± 1% (2,500 U/mL), and 72% ± 4% (5,000 U/mL), respectively.
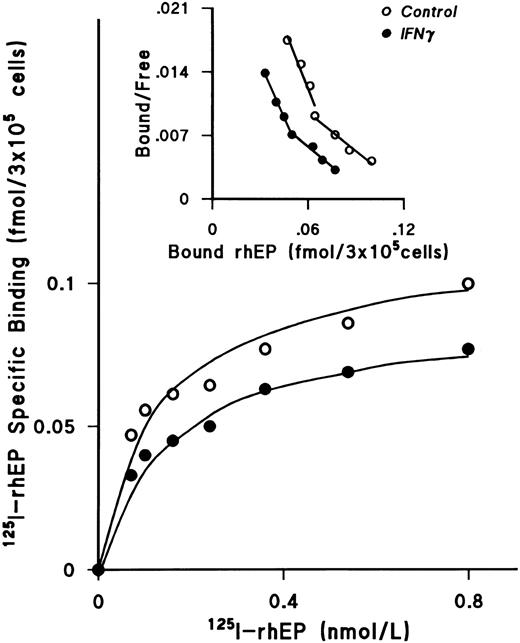
IFNγ downregulates EP receptors.When the effect of rhIFNγ on 125I-rhEP–specific binding was tested, a plateau was reached at a concentration of 0.8 nmol/L 125I-rhEP and the level of specific binding by the rhIFNγ-treated cells was also lower than that observed with the control cells (Fig 5). Scatchard analysis showed a biphasic curve with high-affinity and lower-affinity classes of EP receptors, as previously published from this laboratory.25 Three separate experiments were performed to confirm the decrease of the number of EP receptors after treatment with rhIFNγ (Table 2). Although neither kd was affected by incubation with IFNγ, the number of high-affinity receptors per ECFC was reduced by 23% and the number of lower-affinity receptors was reduced by 25%.
IFNγ downregulates 125I-rhEP–specific binding to ECFCs. Incubations were performed as described in Fig 3. The plateau level of 125I-rhEP–specific binding was reached at a concentration of 0.8 nmol/L in both groups, and the level of specific binding in the rhIFNγ group (•) was lower than in the control group (○). Scatchard analysis showed high-affinity and lower-affinity classes of EP receptors, as published previously,25 and reduction of EP receptors after rhIFNγ-treatment, but no effect on the kd. A summary of triplicate experiments is shown in Table 2. ECFC purity in this experiment was 75% ± 5% in the control group and 75% ± 6% in the rhIFNγ group.
IFNγ downregulates 125I-rhEP–specific binding to ECFCs. Incubations were performed as described in Fig 3. The plateau level of 125I-rhEP–specific binding was reached at a concentration of 0.8 nmol/L in both groups, and the level of specific binding in the rhIFNγ group (•) was lower than in the control group (○). Scatchard analysis showed high-affinity and lower-affinity classes of EP receptors, as published previously,25 and reduction of EP receptors after rhIFNγ-treatment, but no effect on the kd. A summary of triplicate experiments is shown in Table 2. ECFC purity in this experiment was 75% ± 5% in the control group and 75% ± 6% in the rhIFNγ group.
IFNγ Downregulates EP Receptors While Not Affecting kd
| Cells . | ECFC Purity . | kd . | Low-Affinity No. of Receptors . | kd . | High-Affinity No. of Receptors . | ||
|---|---|---|---|---|---|---|---|
| . | (%) . | (nmol/L) . | Per Cell . | Per ECFC . | (nmol/L) . | Per Cell . | Per ECFC . |
| Control | |||||||
| 1 | 36 ± 3 | 0.14 | 255 | 714 | 0.04 | 175 | 512 |
| 2 | 33 ± 2 | 0.28 | 314 | 952 | 0.10 | 179 | 542 |
| 3 | 75 ± 5 | 0.08 | 556 | 741 | 0.04 | 405 | 540 |
| Mean | 48 ± 19 | 0.17 ± 0.08 | 375 ± 130 | 802 ± 106 | 0.06 ± 0.03 | 253 ± 107 | 531 ± 14 |
| IFNγ | |||||||
| 1 | 34 ± 1 | 0.14 | 199 | 559 | 0.05 | 136 | 398 |
| 2 | 34 ± 3 | 0.27 | 233 | 696 | 0.10 | 136 | 406 |
| 3 | 75 ± 6 | 0.09 | 421 | 561 | 0.05 | 320 | 427 |
| Mean | 48 ± 19 | 0.17 ± 0.08 | 284 ± 98 | 605 ± 64 | 0.07 ± 0.02 | 197 ± 87 | 410 ± 12 |
| P value | >.70 | >.50 | .06 | .03 | >.40 | .06 | .003 |
Day-5 ECFCs were cultured as described in Table 1. The cells were then incubated with increasing concentrations of 125I-rhEP (0 to 0.8 nmol/L) for 48 hours at 0°C, and specific binding was determined. The kd and number of receptors were calculated by Scatchard analysis.
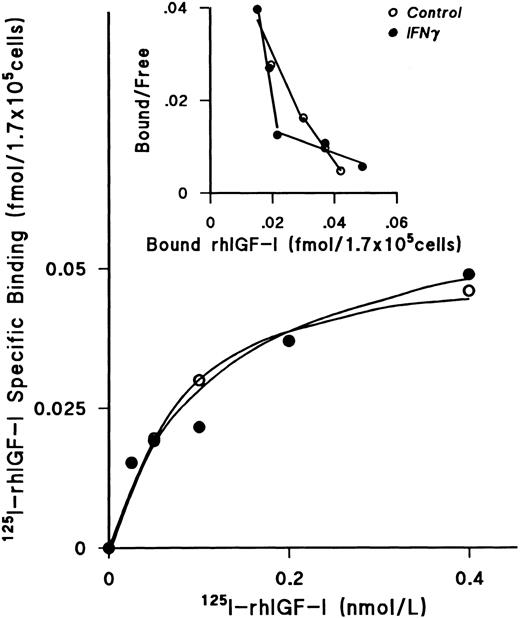
IFNγ does not downregulate IGF-I receptors or alter the kd.After incubating day-5 ECFCs with rhIFNγ for 24 hours at 37°C, increasing concentrations of 125I rhIGF-I were added to the cells for 48 hours at 0°C. These experiments showed that the plateau levels of 125I-rhIGF-I–specific binding to rhIFNγ-treated cells and to the control cells were the same (Fig 6). The Scatchard plot showed two classes of receptors, as previously published from our laboratory,26 but no significant change was seen when the rhIFNγ-treated cells were compared with the control cells. The results of three individual experiments confirmed that the kd and the receptor numbers were not affected by rhIFNγ treatment (Table 3).
Lack of effect of IFNγ on 125I-rhIGF-I–specific binding to ECFCs. The plateau level of 125I-rhIGF-I–specific binding was reached at a concentration of 0.4 nmol/L, and the level of specific binding in both the control (○) and rhIFNγ (•) groups was not significantly different. Scatchard analysis showed two classes of receptors, as previously published,26 but no significant change was observed after rhIFNγ treatment. A summary of triplicate experiments is shown in Table 3. ECFC purity in this experiment was 79% ± 4% in the control group and 76% ± 5% in the rhIFNγ group.
Lack of effect of IFNγ on 125I-rhIGF-I–specific binding to ECFCs. The plateau level of 125I-rhIGF-I–specific binding was reached at a concentration of 0.4 nmol/L, and the level of specific binding in both the control (○) and rhIFNγ (•) groups was not significantly different. Scatchard analysis showed two classes of receptors, as previously published,26 but no significant change was observed after rhIFNγ treatment. A summary of triplicate experiments is shown in Table 3. ECFC purity in this experiment was 79% ± 4% in the control group and 76% ± 5% in the rhIFNγ group.
Lack of Effect of IFNγ Treatment on Number of IGF-I Receptors and kd
| Cells . | ECFC Purity . | kd . | Low-Affinity No. of Receptors . | kd . | High-Affinity No. of Receptors . | ||
|---|---|---|---|---|---|---|---|
| . | (%) . | (nmol/L) . | Per Cell . | Per ECFC . | (nmol/L) . | Per Cell . | Per ECFC . |
| Control | |||||||
| 1 | 79 ± 4 | 0.13 | 318 | 402 | 0.037 | 216 | 273 |
| 2 | 75 ± 3 | 0.03 | 199 | 295 | 0.011 | 130 | 173 |
| 3 | 67 ± 2 | 0.15 | 399 | 600 | 0.012 | 137 | 206 |
| Mean | 74 ± 5 | 0.10 ± 0.05 | 305 ± 82 | 432 ± 126 | 0.020 ± 0.012 | 161 ± 39 | 217 ± 42 |
| IFNγ | |||||||
| 1 | 76 ± 5 | 0.20 | 358 | 471 | 0.027 | 168 | 221 |
| 2 | 74 ± 4 | 0.09 | 286 | 386 | 0.048 | 89 | 120 |
| 3 | 58 ± 3 | 0.13 | 362 | 624 | 0.019 | 155 | 267 |
| Mean | 69 ± 8 | 0.14 ± 0.04 | 335 ± 35 | 494 ± 98 | 0.031 ± 0.012 | 137 ± 35 | 202 ± 61 |
| P value | .20 | >.30 | >.45 | >.09 | >.45 | >.35 | >.70 |
Day-5 ECFCs were cultured as described in Table 1. The cells were then incubated with increasing concentrations of 125I-IGF-I (0 to 0.4 nmol/L) for 48 hours at 0°C, and specific binding was determined. The kd and number of receptors were calculated by Scatchard analysis.
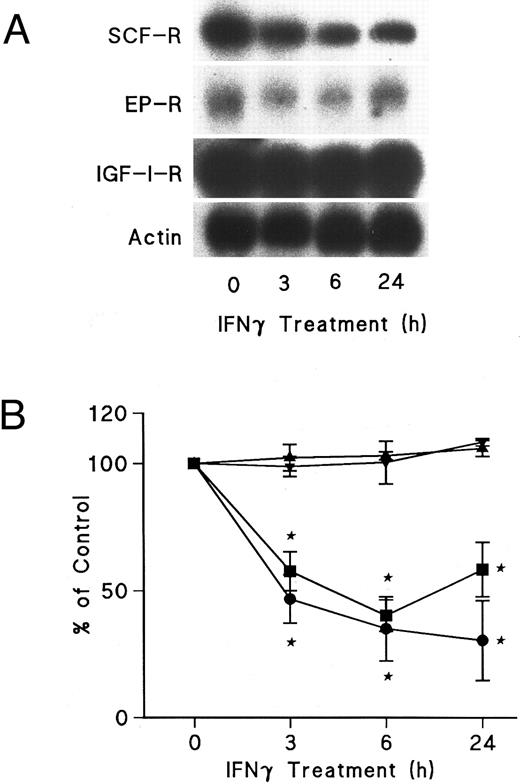
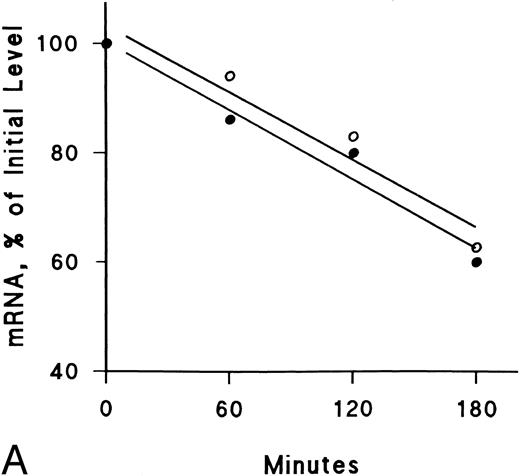
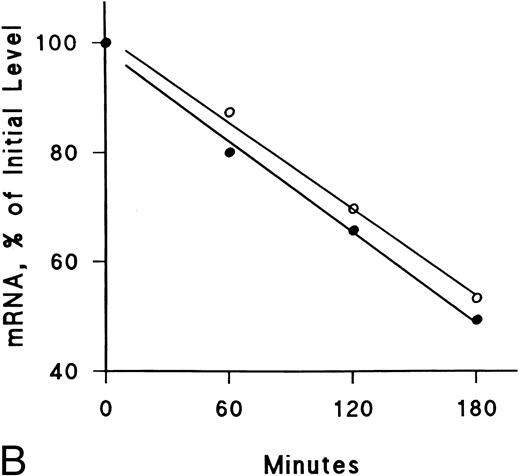
IFNγ downregulates mRNAs for SCF and EP receptors but not IGF-I receptors.Northern blot analyses were performed to determine if the mRNAs for these receptors were affected by IFNγ. The decrease of SCF and EP receptor mRNAs began as early as 3 hours after incubation at 37°C with rhIFNγ and declined by 50% to 60% at 6 hours (Fig 7). This decrease persisted for at least 24 hours. In contrast, IGF-I receptor mRNA and actin mRNA were not affected by rhIFNγ. Actinomycin D chase experiments showed no difference in the half-lives of the mRNAs for the SCF and EP receptors when the mRNAs of rhIFNγ-treated cells were compared with the mRNAs of control cells (Fig 8). The calculated half-lives of the SCF receptor mRNAs for the control and the rhIFNγ-treated cells were 4.3 hours and 4.0 hours (P > .6), respectively, and for the EP receptor mRNAs they were 3.2 hours and 2.9 hours (P > .8), respectively. These results suggest that IFNγ was most likely depressing transcription of the SCF and EP receptor mRNAs.
Effects of IFNγ on SCF, EP, and IGF-I receptor mRNA expression. Day-6 ECFCs were treated with 2,500 U/mL of IFNγ for 3, 6, and 24 hours and Northern analysis was performed with specific 32P-DNA probes for these mRNAs. (A) shows the autoradiograms of a Northern analysis indicating the level of SCF, EP, and IGF-I receptor (R) mRNA, as well as actin mRNA. (B) shows the change in the level of SCF (•), EP (▪), and IGF-I receptor (▴) mRNA and actin mRNA (▾) after densitometric scanning. Data are expressed as the percentage of actin mRNA level and means ± SD of triplicate experiments with ECFC purities of 52% ± 4%, 46% ± 2%, and 68% ± 4%.
Effects of IFNγ on SCF, EP, and IGF-I receptor mRNA expression. Day-6 ECFCs were treated with 2,500 U/mL of IFNγ for 3, 6, and 24 hours and Northern analysis was performed with specific 32P-DNA probes for these mRNAs. (A) shows the autoradiograms of a Northern analysis indicating the level of SCF, EP, and IGF-I receptor (R) mRNA, as well as actin mRNA. (B) shows the change in the level of SCF (•), EP (▪), and IGF-I receptor (▴) mRNA and actin mRNA (▾) after densitometric scanning. Data are expressed as the percentage of actin mRNA level and means ± SD of triplicate experiments with ECFC purities of 52% ± 4%, 46% ± 2%, and 68% ± 4%.
Lack of effect of IFNγ on decay of SCF and EP receptor mRNA after actinomycin D treatment. Day-6 cells were incubated with (•) or without (○) 2,500 U/mL rhIFNγ for 3 hours and then RNA synthesis was inhibited with actinomycin D (5 μg/mL). Total RNA was extracted at the indicated time periods for Northern analysis. The membrane was hybridized sequentially with SCF (A) and EP (B) receptor 32P-DNA probes, as well as a probe for actin, and densitometry was performed with correction for loading variations. The purity of control cells was 48% ± 3% and the purity of rhIFNγ-treated cells was 46% ± 2% (mean ± SD of 3 experiments).
Lack of effect of IFNγ on decay of SCF and EP receptor mRNA after actinomycin D treatment. Day-6 cells were incubated with (•) or without (○) 2,500 U/mL rhIFNγ for 3 hours and then RNA synthesis was inhibited with actinomycin D (5 μg/mL). Total RNA was extracted at the indicated time periods for Northern analysis. The membrane was hybridized sequentially with SCF (A) and EP (B) receptor 32P-DNA probes, as well as a probe for actin, and densitometry was performed with correction for loading variations. The purity of control cells was 48% ± 3% and the purity of rhIFNγ-treated cells was 46% ± 2% (mean ± SD of 3 experiments).
DISCUSSION
Modulation of cell-surface receptor expression has been widely proposed as a mechanism by which both stimulatory and inhibitory effects of cytokines are mediated.16-23 de Vos et al,16 using specific MoAb and flow cytometry, showed that TGF-β1 downregulated SCF receptors and c-kit mRNA of acute myelogenous leukemia (AML) blasts. Because transcriptional run-on assays were unaltered, they concluded that TGF-β1 was accelerating the decay of the c-kit mRNA. When murine hematopoietic progenitor cells and cell lines were treated with TGF-β1, downregulation of cell surface c-kit expression was noted by specific binding of 125I-SCF and flow cytometry with specific MoAb.17 Steady-state c-kit mRNA levels also were reduced and, through the use of actinomycin D chase experiments, this was shown to be due to a reduced half-life of the mRNA. Similar results were obtained with the human M-O7e cell line.18 Thus, the downregulation of c-kit expression by TGF-β1 was mediated by acceleration of c-kit mRNA decay. Likewise, TGF-β1 reduced c-kit mRNA in human CD34high cells, detected by in situ hybridization, and c-kit membrane receptors, detected by flow cytometry.19 TNFα also was shown by flow cytometry to downregulate SCF receptors of normal human CD34+ progenitors and AML CD34+ cells, as well as the c-kit mRNA, as shown using reverse transcription-polymerase chain reaction.20 These cytokines inhibited the growth of the above-mentioned cells and concomitantly inhibited the surface expression of the SCF receptor.
IFNγ has been shown to downregulate the murine macrophage mannose receptor (MMR) and the transcription of MMR mRNA as shown by the use of an RNAase protection assay.21 Likewise, IFNγ inhibited IL-6–dependent human myeloma cell growth and downregulated IL-6 receptor expression on the cell membrane, as shown by flow cytometry, as well as the mRNA, which was demonstrated by Northern analysis.22 Finally, Ruhl et al23 showed that IFNγ inhibited the IL-6 induction of IL-4 receptors on the surface of the murine myeloid leukemia M1 cell line, consistent with the myelosuppressive capacity of IFNγ. Northern analysis showed a parallel decrease in the IL-4 receptor mRNA, and nuclear run-on analysis indicated that this was due to suppression of transcription of the IL-4 receptor gene, similar to the effect of IFNγ on the MMR gene cited above. In this model, actinomycin D chase experiments showed no change in IL-4 mRNA stability.23
We have clearly demonstrated the downregulation of both SCF and EP membrane receptor expression by IFNγ for the first time in human erythroid progenitor cells. These receptors are necessary for their ligands to protect the ECFCs from apoptosis and to promote proliferation and differentiation.13 14 IFNγ downregulated the mRNA for both of these receptors. Because our actinomycin D chase experiments showed no difference between the control and IFNγ-treated cells for either the SCF or EP mRNAs, our experiments suggest that IFNγ suppresses this mRNA expression at the level of transcription, similar to the above-mentioned IFNγ experiments in other cells, but unlike the manner by which TGF-β1 downregulates SCF receptor expression. The fact that IGF-I surface receptor expression and the levels of IGF-I mRNA were not effected by IFNγ indicates that our observations regarding the SCF and EP receptors were not a nonspecific, generalized artifact and that IGF-I did not appear to participate in these downregulatory effects of IFNγ.
These results suggest that one means by which IFNγ inhibits erythroid progenitor cell proliferation and differentiation and produces apoptosis may be through a reduction of the number of target receptors for SCF and EP and also may explain how a higher concentration of these growth factors can overcome the inhibitory effect of IFNγ. The cells used in this study were day-5 to day-6 ECFCs, and SCF and EP receptor downregulation by IFNγ could not be shown in day-7 and later ECFCs (data not shown). These observations are consistent with previous reports from this laboratory showing that day-3 to day-6 ECFCs are most sensitive to the inhibitory effects of IFNγ.7 The capacity of IFNγ to downregulate SCF receptors at a time when biologic inhibition is evident and the lack of this capacity when biologic inhibition is greatly reduced supports the suggestion that the downregulation is involved in the inhibitory effect of IFNγ on erythroid progenitor cells. It might be thought that a 25% to 30% reduction of the level of SCF or EP surface receptors would not be enough to decrease the action of these ligands and produce inhibition of erythroid cell development. However, SCF manifests a potent synergistic action with other growth factors, including EP, to stimulate the proliferation of these cells.14 34-39 Thus, the decrease of both SCF and EP receptors would produce a synergistic decrease in the action of both ligands and a more marked reduction of the survival and growth of these cells. Furthermore, with fewer receptors present, higher concentrations of the growth factors would be needed to restore the normal probability of receptor-ligand interaction.
The affinity (kd, 0.134 nmol/L) and the number of SCF receptors (50,431 per ECFC) on day-6 ECFCs are different than those previously reported for day-8 ECFCs (kd, 0.017 nmol/L; 23,046 receptors per ECFC).27 However, net specific binding per ECFC is very similar and the differences observed may be due to the different maturation stages of these cells. With regard to the EP receptors, our laboratory has reported that the number of high-affinity binding sites per day-8 ECFC was 137 to 417, with the kd ranging from 0.04 to 0.20 nmol/L, whereas the number of lower-affinity binding sites per day-8 ECFC was 688 to 988, with the kd ranging from 0.28 to 0.57 nmol/L.25 The values for day-6 ECFCs in this study were very similar. The affinity and receptor number of day-6 ECFCs reported here for IGF-I were also not significantly different from those reported for day-8 ECFCs.26
Although our ECFCs were not 100% pure, it has previously been shown that EP and SCF do not have sufficient contaminant cell-specific binding to distort the analysis of specific binding to the ECFCs,25,27 and that the degree of inhibition did not vary significantly, as the ECFCs were purified from 19.8% to 52.6%,6 while ECFCs with a purity of 80% still showed a similar inhibition.7 IFNγ blood levels were elevated to 1,000 U/L in patients with neoplasms,8 whereas the effects shown here occured at IFNγ concentrations of 250 U/mL. However, IFNγ concentrations in the marrow, where the erythroid progenitors reside, are not known and could be considerably higher and/or more effective in the direct presence of marrow T lymphocytes and natural killer cells. Indeed, Selleri et al40 showed that stromal cells, transduced with the IFNγ gene and producing a medium concentration of approximately 20 U/mL, dramatically reduced colony formation, whereas similar, and some larger, concentrations of exogenously added IFNγ had little effect. This indicated that local factors might increase the efficiency of inhibition by smaller concentrations of IFNγ. These experiments thus indicate that the downregulation of both the SCF and the EP receptors by IFNγ very likely leads to a reduced effect of SCF and EP on erythroid progenitors and that this is one means by which IFNγ inhibits erythropoiesis, although it does not exclude other inhibitory effects of IFNγ as well.
ACKNOWLEDGMENT
The authors are grateful for the generous gifts of rhSCF and SR-1 anti–c-kit mouse MoAb from Amgen and rhEP from Ortho Biotech, Inc (Raritan, NJ). We thank Judy Luna, Ella Stitt, and Amanda Hodges for their excellent technical help and Pat Hofmann for her kind assistance with typing.
Supported by a Veterans Health Administration Merit Review Grant (S.B.K.) and by Grants No. DK-15555 (S.B.K.) and 5 T32-DK07186 (S.B.K.) from the National Institutes of Health.
Address reprint request to Sanford B. Krantz, MD, Department of Medicine/Hematology, Vanderbilt University Medical School, MRB II, Room 547, Nashville, TN 37232-6305.

![Fig. 4. Dose-response effect of IFNγ on relative c-kit fluorescence. Day-5 cells were incubated with rhIFNγ (500 U/mL [A], 1,000 U/mL [B], 2,500 U/mL [C], and 5,000 U/mL [D]) for 24 hours at 37°C and then antibody was added and data were analyzed as described in the Materials and Methods. Expression of c-kit fluorescence is shown for untreated control cells (□) and control cells remaining (▪) after subtraction of data from IFNγ-treated cells. The figures in the upper right corners indicate the relative fluorescence of control cells over that of IFNγ-treated cells. ECFC purity in control cells was 76% ± 2% and in rhIFNγ-treated cells was 76% ± 3% (500 U/mL), 76% ± 3% (1,000 U/mL), 80% ± 1% (2,500 U/mL), and 72% ± 4% (5,000 U/mL), respectively.](https://ash.silverchair-cdn.com/ash/content_public/journal/blood/90/6/10.1182_blood.v90.6.2244/3/m_bl_0025f4.jpeg?Expires=1769083694&Signature=LYFsUDpjtVb3PAjZHyxa2s-7JX4B-flAzyAx-VHGYmBWDLLb8wobtp~DCpHF7Cw88qRdKapGVPSIL4qg4NVJRciaGEuZSpRRDPyicoTDMrSnMNbvE~Bdx3rfRCZ408VcpaIRButfm5fU4Yr-3mfuvoJ~XxgfmGu1Vq0ECSDs7oOL9zYXAFeDa~uwLYzUxYAhdYHbp6TSejx7-faYFYBKPXCDjCXHW-MTbSd82MIRqjjlSOQJrNlcvSo1d9foO5vBg~WAT-g6VsJ~pdID2QA6UVf8lpl1dHVnSzBdTfnppDhWlLPHlTXsCaPOKY3HGsDqayRjpEBmJhMD7xJ~OsYm2w__&Key-Pair-Id=APKAIE5G5CRDK6RD3PGA)
This feature is available to Subscribers Only
Sign In or Create an Account Close Modal