

Key Points
We describe a multimodal approach for quantitative analysis of transcriptional and structural impacts imposed by structural variants.
Enhancer hijacking cooperates with permissive chromatin to activate oncogenic transcription in leukemic genomes.

Abstract
Structural variants (SVs) involving enhancer hijacking can rewire chromatin topologies to cause oncogene activation in human cancers, including hematologic malignancies; however, because of the lack of tools to assess their effects on gene regulation and chromatin organization, the molecular determinants for the functional output of enhancer hijacking remain poorly understood. Here, we developed a multimodal approach to integrate genome sequencing, chromosome conformation, chromatin state, and transcriptomic alteration for quantitative analysis of transcriptional effects and structural reorganization imposed by SVs in leukemic genomes. We identified known and new pathogenic SVs, including recurrent t(5;14) translocations that cause the hijacking of BCL11B enhancers for the allele-specific activation of TLX3 in a subtype of pediatric leukemia. Epigenetic perturbation of SV-hijacked BCL11B enhancers impairs TLX3 transcription, which are required for the growth of t(5;14) leukemia cells. By CRISPR engineering of patient-derived t(5;14) in isogenic leukemia cells, we uncovered a new mechanism whereby the transcriptional output of SV-induced BCL11B enhancer hijacking is dependent on the loss of DNA hypermethylation at the TLX3 promoter. Our results highlight the importance of the cooperation between genetic alteration and permissive chromatin as a critical determinant of SV-mediated oncogene activation, with implications for understanding aberrant gene transcription after epigenetic therapies in patients with leukemia. Hence, leveraging the interdependency of genetic alteration on chromatin variation may provide new opportunities to reprogram gene regulation as targeted interventions in human disease.
Introduction
Cancer arises through the disruption of transcriptional programs by both genetic and epigenetic alterations.1 Genetic alterations change the DNA sequence composition, whereas epigenetic aberrations disrupt chromatin modification and/or structure. Certain oncogenic mutations are capable of inducing chromatin state switches for transformation,2 whereas permissive chromatin also allows stochastic oncogene activation or lineage plasticity.3 How the interdependence of genetic alteration and chromatin variation functions to modulate gene expression in a cancer genome remains poorly understood.
Structural variants (SVs), which are sequence differences larger than 50 bp from the reference genomes, contribute to human disease. However, dissecting their functional impact remains difficult.4 The challenges are to distinguish SV cancer drivers from nonfunctional mutations and to elucidate the underlying mechanisms. Pathogenic SVs can disrupt genome architecture, leading to reorganized chromatin domains that affect gene regulation.5-10 In particular, “enhancer hijacking” is a common mechanism by which noncoding SVs reposition transcriptional enhancers to the vicinity of new cognate gene(s), causing rewired chromatin interactions for oncogene activation. Although this mechanism helps explain the correlation between enhancer activity and aberrant gene expression, the molecular determinants that control the functional output of enhancer hijacking remain largely unexplored.
A major hurdle is the lack of tools to identify SVs with pathogenic potential. Here, we developed a multimodal approach by combining genome sequencing, chromatin state, and sequence-based deep learning to quantitatively evaluate the transcriptional effects and structural reorganization imposed by SVs in human leukemia. Our approach revealed known and new SVs, including the recurrent t(5;14) translocations (TL) that cause the hijacking of BCL11B enhancers to activate the TLX3 proto-oncogene. Modeling t(5;14) by genome editing uncovered the interdependency of genetic alteration on permissive chromatin for enhancer hijacking–mediated gene activation in cancer genomes.
Materials and methods
Patient samples
Primary leukemia samples were collected for diagnosis and deidentified for our study. This study was approved by the institutional review board at the University of Texas Southwestern Medical Center (IRB STU 122013-023).
Cell culture
Leukemia cell lines were cultured in RPMI 1640 or Iscove modified Dulbecco medium, supplemented with 10% or 20% fetal bovine serum and 1% penicillin/streptomycin. Cells were incubated at 37°C in 5% CO2. 5-Aza-2’-deoxycytidine (5-azaD) was added to Jurkat and HuT78 cells at 5 μM for 7 days. UNC1999 was added to HEK293T cells at 5 μM for 7 days.
Whole genome sequencing
3D regulatory impact score by Orca-Leukemia
The deep learning–based 3D genome sequence model was trained by Orca14 in 3 modes using matched Hi-C and H3K27ac chromatin immunoprecipitation (ChIP)-seq data for acute myeloid leukemia (AML) (THP-1, K562, and KBM7),15 T-acute lymphoblastic leukemia (ALL) (Jurkat, early T-cell precursor (ETP), and non-ETP),16,17 and B-ALL (NALM6 and GM12878).18 The training, validation, and application of the Orca-Leukemia model are described in supplemental Methods, available on the Blood website.
Hi-C
RNA-seq, ChIP-seq, ATAC-seq, and 4C-seq
RNA extraction and quantitative reverse transcription-polymerase chain reaction (PCR) were performed as previously described.20 RNA-seq data were processed and analyzed as described21 using STAR v2.6.1b22 and DESeq2.23 Gene set enrichment analyses were conducted on Gene Set Enrichment Analysis v4.0.24 ChIP-seq was performed using antibodies for H3K27ac (Abcam #ab4729), TLX3 (Sigma #HPA030504), and MYB (Abcam #ab45150). Genomic annotation of ChIP-seq peaks was performed using HOMER v4.9.25 Enrichment analysis was performed by GREAT v4.0.4.26 Assay for transposase-accessible chromatin (ATAC)-seq was performed as previously described.20 4C-seq libraries were prepared using DpnII and Csp6I and analyzed using pipe4C.27
Bisulfite sequencing
Genomic DNA was bisulfite-converted and used for PCR with EpiMark Hot Start Taq (NEB) following the manufacturer’s protocols. PCR amplicon libraries were prepared using the NEBNext Ultra II DNA kit (NEB) and sequenced.
Competition-based cell proliferation
DND-41 cells were transduced with Renilla luciferase short hairpin RNAs (shRNAs) (shRen) or TLX3-targeting shRNAs (shTLX3) using the pLKO.1-U6-shRNA-hPGK-PuroR-IRES-TagBFP lentiviral vector. Equal numbers of shRNA-containing and untransduced DND-41 cells were mixed, and the fraction of blue fluorescent protein (BFP)-expressing cells was quantified weekly for 3 weeks.
CRISPR-based epigenetic perturbation
CRISPRi stable DND-41 cells were generated as described28 using TRE3G-dCas9-KRAB-mCherry, Tet-On-3G-rtTA-BFP, and sgRNA-2xMS2-MCP-KRAB-zsGreen1 vectors. Cells were induced with 1 μg/mL doxycycline for 72 hours, and triple-positive cells were processed for quantitative reverse transcription-PCR. For CRISPRa, HEK293T cells were transfected with dCas9-p300 (Addgene #61357) and sgRNA-2xMS2-MCP-VP64-mCherry20 using Lipofectamine 3000.
Generation of t(5;14) isogenic cells
Cells were electroporated or transfected with Cas9 and sgRNA-expressing plasmids targeting UT242-associated break points. Single-cell–derived clones harboring t(5;14) were generated by limiting dilution.
Results
SVs are enriched in noncoding leukemic genomes
We performed WGS of 38 primary leukemia samples and 12 cell lines (supplemental Figure 1A; supplemental Table 1) and identified candidate SVs using LUMPY,11 DELLY2,12 and SvABA,13 followed by filtering of known genomic polymorphisms29 (Figure 1A). SVs detected by at least 2 software programs (supplemental Figure 1B) were stratified into 4 groups, including deletions (DEL), duplications (DUP), inversions (INV), and TL. In total, we identified 4133 SVs (1-107 DEL, 4-70 DUP, 1-46 INV, and 2-95 TL per sample; Figure 1B). Across all samples, 77% DELs, 74% DUPs, 57% INVs, and 58% TLs were between 0.1 and 10 kb in size (Figure 1C). All SVs were enriched at the promoter regions, whereas DELs, INVs, and TLs were depleted within coding sequences (Figure 1D). Of note, most SVs (72%) were located within the noncoding genome (Figure 1E). The number of SVs detected per sample correlated with p53 mutation but not with other features including age, gender, leukemia subtype, and WGS coverage (supplemental Figure 1C-I).

Identification of SVs in leukemia genomes. (A) Schematic overview of the analytical pipeline to identify SVs from WGS. (B) Bar plot depicting the number of tier I SVs identified per sample. Each color within each bar represents a unique class of SV. (C) Bar plots showing the size distribution of SVs (distance between 2 break points). For TL, only intrachromosomal TL are included for analysis. (D) Bar plots showing relative enrichment or depletion of SVs within genomic region. Positive and negative log2 observed/expected ratios indicate enrichment and depletion of SVs, respectively. (E) Pie charts showing the distribution of total SVs and individual SV classes in the coding vs noncoding genome. (F) Identification of a representative t(5;14) TL by WGS and OGM in UT242. Coordinates correspond to the human hg19 genome assembly. Arrowheads indicated so-called chromosomal break points. The piled WGS paired reads supporting the detected TL are indicated on the bottom. The pink and green colored reads indicate the forward and reverse orientations, respectively. (G) Circos plots of recurrent t(5;14) in independent samples.
Identification of SVs in leukemia genomes. (A) Schematic overview of the analytical pipeline to identify SVs from WGS. (B) Bar plot depicting the number of tier I SVs identified per sample. Each color within each bar represents a unique class of SV. (C) Bar plots showing the size distribution of SVs (distance between 2 break points). For TL, only intrachromosomal TL are included for analysis. (D) Bar plots showing relative enrichment or depletion of SVs within genomic region. Positive and negative log2 observed/expected ratios indicate enrichment and depletion of SVs, respectively. (E) Pie charts showing the distribution of total SVs and individual SV classes in the coding vs noncoding genome. (F) Identification of a representative t(5;14) TL by WGS and OGM in UT242. Coordinates correspond to the human hg19 genome assembly. Arrowheads indicated so-called chromosomal break points. The piled WGS paired reads supporting the detected TL are indicated on the bottom. The pink and green colored reads indicate the forward and reverse orientations, respectively. (G) Circos plots of recurrent t(5;14) in independent samples.
A recurrent TL involving chromosomes 5 and 14, or t(5;14), was identified in 2 T-lymphoid/myeloid mixed-phenotype acute leukemia (T/MPAL) cases (UT242 and UT308) and DND-41 T-ALL cells (Figure 1F-G). To validate the genomic mapping, we performed optical genome mapping (OGM), which analyzes DNA molecules up to Mb in size30 (supplemental Figure 2A-B). Integrating OGM with WGS validated the known KMT2A-MLLT3 TL in MOLM-13 AML cells31 and GATA2-MECOM rearrangement9,32 in an inv(3) AML sample (supplemental Figure 3A-B). By combining WGS, OGM, and Sanger sequencing of break points, we identified the t(5;14) TLs as balanced, unbalanced, and complex rearrangements in UT242, DND-41, and UT308, respectively (supplemental Figure 4A-C). Together, these studies uncover candidate SVs (tier I) for further investigation (supplemental Table 2).
Identifying SVs with pathogenic potential in silico
To identify candidate pathogenic SVs, we generated multimodal measures based on the likelihood of a given SV to alter 3D genome structure and/or expression of proximal genes (Figure 2A). Specifically, to determine how SVs affect genome configuration, we adapted a deep learning approach, Orca, which predicts 3D architecture from kilobase to whole-chromosome scale in silico using only genomic sequences.14 Orca uses Hi-C–based data to model the sequence dependencies of diverse types of chromatin interactions.14 Unlike approaches requiring chromatin interaction data from SV-containing samples,7,33 Orca predicts 3D genome impact of any SVs directly from DNA sequence and thus does not require data from samples carrying those SVs.14
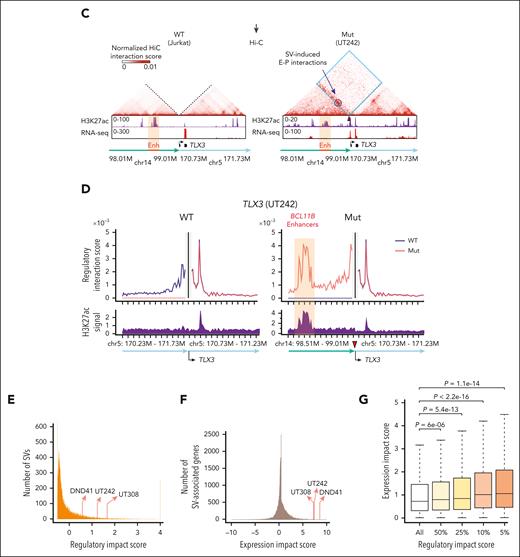
Identification of SVs with functional consequences. (A) Schematic overview of identifying tier II SVs with functional consequences. For each SV, the regulatory impact score was derived from modeling 3D genome interactions using Orca14 trained in 3 separate modes for AML, T-ALL, and B-ALL, whereas the gene expression impact score was calculated by comparing normalized RNA-seq expression values for genes within 500 kb of chromosomal break point and compared between samples containing an SV against other samples without the SV. (B) Predicted SV-induced 3D genome interactions for t(5;14) in UT242. Contact matrices for chr5 (WT) and t(5;14) TL alleles (Mut) at 4 to 32 Mb scale resolutions are shown. The 2 Mb t(5;14) contact matrices are centered on the chromosomal break point for UT242. Annotated enhancers on chr14 are denoted by red box. Predicted gain of E-P interactions are circled. (C) Hi-C contact matrices within 2 Mb window centered on the UT242 chromosomal break point. Hi-C contact map for Jurkat cells is shown as the WT control. H3K27ac ChIP-seq and RNA-seq signals for each sample are shown below. Hi-C contacts within dotted blue lines indicate ectopic interactions induced by t(5;14). (D) The predicted 3D regulatory interaction scores (y-axis) for the TLX3 promoter within a 2 Mb window (x-axis) in UT242. Black vertical lines indicate the TLX3 transcription start site. Scores for WT and SV (Mut) alleles are shown in the left and right panels, respectively. The predicted gain of interactions at the BCL11B enhancers on chr14 is shown by orange highlights. Arrowheads indicate chromosomal break points. Coordinates correspond to hg19 genome assembly. (E) Distribution of the regulatory impact scores for each SV. The rankings of t(5;14)-containing samples are indicated by arrows. (F) Distribution of the expression impact scores for SV-associated genes. (G) SV expression impact scores correlated with regulatory impact scores. Results are averaged expression impact scores for each group and were analyzed by a Student t test.
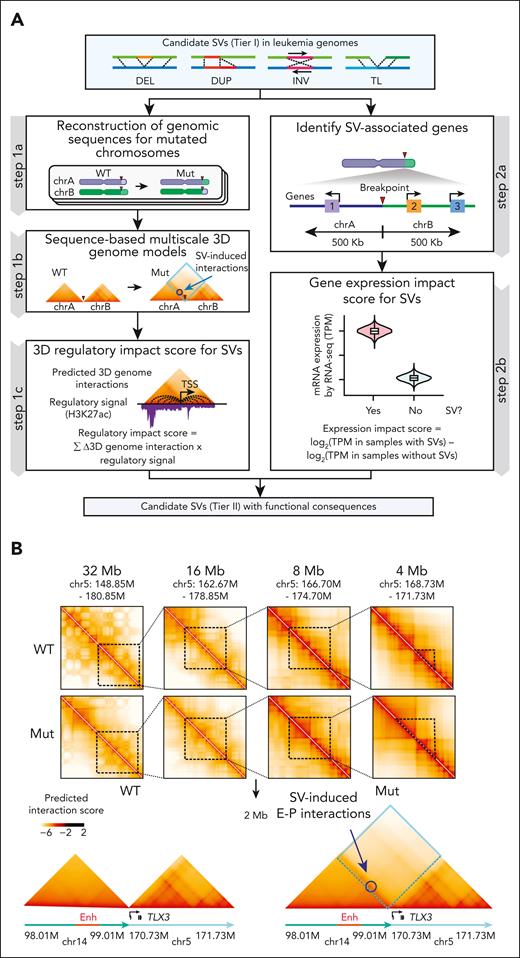
To capture sequence-based features in leukemic genomes, we trained a new model, “Orca-Leukemia,” in 3 separate modes for AML, T-ALL, and B-ALL using publicly available Hi-C and H3K27ac ChIP-seq data sets (THP1, K562, and KBM7 for AML15; Jurkat, ETP and non-ETP for T-ALL14,15; and NALM6 and GM12878 for B-ALL),18 with chromosomes 8, 9, and 10 held out for validation studies (Figure 2A; supplemental Figure 5). We next generated a “3D regulatory impact score” derived from the sum of SV-induced gain- or loss-of-interactions and the regulatory potential of corresponding interactions in each leukemia subtype (Figure 2A). By integrating leukemia-associated chromatin features, the Orca-Leukemia–computed regulatory impact scores capture SV-induced effects on genome organization. In parallel, to determine SV-induced effects on gene expression, we performed RNA-seq of all samples and derived an “expression impact score” to compute the difference in log2-transformed expression value for genes within 500kb of a break point in SV-containing (yes) vs other (no) samples (Figure 2A).
Next, we validated the Orca-Leukemia predictions using holdout chromosomes by comparing with Hi-C experimental data. We obtained Pearson’s correlation 0.949 to 0.963 for log-predicted interaction scores across holdout chromosomes (supplemental Figure 6A), indicating strong correlation between predicted and experimental interactions. Orca-Leukemia–predicted interactions displayed consistent patterns as Hi-C at representative 2 Mb genomic regions on holdout chromosomes (supplemental Figure 6B), indicating the faithful capture of cell type–specific features required for genome configuration. Finally, the leukemia-trained Orca modes validated known pathogenic SVs in AML,9,34 T-ALL,17 and B-ALL,35 respectively (supplemental Figure 7A-F). Hence, by integrating genomic sequence, conformation, H3K27ac-associated chromatin state, and transcriptomics, our multimodal approach enables quantitation and prioritization of SVs with pathogenic potential in leukemia.36
Recurrent t(5;14) causes enhancer hijacking and TLX3 activation
Among the identified SVs, recurrent t(5;14) displayed persistent alterations of genomic configuration and target gene expression. Specifically, Orca-predicted contact matrices were generated for UT242-associated wild-type (WT) and mutant (Mut) t(5;14) alleles at multiple resolution scales (Figure 2B). We observed loss of chromatin interactions for WT alleles, but significant gain of ectopic interactions between TLX3 on chr5 and H3K27ac-enriched enhancers 1.0 to 1.2 Mb downstream of BCL11B on chr14 at the t(5;14) allele (Figure 2B). By in situ Hi-C, we validated the SV-induced ectopic loops between TLX3 and H3K27ac-enriched enhancers in UT242, whereas no ectopic interaction was detected in t(5;14)-negative Jurkat cells (Figure 2C). Moreover, the samples harboring t(5;14) consistently displayed high regulatory impact scores in 2 T-lymphoid/myeloid mixed-phenotype acute leukemia (UT242 and UT308) and DND-41 cells (Figure 2D-E; supplemental Figure 8A-B).
We next ranked SVs based on the expression changes of SV-associated genes in SV-containing samples vs all other samples (Figure 2A). Strikingly, the expression impact scores for TLX3 in UT242, UT308, and DND-41 were ranked at the top 0.05%, 0.08%, and 0.01%, respectively (Figure 2F). A significant and positive correlation was observed between 3D regulatory impact scores and gene expression impact scores (Figure 2G). Together, we uncovered 164 SVs that are within the top 10% by the regulatory impact scores and associated with significant expression impact scores (P < .05; tier II, supplemental Table 3). This list includes several known and new SVs with altered genomic configuration and upregulation or downregulation of SV-associated genes (supplemental Figure 9), thus establishing a repertoire of pathogenic SVs for further interrogation.
TLX3 is activated by t(5;14)-induced enhancer hijacking
The ectopic interactions involving TLX3- and H3K27ac-enriched enhancers support a model of enhancer hijacking.5 Consistent with this notion, TLX3 is markedly upregulated in t(5;14)-containing leukemia samples relative to other samples (Figure 3A); however, the chromatin features associated with t(5;14) enhancer hijacking and the underlying mechanisms remain incompletely understood.

Enhancer hijacking activates TLX3 in t(5;14) leukemia. (A) Violin plot showing TLX3 mRNA expression in t(5;14)-containing samples vs other samples without t(5;14). (B) Genome browser tracks for ATAC-seq, H3K27ac ChIP-seq, RNA-seq, and 4C-seq for t(5;14)-positive (DND-41, UT242, and UT308) and t(5;14)-negative (Jurkat, HNT-34, and GM12878) cells. The purple arrowhead indicates the 4C-seq viewpoint. Coordinates correspond to hg19 genome assembly. Jurkat, HNT-34, and GM12878 represent negative controls for T-lymphoid, myeloid, and B-lymphoid lineages, respectively. (C) Schematic overview of CRISPRi-mediated perturbation of the BCL11B enhancers or the TLX3 transcription start site (TSS). (D) Expression of TLX3 mRNA upon CRISPRi-mediated enhancer and promoter repression in DND-41 cells normalized to GAPDH. Results are mean ± standard deviation (SD) (N = 3 biological replicates) and were analyzed by a Student t test. ∗∗P < .01, ∗∗∗∗P < .0001. (E) Schematic representation of enhancer hijacking for TLX3 activation in t(5;14) leukemia.
Enhancer hijacking activates TLX3 in t(5;14) leukemia. (A) Violin plot showing TLX3 mRNA expression in t(5;14)-containing samples vs other samples without t(5;14). (B) Genome browser tracks for ATAC-seq, H3K27ac ChIP-seq, RNA-seq, and 4C-seq for t(5;14)-positive (DND-41, UT242, and UT308) and t(5;14)-negative (Jurkat, HNT-34, and GM12878) cells. The purple arrowhead indicates the 4C-seq viewpoint. Coordinates correspond to hg19 genome assembly. Jurkat, HNT-34, and GM12878 represent negative controls for T-lymphoid, myeloid, and B-lymphoid lineages, respectively. (C) Schematic overview of CRISPRi-mediated perturbation of the BCL11B enhancers or the TLX3 transcription start site (TSS). (D) Expression of TLX3 mRNA upon CRISPRi-mediated enhancer and promoter repression in DND-41 cells normalized to GAPDH. Results are mean ± standard deviation (SD) (N = 3 biological replicates) and were analyzed by a Student t test. ∗∗P < .01, ∗∗∗∗P < .0001. (E) Schematic representation of enhancer hijacking for TLX3 activation in t(5;14) leukemia.
To this end, we performed 4C-seq using the TLX3 promoter as the viewpoint in UT242, UT308, and DND-41 and compared them with the t(5;14)-negative Jurkat T-ALL, HNT-34 AML, and B-lymphoid GM12878 cells. We further characterized chromatin landscapes by H3K27ac ChIP-seq and ATAC-seq. Consistent with Orca-Leukemia modeling and Hi-C (Figure 2B-D), TLX3 acquired ectopic interactions with H3K27ac-marked enhancers in t(5;14)-containing samples (Figure 3B). These enhancers interact with BCL11B in Jurkat and DND-41 cells by HiChIP,6 and thus are annotated as “BCL11B enhancers” in this study. To validate whether the BCL11B enhancers contribute to TLX3 activation, we performed CRISPRi using inducible dCas9-KRAB37 (Figure 3C). Compared with the nontargeting sgGal4, DND-41 cells expressing sgRNAs targeting the BCL11B enhancers (sgBCL11B-Enh) downregulated TLX3 to similar levels as cells expressing sgRNAs against the TLX3 promoter (sgTLX3-transcription start site) (Figure 3D). These results provide direct evidence that t(5;14)-induced enhancer hijacking is responsible for TLX3 activation (Figure 3E).
TLX3 activates oncogenic gene transcription in leukemia
TLX3 expression in T-lineage leukemia is associated with decreased survival and increased risk for relapse.38,39 Of note, TLX3 knockdown significantly impaired DND-41 cell growth relative to control (shRen) in competition-based proliferation assays (Figure 4A; supplemental Figure 10A). Despite its known association with T-ALL,40,41 the underlying mechanisms for TLX3-mediated transcription remain elusive. To this end, we performed ChIP-seq to identify TLX3-bound genomic regions in DND-41 (supplemental Figure 10B-C). Among the identified TLX3-binding sites (N = 15 957), 27.4% were located at gene promoters and 65.8% in promoter-distal noncoding regions (Figure 4B). RUNX1 and ETS were the top enriched motifs (Figure 4C), consistent with previous findings that TLX3 interacts with ETS1 and colocalizes with RUNX1 binding by ChIP-chip.40,42 Interestingly, the MYB motif was detected in 33.7% of TLX3-binding sites (Figure 4C).

Analysis of TLX3-dependent transcriptional programs. (A) Bar plot representation of BFP+ cells relative to starting cell culture (day 0) in DND-41 cells expressing shRNA against TLX3 (shTLX3) or Renilla luciferase (shRen). Results are mean ± SD and were analyzed by two-way analysis of variance (ANOVA). (B) Genome-wide distribution of TLX3 ChIP-seq peaks in DND-41 cells. (C) Top enriched motifs in TLX3 ChIP-seq binding sites by HOMER. (D) Heatmaps of TLX3 (blue) and MYB (green) ChIP-seq signals centered on TLX3-binding sites in DND-41 cells. Each row represents a single TLX3-binding region. (E) Venn diagram of the overlap between TLX3- and MYB-binding sites in DND-41 cells. P value was calculated by the Fisher exact test. (F) Top enriched gene ontology (GO) biological process, human phenotype, and mouse phenotype terms associated with the nearest-neighbor genes within 100 kb of TLX3 and MYB co-occupied genomic regions. The –log10(P value) was calculated using binomial test with the GREAT software. (G) Genome browser tracks for ATAC-seq and H3K27ac, TLX3, and MYB ChIP-seq in DND-41 cells for CDK6 and BCL2L1. (H) Gene set enrichment analysis of gene sets enriched in TLX3+ leukemia samples from 3 independent studies17,43,44 comparing differentially expressed genes upon TLX3-depletion in DND-41 cells (N = 2 replicate RNA-seq) or TLX3 overexpression (TLX3-OE) in Jurkat cells (N = 3 replicate RNA-seq).
Analysis of TLX3-dependent transcriptional programs. (A) Bar plot representation of BFP+ cells relative to starting cell culture (day 0) in DND-41 cells expressing shRNA against TLX3 (shTLX3) or Renilla luciferase (shRen). Results are mean ± SD and were analyzed by two-way analysis of variance (ANOVA). (B) Genome-wide distribution of TLX3 ChIP-seq peaks in DND-41 cells. (C) Top enriched motifs in TLX3 ChIP-seq binding sites by HOMER. (D) Heatmaps of TLX3 (blue) and MYB (green) ChIP-seq signals centered on TLX3-binding sites in DND-41 cells. Each row represents a single TLX3-binding region. (E) Venn diagram of the overlap between TLX3- and MYB-binding sites in DND-41 cells. P value was calculated by the Fisher exact test. (F) Top enriched gene ontology (GO) biological process, human phenotype, and mouse phenotype terms associated with the nearest-neighbor genes within 100 kb of TLX3 and MYB co-occupied genomic regions. The –log10(P value) was calculated using binomial test with the GREAT software. (G) Genome browser tracks for ATAC-seq and H3K27ac, TLX3, and MYB ChIP-seq in DND-41 cells for CDK6 and BCL2L1. (H) Gene set enrichment analysis of gene sets enriched in TLX3+ leukemia samples from 3 independent studies17,43,44 comparing differentially expressed genes upon TLX3-depletion in DND-41 cells (N = 2 replicate RNA-seq) or TLX3 overexpression (TLX3-OE) in Jurkat cells (N = 3 replicate RNA-seq).
The oncogenic function of MYB has been implicated in multiple leukemia subtypes,32,45 but its association with TLX3 in the context of TLX3+ leukemia has not been explored. We performed MYB ChIP-seq and observed pervasive TLX3 and MYB co-occupancy (84.6% of TLX3-binding sites) in DND-41 (Figure 4D-E). Genes associated with TLX3 and MYB binding were associated with the regulation of immune system processes, response to stress, cell cycle, and abnormalities of blood and lymphocytes (Figure 4F). We validated TLX3 and MYB enrichment at individual loci, including CDK6 and BCL2L1 (Figure 4G). Interestingly, we also noted TLX3 and MYB co-occupancy at BCL11B, TLX3, and MYB loci (supplemental Figure 10D-G), indicating a possible feed-forward regulatory circuit imposed by oncogenic TLX3 in t(5;14) leukemia.
To further elucidate TLX3-dependent programs, we performed RNA-seq with TLX3 depletion in DND-41 and TLX3 overexpression in TLX3-negative Jurkat cells (supplemental Figure 10H; supplemental Table 4). By gene set enrichment analysis comparing TLX3 depletion or overexpression-induced changes with TLX3-associated gene signatures from T-ALL cohorts,17,43,44 we observed reciprocal profiles such that genes enriched in TLX3+ leukemia were depleted in TLX3 knockdown DND-41 cells but enriched in TLX3-overexpressing Jurkat cells (Figure 4H). Altogether, these findings demonstrate that TLX3 is required and sufficient for oncogenic transcription in TLX3+ leukemia.
Engineered t(5;14) induces enhancer-promoter looping but not TLX3 activation
To determine whether t(5;14) is responsible for enhancer hijacking and TLX3 activation, we established isogenic cells. Jurkat cells do not express TLX3 (Figure 3B), but display comparable BCL11B expression and enhancer features as DND-41 cells (supplemental Figure 11A-B). Given the balanced TL in UT242, we engineered t(5;14) in Jurkat cells by sgRNAs targeting the UT242-associated break points on chr5 and chr14, respectively (Figure 5A). We generated a single-cell–derived clonal line harboring t(5;14), JurkatSV, which displayed a similar growth rate and karyotype as JurkatWT cells (supplemental Figure 11C-H). By DNA fluorescence in situ hybridization with probes targeting chr5 and chr14 in JurkatWT and JurkatSV cells, together with DND-41 as the positive control, we validated a single copy t(5;14) in JurkatSV but not JurkatWT cells (Figure 5B).

Engineered t(5;14) is not sufficient for TLX3 activation. (A) Schematic overview of the experimental strategy for CRISPR-mediated genome editing to generate t(5;14) isogenic Jurkat cells using UT242-associated chromosomal break points. JurkatWT indicates parental cell line, whereas JurkatSV indicates t(5;14)-edited clonal cell line. (B) Detection of t(5;14) in DND-41 and Jurkat cells by DNA FISH on metaphase chromosomes. Dotted boxes and arrows mark t(5;14) alleles. (C) Expression of BCL11B and TLX3 mRNA in parental and edited Jurkat cells normalized to GAPDH. Results are mean ± SD (N = 6 biological replicates) and analyzed by a Student t test. ∗∗∗P < .001, ∗∗∗∗P < .0001, n.s. not significant. (D) Genome browser tracks for chr5 and chr14 showing ATAC-seq and 4C-seq in parental and edited Jurkat cells. Coordinates correspond to hg19 genome assembly. The purple arrowhead indicates the 4C-seq viewpoint.
Engineered t(5;14) is not sufficient for TLX3 activation. (A) Schematic overview of the experimental strategy for CRISPR-mediated genome editing to generate t(5;14) isogenic Jurkat cells using UT242-associated chromosomal break points. JurkatWT indicates parental cell line, whereas JurkatSV indicates t(5;14)-edited clonal cell line. (B) Detection of t(5;14) in DND-41 and Jurkat cells by DNA FISH on metaphase chromosomes. Dotted boxes and arrows mark t(5;14) alleles. (C) Expression of BCL11B and TLX3 mRNA in parental and edited Jurkat cells normalized to GAPDH. Results are mean ± SD (N = 6 biological replicates) and analyzed by a Student t test. ∗∗∗P < .001, ∗∗∗∗P < .0001, n.s. not significant. (D) Genome browser tracks for chr5 and chr14 showing ATAC-seq and 4C-seq in parental and edited Jurkat cells. Coordinates correspond to hg19 genome assembly. The purple arrowhead indicates the 4C-seq viewpoint.
BCL11B expression was reduced by 2.1-fold in JurkatSV relative to JurkatWT cells, together with decreased chromatin accessibility at the BCL11B locus (Figure 5C-D). Surprisingly, TLX3 expression remained unchanged in JurkatSV cells in contrast to DND-41 and UT242 harboring endogenous t(5;14) (Figure 5C). Of note, significant gain of enhancer-promoter interactions between the TLX3 promoter and BCL11B enhancers was detected by 4C-seq in JurkatSV but not JurkatWT cells (Figure 5D). The pattern of ectopic enhancer-promoter looping resembles that of UT242 (Figure 3B). Hence, engineering of patient-derived t(5;14) enables de novo formation of enhancer-promoter looping but is not sufficient for TLX3 activation in Jurkat cells.
Allele-specific regulation of TLX3 in t(5;14)
The lack of TLX3 activation despite the de novo formation of SV-induced enhancer-promoter looping raises questions about the underlying mechanisms. We first noted strong correlations between DNA methylation and TLX3 expression by surveying reduced representation bisulfite sequencing (RRBS) profiles46 in TLX3-expressing and nonexpressing cells (supplemental Figure 12A). The TLX3 locus also harbors a 4693 bp CpG island containing its promoter. DNA methylation serves as a repressive epigenetic modification47,48; however, whether DNA methylation at TLX3 contributes to t(5;14)-mediated oncogenic transcription has not been investigated. By RRBS, we noted that the TLX3 promoter was hypermethylated in Jurkat cells with an average methylation level of 86.4%, whereas the TLX3-expressing UT242, UT308, and DND-41 cells displayed lower methylation levels of 48.4%, 44.1%, and 43.9%, respectively (Figure 6A).

Allele-specific regulation of TLX3 by enhancer hijacking. (A) Violin plot with median and quartiles showing CpG methylation at the TLX3 promoter in t(5;14)-negative Jurkat and t(5;14)-positive (UT242, UT308, and DND-41) cells. (B) Schematic of single nucleotide polymorphism (SNP) rs138378198 identified by WGS in UT242, located 318 bp upstream of the TLX3 transcription start site. The reference (Ref) C and alternative (Alt) G allele sequences are indicated, allowing for allelic interrogation of DNA methylation and gene expression. (C) Schematic of SNP rs918472 identified by WGS in patient UT308 and DND-41 at the 3’UTR of TLX3. The reference (Ref) G and alternative (Alt) A allele sequences are indicated, allowing for interrogation of allele-specific TLX3 expression. (D) Bar plot representation of composite CpG methylation calculated from bisulfite sequencing reads mapped to Ref or Alt allele. (E) Genome browser track with nucleotide alignment coverage scores of bisulfite sequencing data in UT242. The nucleotide sequences within the 56 bp region of the TLX3 promoter are shown with SNP rs138378198 indicated as red diamonds. Chromosomal coordinates correspond to hg19 genome assembly. Nucleotide sequence color represents IGV genome browser viewer track color scheme. A, green; C, blue; G, brown; and T, red. Dashed boxes indicate CpG dinucleotides. Gray coverage bars underlying a given nucleotide denote correct alignment matches. The presence and relative proportion of coloration within these bars indicate which mismatched nucleotide is detected for a given position and the depth of sequencing reads carrying the mismatch, respectively. For bisulfite sequencing, an unmethylated C (blue) converted to T (red) is represented as red coloration underlying C bases, whereas methylated C are not converted. (F) Genome browser track with nucleotide alignment coverage scores and underlying raw reads of RNA-seq data in UT242. The nucleotide sequences within a 38 bp region of the TLX3 promoter are shown with SNP rs138378198 indicated as a red diamond. Chromosomal coordinates correspond to hg19 genome assembly. (G) Bar plot representation of the proportion of UT242 RNA-seq reads aligning to Ref or Alt allele. (H) Bar plot representation of the proportion of UT308 RNA-seq reads aligning to Ref or Alt allele. (I) Genome browser track with nucleotide alignment coverage scores and underlying raw reads of RNA-seq data in UT308. The nucleotide sequences within a 40 bp region of the TLX3 3’UTR are shown with SNP rs918472 indicated as a red diamond. Chromosomal coordinates correspond to hg19 genome assembly. (J) Bar plot representation of the proportion of DND-41 RNA-seq reads aligning to Ref or Alt allele. (K) Genome browser track with nucleotide alignment coverage scores and underlying raw reads of RNA-seq data in DND-41. The nucleotide sequences within a 40 bp region of the TLX3 3’UTR are shown with SNP rs918472 indicated as a red diamond.
Allele-specific regulation of TLX3 by enhancer hijacking. (A) Violin plot with median and quartiles showing CpG methylation at the TLX3 promoter in t(5;14)-negative Jurkat and t(5;14)-positive (UT242, UT308, and DND-41) cells. (B) Schematic of single nucleotide polymorphism (SNP) rs138378198 identified by WGS in UT242, located 318 bp upstream of the TLX3 transcription start site. The reference (Ref) C and alternative (Alt) G allele sequences are indicated, allowing for allelic interrogation of DNA methylation and gene expression. (C) Schematic of SNP rs918472 identified by WGS in patient UT308 and DND-41 at the 3’UTR of TLX3. The reference (Ref) G and alternative (Alt) A allele sequences are indicated, allowing for interrogation of allele-specific TLX3 expression. (D) Bar plot representation of composite CpG methylation calculated from bisulfite sequencing reads mapped to Ref or Alt allele. (E) Genome browser track with nucleotide alignment coverage scores of bisulfite sequencing data in UT242. The nucleotide sequences within the 56 bp region of the TLX3 promoter are shown with SNP rs138378198 indicated as red diamonds. Chromosomal coordinates correspond to hg19 genome assembly. Nucleotide sequence color represents IGV genome browser viewer track color scheme. A, green; C, blue; G, brown; and T, red. Dashed boxes indicate CpG dinucleotides. Gray coverage bars underlying a given nucleotide denote correct alignment matches. The presence and relative proportion of coloration within these bars indicate which mismatched nucleotide is detected for a given position and the depth of sequencing reads carrying the mismatch, respectively. For bisulfite sequencing, an unmethylated C (blue) converted to T (red) is represented as red coloration underlying C bases, whereas methylated C are not converted. (F) Genome browser track with nucleotide alignment coverage scores and underlying raw reads of RNA-seq data in UT242. The nucleotide sequences within a 38 bp region of the TLX3 promoter are shown with SNP rs138378198 indicated as a red diamond. Chromosomal coordinates correspond to hg19 genome assembly. (G) Bar plot representation of the proportion of UT242 RNA-seq reads aligning to Ref or Alt allele. (H) Bar plot representation of the proportion of UT308 RNA-seq reads aligning to Ref or Alt allele. (I) Genome browser track with nucleotide alignment coverage scores and underlying raw reads of RNA-seq data in UT308. The nucleotide sequences within a 40 bp region of the TLX3 3’UTR are shown with SNP rs918472 indicated as a red diamond. Chromosomal coordinates correspond to hg19 genome assembly. (J) Bar plot representation of the proportion of DND-41 RNA-seq reads aligning to Ref or Alt allele. (K) Genome browser track with nucleotide alignment coverage scores and underlying raw reads of RNA-seq data in DND-41. The nucleotide sequences within a 40 bp region of the TLX3 3’UTR are shown with SNP rs918472 indicated as a red diamond.
We then examined whether allele-specific regulation accounts for the intermediate levels of DNA methylation at TLX3 in t(5;14) samples. By WGS, we detected a single nucleotide polymorphism located 318 bp upstream of the TLX3 transcription start site in UT242 cells (Figure 6B). UT308 and DND-41 instead harbor a single nucleotide polymorphism at the 3’UTR (Figure 6C). By bisulfite sequencing of UT242 genomic DNA, we observed an allelic imbalance such that the reference C allele displayed 93.7% CpG methylation, whereas the alternative G allele displayed 3.2% CpG methylation at the TLX3 promoter (Figure 6D-E). Moreover, RNA-seq revealed reads harboring only the unmethylated G allele in UT242, suggesting that allele-specific DNA methylation contributes to allele-specific TLX3 expression (Figure 6F-G). Similar analyses also revealed allele-specific TLX3 expression in UT308 and DND-41 (Figure 6H-K). These results demonstrate a strong association between t(5;14)-mediated enhancer hijacking and allele-specific TLX3 activation.
Enhancer hijacking cooperates with loss of DNA methylation for TLX3 activation
DNA methylation is regulated by DNA methyltransferases, whose activity can be disrupted by hypomethylating agents, including 5-azaD.49 To determine whether the functional output of engineered t(5;14) is dependent on the epigenetic state of TLX3, we treated JurkatWT and JurkatSV cells with 5-azaD (Figure 7A; supplemental Tables 5 and 6). Strikingly, TLX3 was markedly upregulated in JurkatSV but not JurkatWT cells (Figure 7B). By RNA-seq, TLX3 was the top significantly induced gene in 5-azaD-treated JurkatSV cells relative to JurkatWT cells (Figure 7C). Although 5-azaD led to similar levels of demethylation at TLX3 and promoter hypomethylation in JurkatWT and JurkatSV (Figure 7D-E), TLX3 is only induced in JurkatSV cells harboring the engineered t(5;14). 5-azaD treatment had no effect on enhancer-promoter interactions between the hijacked enhancers and the TLX3 promoter (supplemental Figure 12B-C).

DNA methylation is an epigenetic barrier to enhancer hijacking. (A) Experimental strategy for 5-azaD–mediated DNA demethylation. (B) Expression of TLX3 mRNA following 5-azaD treatment in JurkatWT and JurkatSV cells normalized to GAPDH. Results are mean ± SD (N = 3 biological replicates) and analyzed by two-way ANOVA with Dunnett multiple comparison test. Fold changes and P values represent comparisons between dimethyl sulfoxide (DMSO) and 5-azaD treatment in JurkatSV cells. ∗P < .05, ∗∗P < .01. (C) Volcano plot of gene expression changes upon 5-azaD treatment in JurkatWT and JurkatSV cells (N = 3 biological replicates). Red dots indicate genes displaying log2 (fold change) ≥1.5 and an adjusted P value <1 × 10⁻⁶. (D) CpG methylation changes at the TLX3 promoter upon 5-azaD treatment in JurkatWT and JurkatSV cells. Average methylation levels were derived from 2 independent biological replicates. Differential methylation analysis was performed by the Fisher exact test. (E) Scatterplot of global methylation changes for all gene promoters in JurkatWT and JurkatSV cells and analyzed by Pearson correlation. Results are averaged methylation differences between 5-azaD and DMSO treatment from 2 replicate RRBS experiments. (F) Boxplots showing the mRNA expression changes of SV-associated genes (N) in SV-containing sample (yes) vs all other samples that do not contain the corresponding SVs (No) for 5 patients with CMML. The overview of treatment and experimental scheme is shown on the left. Boxes show median of the data and quartiles, and whiskers extend up to 1.5× of the interquartile range. P values were calculated by a one-sided paired t test. (G) Model for the cooperation between 3D genome organization and the epigenetic state of target genes as the molecular determinant of enhancer hijacking–mediated oncogenic transcription.
DNA methylation is an epigenetic barrier to enhancer hijacking. (A) Experimental strategy for 5-azaD–mediated DNA demethylation. (B) Expression of TLX3 mRNA following 5-azaD treatment in JurkatWT and JurkatSV cells normalized to GAPDH. Results are mean ± SD (N = 3 biological replicates) and analyzed by two-way ANOVA with Dunnett multiple comparison test. Fold changes and P values represent comparisons between dimethyl sulfoxide (DMSO) and 5-azaD treatment in JurkatSV cells. ∗P < .05, ∗∗P < .01. (C) Volcano plot of gene expression changes upon 5-azaD treatment in JurkatWT and JurkatSV cells (N = 3 biological replicates). Red dots indicate genes displaying log2 (fold change) ≥1.5 and an adjusted P value <1 × 10⁻⁶. (D) CpG methylation changes at the TLX3 promoter upon 5-azaD treatment in JurkatWT and JurkatSV cells. Average methylation levels were derived from 2 independent biological replicates. Differential methylation analysis was performed by the Fisher exact test. (E) Scatterplot of global methylation changes for all gene promoters in JurkatWT and JurkatSV cells and analyzed by Pearson correlation. Results are averaged methylation differences between 5-azaD and DMSO treatment from 2 replicate RRBS experiments. (F) Boxplots showing the mRNA expression changes of SV-associated genes (N) in SV-containing sample (yes) vs all other samples that do not contain the corresponding SVs (No) for 5 patients with CMML. The overview of treatment and experimental scheme is shown on the left. Boxes show median of the data and quartiles, and whiskers extend up to 1.5× of the interquartile range. P values were calculated by a one-sided paired t test. (G) Model for the cooperation between 3D genome organization and the epigenetic state of target genes as the molecular determinant of enhancer hijacking–mediated oncogenic transcription.
To examine whether these effects are constrained only to Jurkat T-ALL cells, we engineered t(5;14) in 2 non-T-ALL cell types (supplemental Figure 13A). HuT78, a CD4+ cutaneous T-cell lymphoma line derived from a patient with Sézary syndrome, contains DNA hypermethylation at the TLX3 promoter and active BCL11B enhancers similar to Jurkat cells (supplemental Figure 13B-C). Engineering t(5;14) (supplemental Figure 13D) resulted in a 1.6-fold increase of TLX3 expression in HuT78SV cells (supplemental Figure 14A). To determine the effects of DNA demethylation in this context, HuT78WT and HuT78SV cells were treated with 5-azaD, which led to marked TLX3 upregulation (21.6-fold) in HuT78SV but not HuT78WT cells (supplemental Figure 14B-C). Therefore, t(5;14)-mediated enhancer hijacking cooperates with loss of DNA methylation to activate TLX3 in both JurkatSV and HuT78SV cells.
We performed similar experiments in HEK293T cells, which displayed low DNA methylation at TLX3 but inactive BCL11B enhancers (supplemental Figure 13B-C). Engineering t(5;14) had no effect on TLX3 expression in single-cell–derived HET293TSV cells (supplemental Figure 14D). CRISPRa37 using BCL11B enhancer-targeting sgRNA (sgBCL11B-Enh) also did not activate TLX3 in contrast to TLX3 promoter-targeting sgRNA (sgTLX3-transcription start site, positive control) in HEK293TSV cells (supplemental Figure 14E-F). Importantly, the BCL11B locus, including its enhancers, harbors extensive H3K27me3, a PRC2-catalyzed repressive mark, in HEK293T cells (supplemental Figure 14G). Treating HEK293TSV cells with EZH1/2 inhibitor UNC1999 for 1 week before BCL11B enhancer-targeting CRISPRa significantly induced TLX3 expression (6.9-fold) relative to the nontargeting sgGal4 (supplemental Figure 14H). These findings further demonstrate the cooperation between enhancer hijacking and permissive chromatin at the hijacked enhancers and/or target gene(s) for oncogene activation.
To evaluate the relevance of the interdependency of enhancer hijacking on permissive chromatin for TLX3 activation in T-ALL pathogenesis, we surveyed the chromatin landscapes of BCL11B and TLX3 in CD34+ hematopoietic stem/progenitor cells (HSPCs) and T-cell differentiation stages (supplemental Figure 15A).50BCL11B enhancers displayed chromatin accessibility and H3K27ac from immature CD34+CD1- T-cell precursors to mature αβ T cells with concomitant BCL11B expression (supplemental Figure 15B-C). By contrast, TLX3 expression was undetectable during T-cell development but displayed chromatin accessibility from HSPCs to ISP CD28+ post–β selection thymocytes.51 Thus, both BCL11B and TLX3 are associated with permissive chromatin during early T-cell differentiation, which may facilitate t(5;14)-mediated TLX3 activation for oncogenic transformation. Consistent with this notion, T-ALLs arrested at the early cortical stage of thymocyte development frequently harbor TLX3 activation caused by t(5;14).52,53 Disease modeling using engineered t(5;14) in primary HSPCs, although technically challenging, will be necessary to test this possibility in T-cell leukemogenesis.
Epigenetic therapies affect SV-associated gene expression in leukemia
Hypomethylating agents are commonly used to treat hematologic malignancies, including AML, myelodysplastic syndromes, and chronic myelomonocytic leukemia (CMML),54 and exert antitumor effects through altered DNA methylation.55,56 Given our findings that SVs cooperate with epigenetics to modulate oncogene transcription, we reasoned that altered DNA methylation may contribute to SV-induced transcription in patients after epigenetic therapies.
As a proof-of-principle test, we performed WGS of CD14+ monocytic leukemia cells from 5 patients with CMML after 6 to 42 cycles of AZA or 5-azaD therapy56,57 (Figure 7F; supplemental Table 7). We identified candidate SVs and SV-associated genes in each sample following the same pipelines (supplemental Table 8). We further analyzed RNA-seq and DNA methylation in leukemia cells before and after treatment56 and identified SV-associated genes displaying loss of DNA methylation (>25%) at promoter regions. Importantly, we noted significantly increased expression of SV-associated genes in SV-containing samples (yes) compared to other samples (no) without the same SVs (Figure 7F). SV-induced gene activation after AZA/5-azaD treatment was consistently observed in all CMML cases, suggesting that SVs cooperate with altered DNA methylation to affect gene expression after epigenetic therapies in patients with leukemia.
Taken together, by developing a multimodal approach for identifying pathogenic SVs and modeling SV-induced enhancer hijacking in isogenic cells, our findings uncover a new mechanism whereby the cooperation between the rewired chromatin configuration and the epigenetic state of target genes controls SV-mediated oncogenic transcription. In particular, the formation of de novo enhancer-promoter looping is required but not sufficient for SV-mediated gene activation, whereas permissive chromatin at the juxtaposed target genes is indispensable for productive enhancer hijacking (Figure 7G). This mechanism helps explain aberrant gene expression caused by epigenetic drugs in patients with leukemia, with clinical implications for understanding the pathogenic roles of noncoding SVs in human disease and therapy outcome.
Discussion
SVs are hallmarks of cancer,4 yet the impact of SVs remains difficult to predict and/or interpret. By integrating genome sequencing, sequence-based structure modeling, epigenetic landscapes, and transcriptomics, we developed a multimodal framework and identified a repertoire of SVs associated with gene dysregulation, thus enabling future investigations of the oncogenic potential of SVs in leukemogenesis.
As the proof-of-principle validation, we focused on recurrent t(5;14) that reconfigures enhancer-promoter looping to activate the TLX3 proto-oncogene. Although t(5;14) was previously described in a subset of T-ALL, it has remained elusive how these SVs cause TLX3 activation.39,58-62 In particular, enhancer hijacking was speculated to cause TLX3 or NKX2-5 activation based on the proximity to accessible chromatin and histone marks at the BCL11B-distal sites60 or the chromatin conformation of the TLX3 locus.17 Here, we establish direct evidence that t(5;14) causes TLX3 activation through hijacking BCL11B enhancers by CRISPRi perturbation. Moreover, although BCL11B is a common SV-associated locus, prior studies focused on SVs affecting BCL11B function or expression in lineage-ambiguous stem cell leukemias.6,63 Our studies provide evidence that the hijacking of BCL11B enhancers can deregulate other proto-oncogenes, including TLX3, causing activation of oncogenic programs distinct from those of BCL11B-driven leukemias.6,63 With emerging technologies such as long-read sequencing and improved computational pipelines, we speculate that additional oncogenic drivers involving enhancer hijacking will be identified as important entities in leukemia pathophysiology.
Prior studies of enhancer hijacking have relied largely on correlative evidence.6-9,64 To establish causality, we engineered isogenic cells harboring patient-derived t(5;14) but observed no effect on TLX3 expression despite the de novo formation of enhancer-promoter looping. This finding contradicts the notion that repositioning hijacked enhancers to the proximity of gene target(s) would be sufficient for gene activation. Rather, loss of epigenetic repression at the enhancer-targeted gene promoter is indispensable for enhancer hijacking-induced transcription. Given the observed permissive chromatin at both BCL11B and TLX3 in early T-cell development, our findings support a model whereby the cooperation between genetic alterations and permissive chromatin of target genes, which may reflect the epigenetic state of tumor cell-of-origin, serves as a critical determinant of SV-mediated oncogene activation.
The relationship between DNA methylation and SVs has significant clinical implications, given the use of hypomethylating agents as cancer therapies.54 Altered epigenetics caused by hypomethylating treatments can cooperate with pre-existing or acquired SVs, some of which may involve enhancer hijacking,65 to induce more profound gene expression changes. Thus, our findings support the possibility that the pathogenic potential of SVs can be modulated by therapeutic regimes affecting epigenetics. Given the recent discovery of the demethylation and reactivation of an oncogene after hypomethylating therapy,66 it is plausible that the mechanism described herein is applicable to other contexts. Hence, it is important to investigate in future studies whether the affected genes and cellular pathways contribute to therapy outcome and/or serve as prognostic biomarkers for better stratification of patients for epigenetic therapies.
Our studies illustrate a new layer of SV-mediated gene dysregulation and highlight the importance of integrating genetic alterations with chromatin states for a more accurate assessment of the pathogenic potential of SVs. Computational approaches modeling SV-mediated chromatin reorganization may also benefit from integrating epigenetic information to predict SV pathogenicity with increased precision. Furthermore, leveraging the interdependency of genetic alteration on chromatin variation through epigenetics-modulating agents or epigenomic perturbations58,59 may compromise SV-mediated oncogenic programs, thus providing opportunities to reprogram gene regulation as targeted therapies.
Acknowledgments
The authors thank the Children’s Research Institute Sequencing Core for assistance with next-generation sequencing and other Xu laboratory members for discussion and technical support.
This work was supported by the American Heart Association Predoctoral Fellowship (827324) (G.A.B.); and grants from the Institut National du Cancer (PLBIO 2021-1-PLBIO-02-IGR-1) (E.S.), the National Cancer Institute, National Institutes of Health (NIH) (R01CA230631 and R01CA259581) (J.X), the National Institute of Allergy and Infectious Diseases, NIH (R21AI158240) (J.X.), the National Institute of Diabetes and Digestive and Kidney Diseases, NIH (R01DK111430) (J.X.), the National Institute of General Medical Sciences, NIH (DP2GM146336) (J.Z.), CPRIT grants (RP190417, RP220337, and RP220375) (J.X.) and RR190071 (J.Z.), and Welch Foundation grant (I-1942) (J.X.). J.X. is a Scholar of the Leukemia & Lymphoma Society and an American Society of Hematology Scholar.
Authorship
Contribution: G.A.B., Y.Z., K.D., J.Z., and J.X. conceptualized the study; G.A.B., Y.Z., K.D., Y.J.K., X.L., J.T.S., A.I., N.D., H.C., P.K., K.E.D., K.R.K., M.C., W.C., E.S., P.L., and J.X. performed the methods; G.A.B., K.D., Y.J.K., X.L., J.T.S, A.I., N.D., H.C., and P.K. investigated the data; G.A.B., Y.Z., and J.X. wrote the original draft; G.A.B., Y.Z., K.D., J.Z., X.L., J.T.S., P.L., E.S., and J.X. reviewed and edited the manuscript; E.S., P.L., J.Z., and J.X. acquired funding; and J.Z. and J.X supervised the project.
Conflict-of-interest disclosure: The authors declare no competing financial interests.
Correspondence: Yuannyu Zhang, Department of Pathology, Center of Excellence for Leukemia Studies, St. Jude Children’s Research Hospital, 262 Danny Thomas Place - MS 345, Memphis, TN 38105; e-mail: yuannyu.zhang@stjude.org; Jian Zhou, Lyda Hill Department of Bioinformatics, University of Texas Southwestern Medical Center, Dallas, TX 75390; e-mail: jian.zhou@utsouthwestern.edu; and Jian Xu, Department of Pathology, Center of Excellence for Leukemia Studies, St. Jude Children’s Research Hospital, 262 Danny Thomas Place - MS 345, Memphis, TN 38105; e-mail: jian.xu@stjude.org.

This feature is available to Subscribers Only
Sign In or Create an Account Close Modal