

Key Points
IL-7R/CD127 expression is frequent in T-ALL (∼70%) and aberrantly diverges from normal thymocytic development.
IL-7R/CD127 expression predicts sensitivity to JAK inhibition in T-ALL and synergism with BCL2 inhibition.

Abstract
T-cell acute lymphoblastic leukemia (T-ALL) is an aggressive hematological malignancy with a dismal prognosis related to refractory/relapsing diseases, raising the need for new targeted therapies. Activating mutations of interleukin-7–receptor pathway genes (IL-7Rp) play a proven leukemia-supportive role in T-ALL. JAK inhibitors, such as ruxolitinib, have recently demonstrated preclinical efficacy. However, prediction markers for sensitivity to JAK inhibitors are still lacking. Herein, we show that IL-7R (CD127) expression is more frequent (∼70%) than IL-7Rp mutations in T-ALL (∼30%). We compared the so-called nonexpressers (no IL-7R expression/IL-7Rp mutation), expressers (IL7R expression without IL-7Rp mutation), and mutants (IL-7Rp mutations). Integrative multiomics analysis outlined IL-7R deregulation in virtually all T-ALL subtypes, at the epigenetic level in nonexpressers, genetic level in mutants, and posttranscriptional level in expressers. Ex vivo data using primary-derived xenografts support that IL-7Rp is functional whenever the IL-7R is expressed, regardless of the IL-7Rp mutational status. Consequently, ruxolitinib impaired T-ALL survival in both expressers and mutants. Interestingly, we show that expressers displayed ectopic IL-7R expression and IL-7Rp addiction conferring a deeper sensitivity to ruxolitinib. Conversely, mutants were more sensitive to venetoclax than expressers. Overall, the combination of ruxolitinib and venetoclax resulted in synergistic effects in both groups. We illustrate the clinical relevance of this association by reporting the achievement of complete remission in 2 patients with refractory/relapsed T-ALL. This provides proof of concept for translation of this strategy into clinics as a bridge-to-transplantation therapy. IL7R expression can be used as a biomarker for sensitivity to JAK inhibition, thereby expanding the fraction of patients with T-ALL eligible for ruxolitinib up to nearly ∼70% of T-ALL cases.
Introduction
T-cell acute lymphoblastic leukemia (T-ALL) is a heterogeneous disease that results from the malignant proliferation of immature T cells blocked at varying stages of differentiation, which partially recapitulate normal lymphoid T-cell ontogeny.1 The development of intensive chemotherapy regimens has considerably improved the outcome of adult T-ALL. Yet, relapsed disease conveys a dismal prognosis with a 6-to-9 month median survival time.2-5 Therefore, it remains an essential clinical challenge, with urgent needs to identify relevant druggable targets and develop new therapeutic approaches for patients with refractory/relapsed T-ALL.
Interleukin-7–receptor pathway (IL-7Rp) plays a key role in normal T-cell development.6,7 The binding of IL-7 to IL-7R initiates the formation of a trimeric complex between the cytokine, IL-7Rα–specific chain (CD127 or IL-7R), and the common γ chain, leading to Janus kinase 1 (JAK1) and 3 (JAK3) transphosphorylation.8,9 Subsequent phosphorylation of tyrosine residues in the cytoplasmic tail of CD127/IL-7Rα creates docking sites for effector molecules, notably signal transducer and activator of transcription 5 (STAT5) and phosphatidylinositol 4,5-bisphosphate 3-kinase (PI3K).10 Phosphorylated STAT5 translocates into the nucleus, where it regulates proliferation and cell survival through the transcriptional regulation of p27kip1 and B-cell lymphoma 2 (BCL2).11,12
Somatic gain-of-function (GOF) mutations in IL-7Rα or downstream effectors (JAK1, JAK3, and STAT5B) have been reported in up to ∼30% of pediatric13 and adult14 T-ALL, promoting cell transformation in vitro and tumor formation in vivo.15,16 IL-7Rp signaling negatively regulates in vitro steroid/chemosensitivity in childhood T-ALL by rescuing leukemic cells from mitochondrial-induced apoptosis, suggesting an important role of the BCL2 family of proteins.17-19 Hence, IL-7Rp represents a relevant druggable target, notably since clinically approved pharmacological inhibitors exist, such as JAK inhibitors (JAKinibs), including ruxolitinib (JAK1/2) and tofacitinib (JAK3). A seminal study demonstrated that ruxolitinib could delay disease progression in vivo in early T-cell progenitor (ETP) ALL, a subcategory of immature T-ALL characterized by a high incidence of IL-7Rp mutations.20,21 Consistent with this, treatment with ruxolitinib sensitizes the leukemia cells to glucocorticoids.18 Another study evidenced the oncogenic role of IL-7R per se in an IL-7R–overexpressing murine model that could represent a relevant target.22 Moreover, recent reports suggested the targeting of BCL2 as an efficient strategy in ETP-ALL and identified specific phosphoproteomic signatures that could predict synergism between JAK3 inhibitors and BCL2 inhibitors, such as venetoclcax.23-25 This raised for the first time the question of the utility of dual inhibition of the JAK and BCL2 molecules in T-ALL.
Although there is a strong rationale for the use of JAK inhibitors in IL-7Rp–mutated ETP-ALL, whether this drug could benefit other T-ALL subtypes remains under debate.18,20,22 In this study, we interrogated the IL-7R pathway in T-ALL using a multilevel integrated approach to identify patients eligible for JAK inhibition. We found that the IL-7R ectopic expression is a frequent oncogenic driver in T-ALL irrespective of the IL-7Rp mutational status and predicts sensitivity to ruxolitinib. Finally, the combination of venetoclax with ruxolitinib led to synergistic effects in IL-7R–expressing T-ALL regardless of the IL-7Rp mutational status.
Methods
Patients and primary samples
Bone marrow (BM) or blood patient samples were collected after informed consent was obtained at diagnosis, in accordance with the Declaration of Helsinki and institutional guidelines. Mononuclear cells were isolated by ficoll density gradient before DNA extraction and cryopreservation. Immunophenotypic and molecular characterization of T-ALL samples were performed as previously described.26-28
Thymic subpopulations sorting
PDX generation
Patient-derived xenografts (PDXs) were generated from primary T-ALL samples as previously reported.31 Briefly, 106 viable leukemic cells were xenografted via IV retro-orbital injection into 6-week-old NSG mice. The leukemic load (FSChi/hCD7+/hCD45+ cells) was monitored weekly by flow cytometry (FC) in the peripheral blood of the mice. Animals were clinically and biologically monitored until the end point was reached or they were terminally ill, in accordance with the local ethical rules and home office license (30078-2021021814199445). BM from the tibiae/hip/femora/vertebrae was collected for subsequent ex vivo experiments. All samples used contained ≥90% blasts.
Drug testing and flow cytometric experiments
PDXs were cultured in a complete medium, supplemented with 50 ng/mL human stem cell factor, 20 ng/mL hFLT3-L, 10 ng/mL hIL-7, and 20 nM insulin (Miltenyi-Biotec, Bergisch Gladbach, Germany). Cultures were maintained at 37°C in a humidified atmosphere containing 5% CO2. PDX cells were incubated with increasing doses of ruxolitinib and/or venetoclax for 96 hours. Cell viability and proliferation were determined by FC using annexin-V-APC/propidium iodide costaining (BD-Pharmingen, San Jose, CA) and CellTrace Violet Cell Proliferation Kit (Thermo Fisher, Waltham, MA) respectively, according to the manufacturer’s instructions.
CD127 expression was evaluated by FC using a mouse antihuman CD127 BV421-conjugated antibody (clone HIL7R-M21 [RUO]) (BD Biosciences, San Francisco, CA). CD127 was considered positive whenever the percentage of positive cells was ≥20%. The gating strategy as well as phospho flow analyses is described in the supplemental Methods, available on the Blood website. Cytochrome c release experiments were performed as previously described.32 Data were analyzed using DIVA/FlowJo software (BD Biosciences).
Molecular analyses
Molecular experiments are described in the supplemental Methods.
Statistical analyses
Statistical analyses were performed using GraphPad Prism 8 software (GraphPad Software, San Diego, CA) and R. Normality tests were applied to determine whether the data sets were eligible for either parametric or nonparametric tests. Combination indexes (CI) were computed using the CompuSyn software and the Chou-Talalay method.33 Bliss scores were computed using the online software SynergyFinder.34
Results
CD127 expression is regulated posttranscriptionally during human thymopoiesis
We first evaluated the expression of IL-7R/CD127 during normal early T-cell development by FC. CD127 was expressed in the immature CD4/8-double-negative thymocytic stage and was then progressively and dramatically repressed during the cortical stage in CD4/8-double-positive cells, consistent with IL-7R signaling downregulation during β-selection.35-37 Finally, the expression reappeared at the ultimate maturation stage in CD4 and CD8 single-positive cells (SP4 and SP8) (Figure 1A). Then, we measured the transcriptional expression of IL-7R with respect to T-cell differentiation in electronically-sorted thymic subpopulations. By contrast, IL-7R transcriptional expression, as assessed by quantitative reverse transcription polymerase chain reaction (qRT-PCR) and bulk RNA sequencing (RNA-seq), did not show significant differences across the thymocyte differentiation stages (Figure 1B). Similarly, analysis of RNA-seq data from a recent work on sorted thymocytes showed little variation of IL-7R expression across T-cell differentiation stages (supplemental Figure 1).38 Altogether, these results suggest that IL-7R expression is regulated at a posttranscriptional level during thymopoiesis.

The landscape of IL-7R expression in normal and malignant thymocytes. (A) Surface IL-7Rα chain (CD127 or sIL-7R) expression was analyzed by flow-cytometry (FC) on gated thymocytic subpopulations from human thymi (n = 3), as described in “Methods.” (Left) A representative example is shown for a single thymus. (Right) For each thymus, the median fluorescence intensity (MFI) of each thymocyte subpopulation was normalized to DP CD3+ thymocytes median fluorescence intensity. The ratio of fluorescence intensity is shown for each thymocytic subpopulation. The mean and standard error of the mean are shown. (B) (Left) IL-7R expression was analyzed using quantitative reverse transcription polymerase chain reaction (qRT-PCR) on thymocytic subpopulations sorted from 2 independent human thymi. IL-7R transcript level is expressed as the percentage of ABL1 endogenous control. Means and SEM are shown. Kruskal-Wallis test with post hoc Dunn multiple comparisons. (Right) IL-7R expression was assessed using bulk RNA-seq on sorted thymic subpopulations from 1 human thymus. Normalized log2 expression values are shown. (C) IL-7R expression was analyzed in a cohort of adult T-ALL cases using qRT-PCR (n = 146) and bulk RNA-seq (n = 156) as in panel B. T-ALL were classified based on the immunophenotype. Means and SEM are shown. Kruskal-Wallis test with post hoc Dunn multiple comparisons. ∗∗P < .01. (D) CD127 (sIL-7R) expression was assessed via FC in 200 adults and 100 pediatric unselected T-ALL cases. The bar graph depicts the proportion of sIL-7R+ (orange) and sIL-7R− (gray) cases in each group. Fisher's exact test. (E) (Left) sIL-7R expression level (percentage of CD127+ blasts) for each T-ALL from the adult cohort classified based on their immunophenotype (n = 198). Means and SEM are shown. Kruskal-Wallis test with post hoc Dunn multiple comparisons. (Right) Relative proportions of sIL-7R+ and sIL7R–/low T-ALL from the adult cohort (n = 198) for each immunophenotypic subgroup. The threshold of positivity was set at 20%. χ2 test. ∗∗∗∗P < .0001. DN, double negative; DP, double positive; ISP, immature single positive; SP, single positive.
The landscape of IL-7R expression in normal and malignant thymocytes. (A) Surface IL-7Rα chain (CD127 or sIL-7R) expression was analyzed by flow-cytometry (FC) on gated thymocytic subpopulations from human thymi (n = 3), as described in “Methods.” (Left) A representative example is shown for a single thymus. (Right) For each thymus, the median fluorescence intensity (MFI) of each thymocyte subpopulation was normalized to DP CD3+ thymocytes median fluorescence intensity. The ratio of fluorescence intensity is shown for each thymocytic subpopulation. The mean and standard error of the mean are shown. (B) (Left) IL-7R expression was analyzed using quantitative reverse transcription polymerase chain reaction (qRT-PCR) on thymocytic subpopulations sorted from 2 independent human thymi. IL-7R transcript level is expressed as the percentage of ABL1 endogenous control. Means and SEM are shown. Kruskal-Wallis test with post hoc Dunn multiple comparisons. (Right) IL-7R expression was assessed using bulk RNA-seq on sorted thymic subpopulations from 1 human thymus. Normalized log2 expression values are shown. (C) IL-7R expression was analyzed in a cohort of adult T-ALL cases using qRT-PCR (n = 146) and bulk RNA-seq (n = 156) as in panel B. T-ALL were classified based on the immunophenotype. Means and SEM are shown. Kruskal-Wallis test with post hoc Dunn multiple comparisons. ∗∗P < .01. (D) CD127 (sIL-7R) expression was assessed via FC in 200 adults and 100 pediatric unselected T-ALL cases. The bar graph depicts the proportion of sIL-7R+ (orange) and sIL-7R− (gray) cases in each group. Fisher's exact test. (E) (Left) sIL-7R expression level (percentage of CD127+ blasts) for each T-ALL from the adult cohort classified based on their immunophenotype (n = 198). Means and SEM are shown. Kruskal-Wallis test with post hoc Dunn multiple comparisons. (Right) Relative proportions of sIL-7R+ and sIL7R–/low T-ALL from the adult cohort (n = 198) for each immunophenotypic subgroup. The threshold of positivity was set at 20%. χ2 test. ∗∗∗∗P < .0001. DN, double negative; DP, double positive; ISP, immature single positive; SP, single positive.
CD127 expression is frequent and follows an aberrant pattern in T-ALL
The IL-7R transcript expression remained stable, on average, across the differentiation stages of T-ALL just like normal thymocytes (Figure 1C). Only ETP-ALL showed a lower IL-7R transcript. This finding was confirmed in 2 publicly available data sets (supplemental Figure 2).21,39 To the best of our knowledge, very limited data is currently available concerning the protein expression of CD127 in T-ALL.40-42 Thus, we prospectively evaluated CD127 expression using FC in a large cohort of 200 primary diagnostic samples in adult T-ALL. Overall, CD127 was widely expressed in this series (70%; Figure 1D) and found in every immunophenotypic subtype of T-ALL (Figure 1E; supplemental Figure 3). Interestingly, the vast majority of cortical T-ALL cases (81%) expressed CD127 in sharp contrast with their physiological counterpart (Figure 1E). Conversely, CD127 expression was minimal in ETP-ALL and mature TCRαβ T-ALL, again in contrast with the physiological pattern of normal thymocytes, which normally express the receptor at these differentiation stages. (Figure 1A,E). We found a similar expression (68%; P = not significant) in a retrospective analysis of 100 pediatric T-ALL cases (Figure 1D). Altogether, we evidenced an aberrant pattern of CD127 expression compared with their physiological counterpart in T-ALL.
CD127 expression and IL-7Rp mutational status define 3 groups of T-ALL
We then analyzed the mutational status of the IL-7Rp genes (IL-7R/JAK1/JAK3/STAT5B) in the 200 T-ALL adult cases. We found that 35% of these cases harbored at least one IL-7Rp GOF mutation (supplemental Figure 4). As we found far fewer IL-7Rp mutations (∼35%) than CD127 expression (∼70%) in adult T-ALL, we integrated the data of both mutational status and CD127 expression and identified the 3 following categories of T-ALL: nonexpressers, with neither detectable CD127 expression nor IL-7Rp mutation (T-ALLIL-7R–/low); expressers, with CD127 expression without IL-7Rp mutation (T-ALLIL-7R+/WT); and mutants with mutations within the IL-7Rp (T-ALLMut), which also usually expressed CD127 in >80% of cases (Figure 2A).

CD127 expression and IL7Rp mutational status define 3 categories of T-ALL. (A) sIL-7R expression level (percentage of CD127+ blasts) for each T-ALL from the adult cohort (n = 200) classified based on the combination of sIL-7R status (positive if ≥20% blast cells) and IL7R/JAK1/JAK3/STAT5B mutational status in 3 categories (gray, T-ALLIL-7R–/low or nonexpressers; blue, T-ALLIL-7R+/WT or expressers; red, T-ALLMut or mutants). (B) (Left) Bar chart depicts the relative proportions of the 3 T-ALL categories in each immunophenotypic subgroup (n = 198). χ2test. ∗∗∗∗P < .0001. (Right) Pie charts depict the relative proportions of the different immunophenotypic subgroups for the 3 T-ALL categories. (C) (Left) Bar chart depicts the relative proportions of the 3 T-ALL categories in each oncogenetic subgroup (n = 190). χ2 test. ∗∗∗∗P < .0001. (Right) Pie charts depict the relative proportions of the different oncogenetic subgroups for the 3 T-ALL categories. None: overexpression of HOXA9, TLX1, TLX3, or SIL-TAL microdeletion were not found.
CD127 expression and IL7Rp mutational status define 3 categories of T-ALL. (A) sIL-7R expression level (percentage of CD127+ blasts) for each T-ALL from the adult cohort (n = 200) classified based on the combination of sIL-7R status (positive if ≥20% blast cells) and IL7R/JAK1/JAK3/STAT5B mutational status in 3 categories (gray, T-ALLIL-7R–/low or nonexpressers; blue, T-ALLIL-7R+/WT or expressers; red, T-ALLMut or mutants). (B) (Left) Bar chart depicts the relative proportions of the 3 T-ALL categories in each immunophenotypic subgroup (n = 198). χ2test. ∗∗∗∗P < .0001. (Right) Pie charts depict the relative proportions of the different immunophenotypic subgroups for the 3 T-ALL categories. (C) (Left) Bar chart depicts the relative proportions of the 3 T-ALL categories in each oncogenetic subgroup (n = 190). χ2 test. ∗∗∗∗P < .0001. (Right) Pie charts depict the relative proportions of the different oncogenetic subgroups for the 3 T-ALL categories. None: overexpression of HOXA9, TLX1, TLX3, or SIL-TAL microdeletion were not found.
Mutants mostly segregated along with ETP/immature and TCRγδ T-ALL, as previously described.14 Expressers were mostly represented by cortical T-ALL, whereas nonexpressers were enriched in TCRαβ T-ALL (Figure 2B). Consistent with this, mutants were enriched in HOXA9 overexpression, whereas expressers frequently overexpressed TLX1/TLX3, and nonexpressers displayed frequent SIL-TAL microdeletions (Figure 2C). Then, we compared the mutational landscape of the 3 groups. Overall, expressers and mutants were similar (supplemental Figure 5). By contrast, the T-ALLIL-7R–/low subset was enriched in PTEN alterations, whereas NOTCH1 mutations were less frequent (supplemental Figure 5). Of note, PHF6 alterations were less frequent in this subset, consistent with recent findings showing that PHF6 mutations cooperate with IL-7R.43
We questioned the stability of both expression and mutational status from diagnosis to relapse. To address this, we sequenced paired samples from diagnosis and relapse in a unique data set of 131 relapsing T-ALL cases. Overall, the IL-7Rp mutational status was retained in 91% of the cases at relapse. Interestingly, an integrative analysis of both IL-7Rp mutational status and CD127 expression revealed that CD127 expression was retained in 95% of the cases (supplemental Figure 6).
JAK1 inhibition abrogates IL-7–induced JAK/STAT-signaling in CD127-expressing T-ALL, irrespective of the IL-7Rp mutational status
To gain insight into the signaling functionality of IL-7Rp at a high resolution, we first evaluated the capacity of normal thymocytes to respond to IL-7 stimulation by measuring STAT5 Y694 phosphorylation (pSTAT5) as a readout for IL-7R signaling activation (Figure 3A). Immature and mature thymocytes, but not cortical thymocytes, phosphorylated STAT5 in response to IL-7. Consequently, CD127 expression and functional activation were closely related showing that whenever the receptor is expressed, it is functional in normal thymocytes. Furthermore, IL-7–induced STAT5 activation was fully abrogated in every thymocytic subset after exposure to ruxolitinib, a JAK1/2 inhibitor (Figure 3A).

Functional signaling and targeting of IL-7Rp in normal and malignant thymocytes. (A) Independent human thymi (n = 2) were cultured for 15 minutes in a complete medium deprived of IL-7 (basal state), supplemented with IL-7 (100 ng/mL) (IL-7), or supplemented with IL-7 and ruxolitinib (500 nM; IL-7+ruxolitinib). pSTAT5 Y694 was then assessed by FC for each condition and each subpopulation (histograms). Data are presented according to subsetting into thymocytic subpopulations. DN, double negative; DP, double positive; ISP, immature simple positive; SP, single positive. (B) sIL-7R expression (%CD127+ blasts) on PDXs (n = 46) used in the experiments. Samples are color-coded per the category of the T-ALL from which they are derived. (C) PDX cells were cultured as described for panel A before being subjected to pSTAT5 Y694 analysis by FC. Dot plots represent pSTAT5 median of fluorescence intensity for each case and each condition. Mean and SEM are represented. Friedman test with post hoc Dunn multiple comparisons. ∗P < .05; ∗∗P < .01; ∗∗∗P < .001; ∗∗∗∗P < .0001. (D) PDX cells were cultured for 24 hours in complete medium deprived of IL-7, supplemented with IL-7 (100 ng/mL), or supplemented with IL-7 and ruxolitinib (1 μM) before the RNA extraction and quantification of CISH (left) and PIM1 (right) by qRT-PCR. Mean and SEM are represented. Friedman test with post hoc Dunn multiple comparisons. ns, not significant; ∗P < .05; ∗∗P < .01; ∗∗∗P < .001; ∗∗∗∗P < .0001.
Functional signaling and targeting of IL-7Rp in normal and malignant thymocytes. (A) Independent human thymi (n = 2) were cultured for 15 minutes in a complete medium deprived of IL-7 (basal state), supplemented with IL-7 (100 ng/mL) (IL-7), or supplemented with IL-7 and ruxolitinib (500 nM; IL-7+ruxolitinib). pSTAT5 Y694 was then assessed by FC for each condition and each subpopulation (histograms). Data are presented according to subsetting into thymocytic subpopulations. DN, double negative; DP, double positive; ISP, immature simple positive; SP, single positive. (B) sIL-7R expression (%CD127+ blasts) on PDXs (n = 46) used in the experiments. Samples are color-coded per the category of the T-ALL from which they are derived. (C) PDX cells were cultured as described for panel A before being subjected to pSTAT5 Y694 analysis by FC. Dot plots represent pSTAT5 median of fluorescence intensity for each case and each condition. Mean and SEM are represented. Friedman test with post hoc Dunn multiple comparisons. ∗P < .05; ∗∗P < .01; ∗∗∗P < .001; ∗∗∗∗P < .0001. (D) PDX cells were cultured for 24 hours in complete medium deprived of IL-7, supplemented with IL-7 (100 ng/mL), or supplemented with IL-7 and ruxolitinib (1 μM) before the RNA extraction and quantification of CISH (left) and PIM1 (right) by qRT-PCR. Mean and SEM are represented. Friedman test with post hoc Dunn multiple comparisons. ns, not significant; ∗P < .05; ∗∗P < .01; ∗∗∗P < .001; ∗∗∗∗P < .0001.
We sought to determine whether this relation was preserved in the context of T-ALL. To address this, we generated 46 PDXs from mutants, expressers, and nonexpressers (Figure 3B; supplemental Figure 7). Overall, PDXs recapitulated CD127 expression and the IL-7Rp mutational pattern of the primary diagnostic T-ALL samples, thus confirming PDXs as a relevant model of the biology of the primary tumor (supplemental Tables 1-4).
As expected, nonexpressers had no constitutive phosphorylation of STAT5 at basal state, nor did they respond to IL-7 stimulation (Figure 3C; supplemental Figure 8). This was further supported by the absence of variation in the transcriptional expression of the STAT5 targets CISH and PIM1 in response to IL-7 or IL-7+ruxolitinib (Figure 3D). Conversely, mutants showed constitutive phosphorylation of STAT5 (P < .001, Mann-Whitney test), which was magnified in response to IL-7, consistent with the transcriptional increase of CISH and PIM1. Interestingly, STAT5 phosphorylation was reversed with ruxolitinib exposure, supporting that constitutive pSTAT5 signaling is JAK1 dependent and that ruxolitinib abrogates inducible and partially constitutive IL-7R signaling to bring back pSTAT5 levels close to the baseline. Noteworthy, pSTAT5 was also abrogated in 2 T-ALL cases with STAT5B mutation (supplemental Table 2; data not shown). Finally, expressers did not show any constitutive STAT5 activation as expected, but they still did respond to IL-7 ligand to a similar level as mutants, supporting functional IL-7–dependent IL-7R signaling.44 Inducible activation could be fully reversed by ruxolitinib, and the kinetics of CISH and PIM1 transcripts followed STAT5 phosphorylation. Altogether, CD127 expression predicted the functional signaling of IL-7Rp in T-ALL as in the normal T-cell counterpart, and JAK1 inhibition was able to abrogate both constitutive and inducible IL-7R signaling.
Ruxolitinib efficacy depends on CD127 expression irrespective of the IL-7Rp mutational status
We then aimed to address whether JAK inhibition by ruxolitinib could significantly affect cell survival and proliferation. Ruxolitinib had no impact on cell survival in nonexpressers, as expected. Interestingly, exposure to ruxolitinib resulted in significant apoptosis in both mutants and expressers, with even deeper sensitivity to ruxolitinib in expressers over mutants (P = .0102 for 500 nM, Mann-Whitney test; Figure 4A). It is well established that ruxolitinib sensitivity is linked to IL-7–dependent viability.45 As we cultured PDX T-ALL cells with supraphysiological IL-7 concentrations (10 ng/mL), this raised the question as to whether ruxolitinib efficacy could be influenced by local IL-7 concentrations. In 4 PDXs from expressers, we show that cell survival was dramatically impaired upon ruxolitinib irrespective of the ambient IL-7 concentration (Figure 4B). We then evaluated cell proliferation in fresh ex vivo cultured PDX cells (Figure 4C-D). As expected, nonexpressers were affected by neither IL-7 stimulation nor ruxolitinib exposure. Conversely, cell proliferation dramatically decreased in both mutants and expressers (Figure 4C-D; supplemental Figure 9), supporting the cytostatic effects of ruxolitinib in all groups except nonexpressers. Of interest, cytostatic effects were still observed in T-ALL cases with mild ruxolitinib–induced cytotoxicity (supplemental Figure 9C-D). Overall, our data support that sensitivity to ruxolitinib is not exclusive to mutants and reaches CD127-expressing T-ALL irrespective of their IL-7Rp mutational status.
![Ruxolitinib induces apoptosis and cytostatic effects in IL-7R+ T-ALL, irrespective of the IL-7R pathway mutational status. (A) PDX cells were cultured for 96 hours in the presence of rising concentrations of ruxolitinib. Cell viability was assessed on day 4 by FC (annexin V/propidium iodide [PI] staining). (Left) Viability curves. Results are expressed as the percentage of cell survival normalized to a dimethyl sulfoxide (DMSO)-treated condition (control). (Right) histograms depict cell survival for each category in presence of ruxolitinib (1 μM). Means and SEM are represented. Mann-Whitney test. ∗P < .05; ∗∗∗P < .001; ∗∗∗∗P < .0001. (B) PDX cells from 4 T-ALLIL7R+/WT were cultured in complete medium deprived of IL-7 (green) or supplemented with increasing concentrations of IL-7 (orange, 1 ng/mL; red, 5 ng/mL; and purple, 10 ng/mL). For each condition, cells were exposed to increasing concentrations of ruxolitinib, and cell viability was assessed as in panel A after 72 hours of culture. (Top) Bars depict raw viability (mean with standard deviation) for control-treated conditions (DMSO). (Bottom) Cell viability was normalized for each condition to the corresponding control-treated condition. Results are shown as mean with SD for each ruxolitinib concentration. (C) PDX cells derived from 1 T-ALLIL-7R–/low, 1 T-ALLMut, and 2 T-ALLIL7R+/WT were stained with CellTrace Violet cell proliferation kit and cultured in medium supplemented with IL-7 (black histograms), with IL-7 and ruxolitinib 1 μM (yellow-filled histograms), or without IL-7 (pink-filled histograms). On day 7, cells were analyzed using FC to assess cell generations from living cells. (D) Bar plot depicts the relative proportions of cell generations among living cells for 2 T-ALLIL7R−/low, 2 T-ALLMut, and 2 T-ALLIL7R+/WT following the same experimental procedure as in panel C. Note that the cell viability is affected by the absence of IL-7 or the presence of ruxolitinib in T-ALLMut and T-ALLIL7R+/WT in contrast to T-ALLIL7R−/low.](/view-large/figure/11756697/BLOOD_BLD-2022-017948-gr4.jpg)
Ruxolitinib induces apoptosis and cytostatic effects in IL-7R+ T-ALL, irrespective of the IL-7R pathway mutational status. (A) PDX cells were cultured for 96 hours in the presence of rising concentrations of ruxolitinib. Cell viability was assessed on day 4 by FC (annexin V/propidium iodide [PI] staining). (Left) Viability curves. Results are expressed as the percentage of cell survival normalized to a dimethyl sulfoxide (DMSO)-treated condition (control). (Right) histograms depict cell survival for each category in presence of ruxolitinib (1 μM). Means and SEM are represented. Mann-Whitney test. ∗P < .05; ∗∗∗P < .001; ∗∗∗∗P < .0001. (B) PDX cells from 4 T-ALLIL7R+/WT were cultured in complete medium deprived of IL-7 (green) or supplemented with increasing concentrations of IL-7 (orange, 1 ng/mL; red, 5 ng/mL; and purple, 10 ng/mL). For each condition, cells were exposed to increasing concentrations of ruxolitinib, and cell viability was assessed as in panel A after 72 hours of culture. (Top) Bars depict raw viability (mean with standard deviation) for control-treated conditions (DMSO). (Bottom) Cell viability was normalized for each condition to the corresponding control-treated condition. Results are shown as mean with SD for each ruxolitinib concentration. (C) PDX cells derived from 1 T-ALLIL-7R–/low, 1 T-ALLMut, and 2 T-ALLIL7R+/WT were stained with CellTrace Violet cell proliferation kit and cultured in medium supplemented with IL-7 (black histograms), with IL-7 and ruxolitinib 1 μM (yellow-filled histograms), or without IL-7 (pink-filled histograms). On day 7, cells were analyzed using FC to assess cell generations from living cells. (D) Bar plot depicts the relative proportions of cell generations among living cells for 2 T-ALLIL7R−/low, 2 T-ALLMut, and 2 T-ALLIL7R+/WT following the same experimental procedure as in panel C. Note that the cell viability is affected by the absence of IL-7 or the presence of ruxolitinib in T-ALLMut and T-ALLIL7R+/WT in contrast to T-ALLIL7R−/low.
Ruxolitinib induces apoptosis and cytostatic effects in IL-7R+ T-ALL, irrespective of the IL-7R pathway mutational status. (A) PDX cells were cultured for 96 hours in the presence of rising concentrations of ruxolitinib. Cell viability was assessed on day 4 by FC (annexin V/propidium iodide [PI] staining). (Left) Viability curves. Results are expressed as the percentage of cell survival normalized to a dimethyl sulfoxide (DMSO)-treated condition (control). (Right) histograms depict cell survival for each category in presence of ruxolitinib (1 μM). Means and SEM are represented. Mann-Whitney test. ∗P < .05; ∗∗∗P < .001; ∗∗∗∗P < .0001. (B) PDX cells from 4 T-ALLIL7R+/WT were cultured in complete medium deprived of IL-7 (green) or supplemented with increasing concentrations of IL-7 (orange, 1 ng/mL; red, 5 ng/mL; and purple, 10 ng/mL). For each condition, cells were exposed to increasing concentrations of ruxolitinib, and cell viability was assessed as in panel A after 72 hours of culture. (Top) Bars depict raw viability (mean with standard deviation) for control-treated conditions (DMSO). (Bottom) Cell viability was normalized for each condition to the corresponding control-treated condition. Results are shown as mean with SD for each ruxolitinib concentration. (C) PDX cells derived from 1 T-ALLIL-7R–/low, 1 T-ALLMut, and 2 T-ALLIL7R+/WT were stained with CellTrace Violet cell proliferation kit and cultured in medium supplemented with IL-7 (black histograms), with IL-7 and ruxolitinib 1 μM (yellow-filled histograms), or without IL-7 (pink-filled histograms). On day 7, cells were analyzed using FC to assess cell generations from living cells. (D) Bar plot depicts the relative proportions of cell generations among living cells for 2 T-ALLIL7R−/low, 2 T-ALLMut, and 2 T-ALLIL7R+/WT following the same experimental procedure as in panel C. Note that the cell viability is affected by the absence of IL-7 or the presence of ruxolitinib in T-ALLMut and T-ALLIL7R+/WT in contrast to T-ALLIL7R−/low.
T-ALLIL-7R+/WT highly sensitive to ruxolitinib are characterized by broad H3K4me3 domains on IL-7R promoter
We analyzed the steady-state bulk RNA-seq data and observed an active IL-7Rp transcriptional signature in mutants, which was absent in expressers (Figure 5A). We only found higher IL-7R and Pim1 transcripts in expressers as compared to nonexpressers, suggesting a priming of IL-7Rp but no constitutive activation (supplemental Figure 10). We, thus, assessed whether the expression and functionality of IL-7R could be epigenetically dictated. To address this question, we examined IL-7R using a multiomic approach combining whole CpG-DNA methylation data, RNA-seq, and H3K4me3 CHIP-seq data.46 As expected, nonexpressers were characterized by a strong level of DNA methylation, minimal IL-7R transcription, and H3K4me3-activating marks (cluster 1; Figure 5B; supplemental Figure 10). Conversely, cluster 3 was characterized by minimal levels of IL-7R DNA methylation, high levels of IL-7R transcription, and H3K4me3 marks and comprised only IL-7R–expressing cases. Cluster 2 displayed intermediate features mixing both IL-7R–expressing and nonexpressing cases. Interestingly, the level of the H3K4me3 mark on the IL-7R promoter appeared to best identify cluster 3. Therefore, we investigated this mark associated with transcriptional elongation on additional T-ALL primary samples. Strikingly, expressers were characterized by broad H3K4me3 domains, especially in cortical T-ALL. In contrast, nonexpressers were characterized by sharp H3K4me3 domains (Figure 5C,D). We previously showed that H3K4me3 broad domains were present on the IL-7R promoter in thymocytes subpopulations, including at the cortical stage.47 However, CD127 is physiologically downregulated and nonresponsive at this stage (Figures 1A and 3A), whereas cortical T-ALL often express CD127 and respond to stimulation (Figures 2B and 3C), suggesting the loss of a posttranscriptional mode of regulation in T-ALL. In line with this hypothesis, CD127 expression and H3K4me3 breadth were correlated in T-ALL (Figure 5E). Finally, we asked whether this apparent ectopic expression could be associated with an oncogenic addiction to IL-7. In line with this, we found that the 50% inhibitory concentration (IC50) for ruxolitinib was inversely correlated with the H3K4me3 signal (Figure 5F). Altogether, our data support ectopic expression and oncogenic IL-7 addiction in cortical T-ALL, which can be reversed by JAK inhibition.

Expressers highly sensitive to ruxolitinib are characterized by broad H3K4me3 domains on the IL-7R promoter. (A) Gene set variation analysis between T-ALLIL7R-/low (n = 26), T-ALLIL7R+/WT (n = 28), and T-ALLMut (n = 42) using a custom IL-7R pathway gene set of 36 genes selected from reactome (REACTOME_INTERLEUKIN_7_SIGNALING) and biocarta (BIOCARTA_IL7_PATHWAY) databases. Box plots show lower, median, and upper quartiles. Whiskers mark the 10th and 90th percentiles. Dots represent outliers. Kruskal-Wallis test with post hoc Dunn multiple comparisons test. ∗P < .05; ∗∗P < .01. (B) IL-7R was evaluated using a multiomic approach combining EPIC-array, CHIP-seq, and bulk RNA-seq on 10 T-ALLIL7R−/low, 9 T-ALLIL7R+/WT, and 7 T-ALLMut. The heatmap shows the level of CpG-DNA methylation (dna_meth) and H3K4me3 breadth (H3K4me3_promoter) on IL-7R promoter/transcription starting site as well as the IL-7R transcript level for each sample. Samples are classified by k-means (k = 3), then hierarchical clustering. For each metric, values were centered and reduced. (C) H3K4me3 tracks on IL7R promoter for 15 T-ALLIL7R+/WT, 8 T-ALLMut, and 15 T-ALLIL7R−/low. (D) Box plots showing the breadth (bp) of H3K4me3 peaks on IL-7R transcription starting site for the same T-ALL as in panel C, based on the 3 categories defined in this article (left) or their phenotype (right). Mann-Whitney test. The P-value is indicated for each comparison. (E) Correlation between sIL-7R expression (percentage of CD127+ blasts) and H3K4me3 peak quantile–normalized coverage signal on the IL-7R promoter. The dashed line indicates the threshold for CD127 positivity (20%). Correlation curve and 95% confidence interval are shown. Pearson correlation test. (F) Inverse correlation between ruxolitinib sensitivity (log2 IC50) and H3K4me3 peak signal on the IL-7R promoter. Correlation curve and 95% confidence interval are shown. Pearson correlation test.
Expressers highly sensitive to ruxolitinib are characterized by broad H3K4me3 domains on the IL-7R promoter. (A) Gene set variation analysis between T-ALLIL7R-/low (n = 26), T-ALLIL7R+/WT (n = 28), and T-ALLMut (n = 42) using a custom IL-7R pathway gene set of 36 genes selected from reactome (REACTOME_INTERLEUKIN_7_SIGNALING) and biocarta (BIOCARTA_IL7_PATHWAY) databases. Box plots show lower, median, and upper quartiles. Whiskers mark the 10th and 90th percentiles. Dots represent outliers. Kruskal-Wallis test with post hoc Dunn multiple comparisons test. ∗P < .05; ∗∗P < .01. (B) IL-7R was evaluated using a multiomic approach combining EPIC-array, CHIP-seq, and bulk RNA-seq on 10 T-ALLIL7R−/low, 9 T-ALLIL7R+/WT, and 7 T-ALLMut. The heatmap shows the level of CpG-DNA methylation (dna_meth) and H3K4me3 breadth (H3K4me3_promoter) on IL-7R promoter/transcription starting site as well as the IL-7R transcript level for each sample. Samples are classified by k-means (k = 3), then hierarchical clustering. For each metric, values were centered and reduced. (C) H3K4me3 tracks on IL7R promoter for 15 T-ALLIL7R+/WT, 8 T-ALLMut, and 15 T-ALLIL7R−/low. (D) Box plots showing the breadth (bp) of H3K4me3 peaks on IL-7R transcription starting site for the same T-ALL as in panel C, based on the 3 categories defined in this article (left) or their phenotype (right). Mann-Whitney test. The P-value is indicated for each comparison. (E) Correlation between sIL-7R expression (percentage of CD127+ blasts) and H3K4me3 peak quantile–normalized coverage signal on the IL-7R promoter. The dashed line indicates the threshold for CD127 positivity (20%). Correlation curve and 95% confidence interval are shown. Pearson correlation test. (F) Inverse correlation between ruxolitinib sensitivity (log2 IC50) and H3K4me3 peak signal on the IL-7R promoter. Correlation curve and 95% confidence interval are shown. Pearson correlation test.
Cotargeting of BCL2 and JAK1 is synergistic in CD127-expressing T-ALL irrespective of the IL-7Rp mutational status
The IL-7Rp is known to promote T-cell survival via the induction of antiapoptotic proteins such as BCL2.11 Potent clinical-grade BCL2 inhibitors, such as venetoclax have proven efficient in treating T-ALL.23,24 Recent studies showed that JAK inhibition combined with targeting of BCL2 results in synergistic effects on cells transformed with JAK3 or IL-7Rα mutants.25,48 We hypothesized that this cotargeting may not only benefit mutants but could also extend to expressers. To address this question, we performed a dynamic evaluation of BCL2 transcript and protein expression upon stimulated (IL-7) and inhibited (IL-7+ruxolitinib) conditions. Mutants showed a constitutive IL-7–independent overexpression of BCL2 transcript and protein, which was weakly sensitive to IL-7 stimulation and ruxolitinib (Figure 6A). Interestingly, JAK1 inhibition impaired IL-7–induced BCL2 expression but not constitutive BCL2 overexpression. This contrasts with our previous observation that ruxolitinib abrogates inducible and partially constitutive pSTAT5 activation in mutants (Figure 3C). BCL2 expression dramatically increased upon IL-7 stimulation in expressers, and ruxolitinib fully abrogated this IL-7–inducible expression (Figure 6A).
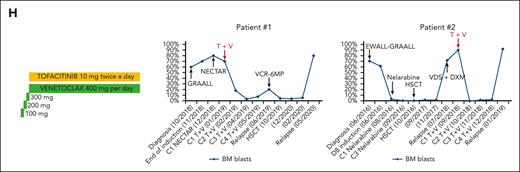
BCL2 and JAK1 cotargeting is synergistic in CD127+ T-ALL, irrespective of IL-7Rp mutational status. (A) PDX cells were cultured in complete medium deprived of IL-7 (no IL-7), supplemented with IL-7 (100 ng/mL; IL-7), or supplemented with IL-7 (100 ng/mL) and ruxolitinib (1 μM; IL-7 + Ruxo). Bcl2 expression was then analyzed for each condition via qRT-PCR after 24 hours of incubation (left: 2 T-ALLIL7R−/low, 7 T-ALLIL7R+/WT, and 8 T-ALLMut) and FC after 48 hours of incubation (right: 6 T-ALLIL7R−/low, 9 T-ALLIL7R+/WT, and 10 T-ALLMut). Wilcoxon test for paired samples, Mann-Whitney test for unpaired samples. ∗P < .05; ∗∗P < .01. Means and SEM are represented. (B) PDX cells from 8 T-ALLIL7R−/low, 14 T-ALLIL7R+/WT, and 10 T-ALLMut were cultured for 48 hours in complete medium alone (basal/static) or supplemented with ruxolitinib 1 μM (dynamic). Cells were then exposed to venetoclax 1 μM or DMSO for 1 hour before cytochrome c release assessment by FC. For each condition, results were obtained after venetoclax exposure and were normalized to the DMSO-treated corresponding cells. Means and SEM are represented. DMSO (negative control) and alamethicin (positive control) were used to gate cytochrome c positive cells (see supplemental Methods). ∗∗P < .01; ∗∗∗P < .001, Wilcoxon test. (C) PDX cells from 11 T-ALLIL7R+/WT and 10 T-ALLMut were cultured in presence of increasing concentrations of venetoclax alone (left) or in combination with ruxolitinib at a fixed ratio (ruxolitinib/venetoclax: 4/1) (right). Cell viability was assessed after 96 hours of incubation using FC (annexin V/PI staining). Results were normalized to a DMSO-treated condition. Means and SEM are represented. (D) CIs for the combination of ruxolitinib (1 μM) and venetoclax (250 nM) tested on 8 T-ALLIL7R+/WT and 7 T-ALLMut as in (C) CompuSyn software was used to calculate the CI. A CI of 1 indicates an additive effect; CI < 1, a synergistic effect; and CI > 1, antagonism. (E) Heatmap summarizing the data presented in panels B-D. (F) Representative 3D synergy plots of a T-ALLIL7R+/WT (top) and a T-ALLMut (bottom) tested for the combination ruxolitinib and venetoclax. A Bliss score >10 indicates synergy, between −10 to 10, additivity, and <−10, antagonism. The software SynergyFinder was used to draw synergy plots and calculate Bliss scores. (G) Bliss score (75% quantile) for the combination ruxolitinib and venetoclax was calculated as in F for 10 T-ALLIL7R+/WT and 7 T-ALLMut. (H) (Left) Treatment schedule for the combination of tofacitinib and venetoclax in patients with relapsed/refractory T-ALL. (Middle) BM blast count evolution (percentage of mononuclear cells) in Pt 1. Therapeutic interventions are detailed above or below the corresponding arrows. (Right) BM blast count evolution (percentage of mononuclear cells) in Pt 2. Therapeutic interventions are detailed above or below the corresponding arrows. CX, cycle number X; D, Day; DXM, dexamethasone; EWALL, European Working Group on Adult ALL protocol; GRAALL, Group for Research on Adult Acute Lymphoblastic Leukemia protocol; HSCT, hematopoietic stem cell transplant; MRD, minimal residual disease; NECTAR, nelarabine, cyclophosphamide, etoposide; T, tofacitinib; V, venetoclax; VCR, vincristine; VDS, vindesine; 6MP, 6-mercaptopurine.
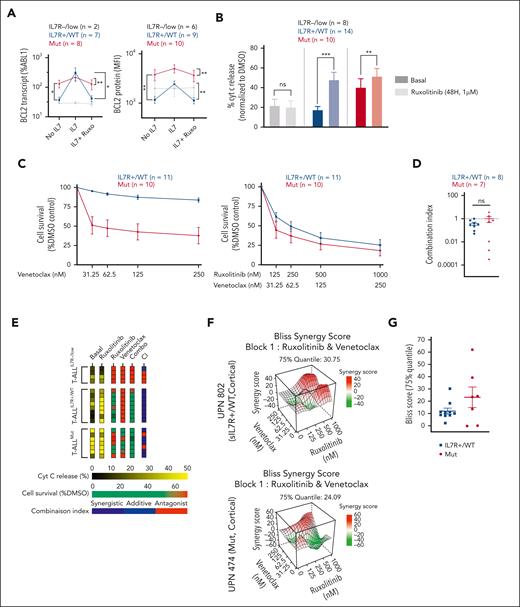
Mitochondrial apoptosis results from the complex interactions of proteins from the BCL2 family, and the measurement of sole protein levels may not reflect the dominant antiapoptotic mechanism.49 To properly assess the functional dependency to the BCL2 molecule, we measured cytochrome c release at basal state and after preexposition to ruxolitinib (priming; Figure 6B). Our data showed that mutants displayed strong functional dependency to BCL2, which was not altered by JAK inhibition. By contrast, expressers were poorly dependent on the BCL2 molecule, but priming by ruxolitinib dramatically enhanced functional dependency on BCL2. Altogether, JAK1 inhibition does not alter BCL2 constitutive dependency in mutants but increases BCL2 dependency in expressers (Figure 6B).
To assess whether this could predict sensitivity to venetoclax, we performed ex vivo cytotoxic assays using ruxolitinib and/or venetoclax. PDXs from mutants were highly sensitive to venetoclax alone, consistent with the immature maturation stage of arrest (Figure 6C).23,24 By contrast, T-ALLIL-7R+/WT were poorly sensitive to venetoclax at basal state, but the combination of ruxolitinib and venetoclax overcame this relatively low sensitivity and induced dramatic cell-death, as predicted by cytochrome release assays.
Recent work suggested synergism of BCL2 and JAK1 coinhibition in T-ALL with IL7Rp mutations.48 We wondered whether synergism would extend to all IL-7R–expressing T-ALL, including expressers. The combination of venetoclax and ruxolitinib resulted in synergistic effects in both mutants and expressers, as supported by low CI and Bliss scores (Figure 6D-G). Consequently, cotargeting JAK1 and BCL2 is synergistic in CD127-expressing T-ALL irrespective of the IL-7R pathway mutational status.
Efficacy of JAK and BCL2 coinhibition in patients with relapsing/refractory T-ALL
We sought to determine how our in vitro and ex vivo results could translate into clinical applications. We report 2 adult patients with chemorefractory IL-7Rp–mutated ETP-ALL who were treated with the combination of tofacitinib, a JAK3 inhibitor that gave similar results as ruxolitinib (supplemental Figure 11) and venetoclax (Figure 6H; supplemental Table 5).
Patient 1 (Pt 1) demonstrated a rapid response after the first cycle of combination therapy (C1, 18% blast cells vs 70% pretreatment). Venetoclax could be increased up to 800 mg/day, and Pt 1 attained complete response (CR) with incomplete hematological recovery (CRi) at the end of C2. Combination therapy was well tolerated, without notable adverse events. However, at the end of C3, 7% BM blast cells were noted, and Pt 1 presented an overt relapse 2 months after CRi. Treatment with vincristine and 6 mercapto-purine allowed him to proceed to allogeneic hematopoietic stem cell transplantation. Unfortunately, he relapsed 7 months after, and subsequently, died of disease. Pt 2 achieved CR with MRD negativity after C1. However, delayed acute graft-versus-host disease with cytopenia and fever occurred during C2 and was resolved with corticosteroid therapy and 3 weeks of combination therapy discontinuation, after which venetoclax was resumed at a dose of 400 mg/day and tofacitinib at 5mg twice per day. CR was maintained for 3 months, until the end of C4, after which Pt 2 presented an overt relapse and subsequently died of disease. Altogether, the combination of JAK and BCL2 inhibition enables the achievement of CR for a couple of months and may be considered as a bridge-to-transplantation therapy.
Discussion
IL-7R protein expression strongly associates with signaling functionality in both normal and malignant contexts, so that whenever the IL-7R is expressed, it is functional. IL-7R expression is tightly regulated in normal thymopoiesis, and we confirm at the single cell level a dramatic decrease in IL-7R expression around β-selection, in accordance with previous literature.35-37 Epigenetic and transcriptional data show no significant variation across the thymocytic differentiation stages, suggesting a posttranscriptional/translational mechanism for the control of IL-7R expression. Keeping with this, previous reports showed activating marks with broad H3K4me3 domains on IL-7R promoter at any stage of thymocytic differentiation47 as well as the role of SOCS36,50 and DNM251 proteins in the regulation of IL-7R expression and signaling.
The IL-7R expression pattern in T-ALL is significantly aberrant from normal. A significant fraction of TCRαβ T-ALL does not express IL-7R, in contrast with their physiological counterpart. This may be related to the enrichment of SIL-TAL microdeletions leading to transcriptional repression of IL-7R.52 This is also consistent with frequent PTEN deletions. The biology of mature TCRαβ T-ALL thus differs from other T-ALL, with a PI3K-AKT–driven oncogenesis unrelated to the JAK-STAT pathway.52-54 Keeping with this, nonexpressers harbor sharp H3K4me3 marks on the IL-7R promoter, consistent with an epigenetic drift of activating marks from cell identity genes to oncogenes in T-ALL.47 On the other hand, IL-7R expression culminates in cortical T-ALL, in contrast with their normal counterpart. This strongly suggests an oncogenic loss of the posttranscriptional/translational mechanism of regulation, allowing for the ectopic and oncogenic expression of IL-7R in cortical T-ALL. Finally, noncortical T-ALL showed the presence of IL-7R, consistent with their ontogenic counterpart, with constitutive activation supported by activating mutations of the IL-7Rp. Altogether, our data suggest a dysregulation affecting the IL-7Rp in most T-ALL, at the epigenetic level in nonexpressers; genetic level in mutants; and posttranscriptional level in expressers. Functionally, this is consistent with the creation of supportive IL-7R-signaling with ectopic neoexpression of the receptor in cortical expressers, a reinforcement of the IL-7Rp-signaling in mutants, but also the extinction of the IL7R-signaling in nonexpressers allowing a switch to PI3K-AKT dependency.
While GOF mutations of IL-7Rp account for 30% of T-ALL,13,14 we report that IL-7R expression is far more frequent, accounting for ∼70% of T-ALLs, as previously anticipated.40 Our signaling studies show that IL-7Rp activation results from cell-extrinsic and cell-intrinsic effects in T-ALL, which, interestingly, can be reversed by ruxolitinib. As expected, only mutants demonstrate cell-intrinsic signaling, whereas both mutants and expressers are IL-7 responsive, thus highlighting the oncogenic importance of cell-extrinsic cues.44 The functional consequence of this is that all but nonexpressers respond to JAK inhibition irrespective of the IL-7Rp mutational status, resulting in decreased cell proliferation and viability. Sensitivity of T-ALL to JAK inhibition in the absence of IL-7Rp mutation has previously been evoked18,20 and recently illustrated in a murine transgenic model.22 However, the clinical significance of this observation remains elusive. Here, we provide the first large scale study that fully confirms CD127 as a biomarker for sensitivity to JAK inhibition. This extends the eligibility of T-ALL for ruxolitinib beyond previously reported mutants or ETP-ALL.20,25 This is of strong clinical significance as this drug could benefit ∼70% rather than 30% of T-ALL overall, as previously anticipated.
We also outline subtle differences in drug sensitivity between mutants and expressers, with an even deeper sensitivity to ruxolitinib in expressers as compared with mutants. Our data suggest that the maturation stage of arrest may explain these differences. Expressers comprise a majority of cortical T-ALL with an ectopic IL-7R driving strong oncogenic signals. Conversely, mutants were mostly noncortical T-ALL, in which IL-7R expression is reminiscent of the ontogeny, and IL-7R signaling is oncogenically reinforced by IL-7Rp mutation so that its constitutive activation plays as an additional driver. We speculate that ruxolitinib has more cytotoxic effects in expressers because it tackles a major oncogenic signal in cortical T-ALL. Conversely, mutants bear high BCL2 expression levels reminiscent of their normal counterpart. Although ruxolitinib fully abrogates inducible and partially constitutive pSTAT5, it only hampers inducible BCL2 expression, indicating a JAK-STAT–independent BCL2 expression in this context as previously suggested.55 In contrast, expressers, enriched in cortical T-ALL, bear IL-7–inducible and ectopic expression of BCL2 that is fully JAK-STAT dependent and reversed by ruxolitinib in this context. Importantly, the addition of venetoclax results in a synergistic effect in both mutants and expressers. While venetoclax inhibits residual BCL2 in mutants, ruxolitinib polarizes apoptotic dependency on BCL2 in expressers.
Our data show that expression matters for the selection of patients able to respond to the ruxolitinib + venetoclax combination. Flow-cytometric assessment of CD127 expression appears as a fast, easy, and cheap companion test that is broadly applicable to screen patients for drug sensitivity. The evaluation of pSTAT5 Y694 could be considered a more relevant functional readout. However, phosphoflow requires a dynamic test with in vitro IL-7 stimulation, and it is far more challenging to standardize within diagnostic labs. We thus propose flow-cytometric assessment of CD127 expression as the best compromise in terms of applicability and clinical relevance to identify patients eligible for targeted therapy.
Altogether, this study provides valuable information to optimize the translation of ruxolitinib and venetoclax to clinical applications for patients with relapsed T-ALL who need bridge-to-transplantation therapy. This treatment protocol may benefit a larger group of patients who may be selected with an easily applicable FC-based companion test.
Acknowledgments
The corresponding author thanks the EHA-ASH joint effort as a translational Research Trainee in Hematology.
This work was supported by INCA PLBIO 2021-1-PL BIO-04, Ligue Contre le Cancer Enfants et Cancers de 2021, L’association pour la Recherche contre le Cancer ARC Labellisation PGA_RC 2020 ROUSSELOT, La Fédération Leucémie Espoir, Force Hémato, Association Laurette Fugain ALF 2021/04. L.C. was supported by a grant from Fondation pour la Recherche Médicale (Poste de thèse pour internes et assistants FDM201906008584).
Authorship
Contribution: L.L., L.C., R.K., M.D., and V.A. collected, analyzed, and managed the data; L.L., L.C., and R.K. wrote the manuscript; G.C., G.P.A., and A.P. performed bioinformatic analyses; N.B., A.C.-H., and P.R. provided clinical data; L.L. designed the concept of the work and supervised analyses and writing; and all authors generated the data.
Conflict-of-interest disclosure: The authors declare no competing financial interests.
Ludovic Lhermitte, Laboratory of Onco-haematology, Tour Pasteur, Necker-Enfants-Malades Hospital, 149 rue de Sèvres, 75015 Paris, France; e-mail: ludovic.lhermitte@aphp.fr.

This feature is available to Subscribers Only
Sign In or Create an Account Close Modal