

Key Points
CXCL14 is lost in BM stromal cells in patients with CML, and restoring CXCL14 suppresses CML LSC engraftment in vivo and survival in vitro.
CXCL14 treatment inhibits mTOR and oxidative phosphorylation signaling pathways in CML LSCs.

Abstract
Although tyrosine kinase inhibitors (TKIs) are effective in treating chronic myeloid leukemia (CML), they often fail to eradicate the leukemia-initiating stem cells (LSCs), causing disease persistence and relapse. Evidence indicates that LSC persistence may be because of bone marrow (BM) niche protection; however, little is known about the underlying mechanisms. Herein, we molecularly and functionally characterize BM niches in patients with CML at diagnosis and reveal the altered niche composition and function in these patients. Long-term culture initiating cell assay showed that the mesenchymal stem cells from patients with CML displayed an enhanced supporting capacity for normal and CML BM CD34+CD38– cells. Molecularly, RNA sequencing detected dysregulated cytokine and growth factor expression in the BM cellular niches of patients with CML. Among them, CXCL14 was lost in the BM cellular niches in contrast to its expression in healthy BM. Restoring CXCL14 significantly inhibited CML LSC maintenance and enhanced their response to imatinib in vitro, and CML engraftment in vivo in NSG-SGM3 mice. Importantly, CXCL14 treatment dramatically inhibited CML engraftment in patient-derived xenografted NSG-SGM3 mice, even to a greater degree than imatinib, and this inhibition persisted in patients with suboptimal TKI response. Mechanistically, CXCL14 upregulated inflammatory cytokine signaling but downregulated mTOR signaling and oxidative phosphorylation in CML LSCs. Together, we have discovered a suppressive role of CXCL14 in CML LSC growth. CXCL14 might offer a treatment option targeting CML LSCs.
Introduction
Chronic myeloid leukemia (CML) is a clonal myeloproliferative neoplasm (MPN) arising from transformed primitive stem cells. It is characterized by the presence of the BCR-ABL1 fusion gene encoding a constitutively activated tyrosine kinase protein that triggers an abnormal expansion of immature and mature myeloid cells. Tyrosine kinase inhibitors (TKIs), targeting the BCR-ABL1 protein, are effective in treating CML. However, even after several years of continuous TKI therapy, molecularly measurable residual disease can be detected in the majority of patients.1 The persistence of residual leukemia-initiating stem cells (LSCs) is common in these patients even after long-term therapy.2-4 Of patients with CML who can stop TKI treatment after having achieved deep molecular remission, ∼50% show molecular relapse within 12 months after stopping TKI therapy,5 which leads to an absolute requirement of life-long TKI treatment in the majority of these patients. The persistence of LSCs in leukemias is attributed to both intrinsic and extrinsic mechanisms, for example, the protection of LSCs by the bone marrow (BM) niche.6-13 The niche is reconstructed by leukemic cells to become supportive of the LSCs but hostile to normal hematopoietic stem cells (HSCs). Thus, to develop novel complementary therapies to eradicate CML LSCs, it is essential to identify the niche factors that are dysregulated and that have a functional impact on CML LSC maintenance.
The BM niche encompasses various types of stromal cells including osteoblasts, adipocytes, perivascular cells, endothelial cells (ECs), mesenchymal stem cells (MSCs), and mature stromal cells.10,14 In vitro, human MSCs can differentiate to mesenchymal lineages including osteoblasts, adipocytes, and chondrocytes, and have the capacity to form colony-forming unit fibroblasts (CFU-Fs).15 Human BM MSCs can be phenotypically identified and isolated by fluorescence-activated cell sorting (FACS) based on their cell surface markers (CD45–CD235A–CD31–CD44–), which are mostly positive for CD146 and CD271.14,16,17 To uncover the biological features of these cellular niche populations in CML, it is essential to freshly isolate the cells for subsequent molecular characterization.
Normal function and structure of the BM niche are required for maintaining normal hematopoiesis.18 Studies in mice suggest that structural and functional niche alterations in the BM can lead to the initiation and progression of myeloid malignancies.10 Genetic abnormalities in human BM MSCs are associated with increased overall and leukemia-related mortality in myelodysplastic syndrome and acute myeloid leukemia (AML).19 The malignant transformation caused by dysregulated niches appears to be a gradual process and associated with an abnormal production of inflammatory cytokines and growth factors by the niche, which in turn promotes myelopoiesis at the expense of lymphoid production and HSC maintenance.10,20,21 Furthermore, the composition and function of the BM niche are dynamic. During leukemia progression, leukemic cells can actively remodel their niche to self-reinforce their proliferation but impair normal hematopoiesis.22-24 This, in turn, can advance the disease and negatively affect treatment outcome. This notion is well supported by recent reports that BM mesenchymal niche–derived factors including CXCL12,25 Wnt,26,27 and interleukin-1 (IL-1)28 can protect CML LSCs from TKI treatment, mainly by maintaining CML LSCs in the quiescent status. Furthermore, the upregulated inflammatory cytokines, such as tumor necrosis factor α (TNF-α), acting together with chemokines in the BM niche possibly confer CML LSCs a growth advantage over normal HSCs during CML development.8,22,24 Similar observations were reported in other myeloid malignancies including myelodysplastic syndrome,29 MPN,20,30 and AML.31-33 However, very little is known about BM niche alterations in patients with CML and the impact of such alterations on CML progression and treatment response.
By prospectively characterizing BM cellular niches in patients with CML we have uncovered molecular and functional alterations of CML BM MSCs. Among the dysregulated molecules, CXCL14 was the most substantially reduced cytokine in the CML BM stromal cell compartment. Restoring CXCL14 expression suppressed CML LSC maintenance and potentiated TKI inhibition in vitro. Most importantly, in vivo CXCL14 treatment significantly inhibited CML engraftment in mice with patient-derived xenografts. This study identifies CXCL14 as a new complementary therapeutic option targeting CML LSCs.
Materials and methods
Human sample collection
BM aspirates were obtained from patients with chronic phase CML at diagnosis (patient age, 21-85 years; median age, 63.5 years; supplemental Table 1, available on the Blood website) and age-matched healthy adult volunteers (aged 22-86 years; median age, 55 years) after informed consent was obtained from all patients and healthy donors. The sample collection was approved by the local ethical committee at Karolinska Institutet, Stockholm (2012/4:10, 2013/3:1 and for age-matched healthy donors 2018/1262-31).
Xenograft transplantation of CML LSCs
BM mononuclear cells (1 million cells per mouse) or CD34+CD38– cells (1000 cells per mouse) from patients with CML were intravenously transplanted into sublethally irradiated (250 cGy) immunodeficient NSG/SGM3 mice (Jackson Laboratory). The CD34+CD38– cells were cocultured with stromal cells with enforced CXCL14 expression or control cells for 3 to 4 days before the transplantation. For testing the effect of CXCL14 and imatinib (IM), 3 weeks after transplantation of BM mononuclear cells from patients with CML, the mice with comparable engraftment levels in blood were treated with saline, or IM (50 mg/kg per day) or CXCL14 (500 ng/kg per day) or both, by intraperitoneal injection for 7 to 12 days. CML engraftment in the BM, blood, and spleen was analyzed at 1 day to 19 weeks after the treatment. All the mice were maintained in specific pathogen-free conditions in the animal facility of Karolinska Institute. Animal procedures were performed with approval from the local ethics committee (ethical number 15861-2018) in Stockholm, Sweden.
LTC-IC and CAFC assays with BM MSCs derived from patients
Long-term culture initiating cell (LTC-IC) and cobblestone area–forming cell (CAFC) assays were done by using BM MSCs (CD45–CD235A–CD31–CD44–) that were sorted from healthy volunteers and patients with CML and culture-expanded for 2 to 3 passages. The MSCs were plated in 96-well plates at a density of 10 000 cells per well in Dulbecco’s modified Eagle medium GlutaMAX (Gibco) supplemented with 10% fetal bovine serum (Gibco), 1% penicillin/streptomycin (HyClone), and 100 μM 2-mercaptoethanol. After 24 hours, CD34+ or CD34+CD38– cells (150-1200 cells per well) sorted from NBM and CML BM were cocultured with MSCs for 6 weeks (LTC-IC) in MyeloCult H5100 (Stem Cell Technology) supplemented with 10–6 M hydrocortisone (Sigma-Aldrich) with a weekly medium change. After 6 weeks of coculture, cells were subjected to CFU-C assay. For the CAFC assay, BM CD34+CD38– cells were cocultured with primary BM MSCs for 2 weeks at 32°C to 33°C.
Statistical analysis
The unpaired t test or Mann-Whitney test was used to compare the differences between the cell types based on the data distribution. The paired t test or Wilcoxon tests were used to compare the differences between 2 groups on the same cells, and one-way analysis of variance test was used for determining differences among multiple groups. All reported P values were obtained using the GraphPad Prism 8.0, and P < .05 was considered statistically significant.
Additional methods
See the supplemental Data for additional methods.
Results
Alterations of BM stromal cells in patients with newly diagnosed CML
To explore potential alterations in the composition of the CML cellular niche, we characterized BM stromal cells freshly sorted from healthy donors (NBM) and patients with CML by FACS (Figure 1A-B). The BM stromal cells were subdivided into MSCs (CD45–CD235A–CD31–CD44–), ECs (CD45–CD235A–CD31+), and mature stromal cells (CD45–CD235A–CD31–CD44+).14 CD146 and CD271, reportedly expressed on normal BM MSCs16,17 were present in most of the CD44– MSCs from NBM and CML BM (Figure 1B). As in NBM, CFU-Fs were also enriched in the CD44– MSC fraction in the CML BM (supplemental Figure 1A), indicating that CML MSCs have a similar immunophenotype to that of NBM MSCs. This finding allows us to phenotypically compare CML MSCs with normal MSCs using the same cell surface markers.

Altered BM niche composition and MSC function in patients with CML. (A) Strategy for isolation and characterization of the BM cellular niche components. (B) Representative FACS profiles showing gating strategy for sorting of ECs (CD45–CD235A–CD31+), MSCs (CD45–CD235A–CD31–CD44–), CD45–CD235A–CD31–CD44–CD146+CD271+ MSC subsets, and mature stromal cells (CD45–CD235A–CD31–CD44+) within total stromal cells (CD45–CD235A–) from BM samples of patients with newly diagnosed CML and age-matched healthy donors (NBM). (C-E) Abnormal hematopoiesis supportive function of MSCs derived from patients with CML, examined by LTC-IC assay. (C) Experimental design of coculture system for assessing LTC-ICs. Normal BM (NBM) or CML BM CD34+ cells were sorted and cocultured with either NBM MSCs or CML MSCs for 6 weeks. Subsequently, the cells were collected for CFU-C assay. (D) LTC-ICs derived from NBM CD34+ cells cocultured with NBM or CML MSCs. (E) LTC-ICs derived from CML CD34+ cells cocultured with NBM or CML MSCs. (F) Quantitative polymerase chain reaction analysis of HSC niche factor expression in the NBM and CML MSCs. Horizontal lines represent median values, and each dot represents the mean of triplicate or duplicate measurements on samples from an individual donor. The data were collected from 4 to 5 independent experiments. The statistical differences were determined by paired t test (D-E) or unpaired Mann-Whitney test (F). See also supplemental Figure 1.
Altered BM niche composition and MSC function in patients with CML. (A) Strategy for isolation and characterization of the BM cellular niche components. (B) Representative FACS profiles showing gating strategy for sorting of ECs (CD45–CD235A–CD31+), MSCs (CD45–CD235A–CD31–CD44–), CD45–CD235A–CD31–CD44–CD146+CD271+ MSC subsets, and mature stromal cells (CD45–CD235A–CD31–CD44+) within total stromal cells (CD45–CD235A–) from BM samples of patients with newly diagnosed CML and age-matched healthy donors (NBM). (C-E) Abnormal hematopoiesis supportive function of MSCs derived from patients with CML, examined by LTC-IC assay. (C) Experimental design of coculture system for assessing LTC-ICs. Normal BM (NBM) or CML BM CD34+ cells were sorted and cocultured with either NBM MSCs or CML MSCs for 6 weeks. Subsequently, the cells were collected for CFU-C assay. (D) LTC-ICs derived from NBM CD34+ cells cocultured with NBM or CML MSCs. (E) LTC-ICs derived from CML CD34+ cells cocultured with NBM or CML MSCs. (F) Quantitative polymerase chain reaction analysis of HSC niche factor expression in the NBM and CML MSCs. Horizontal lines represent median values, and each dot represents the mean of triplicate or duplicate measurements on samples from an individual donor. The data were collected from 4 to 5 independent experiments. The statistical differences were determined by paired t test (D-E) or unpaired Mann-Whitney test (F). See also supplemental Figure 1.
When further dissecting the stromal cell niche, we found that the proportion of ECs (CD31+) was significantly increased whereas the CML CD44+ mature stromal cells were reduced, as compared with the normal BM. However, the CML MSCs (CD44– or CD271+CD146+) fraction within total stromal cells remained unaltered (supplemental Figure 1C).
The balanced lineage differentiation potential of the MSCs is important for maintaining normal HSC niche structure and composition.34 CML MSCs showed reduced osteogenic and chondrogenic differentiation potentials but enhanced adipogenic differentiation potential, compared with NBM MSCs (supplemental Figure 1D-E). The altered differentiation potential is supported by downregulation of osteoblast- and chondrocyte-associated genes in the CML MSCs, as revealed by RNA sequencing analysis (supplemental Figure 1F).
CML MSCs provided better support for normal and CML stem and progenitor cells
Impaired support of normal hematopoiesis but favorable support of leukemic cells by the leukemic microenvironment was reported in a CML mouse model.24-26 To test the hematopoiesis-supportive function of the patient-derived primary MSCs, we performed LTC-IC assay using primary CML BM and NBM MSCs (Figure 1C). Surprisingly, coculture with CML MSCs supported NBM CD34+ cells to generate more LTC-ICs than with NBM MSCs (Figure 1D-E), suggesting enhanced hematopoietic stem and progenitor cell (HSPC) growth support by CML MSCs. To explore whether NBM MSCs restrict CML CD34+ cell proliferation, we examined the LTC-IC activity of CML CD34+ cells cocultured with NBM or CML MSCs. We observed reduced LTC-ICs from CML CD34+ cells in the culture with NBM MSCs compared with that with CML MSCs (Figure 1E). These data suggest enhanced supportive function of CML MSCs for both normal and CML HSPCs. Concurrently, LAMA4, COL1A1, and CXCL14 were reduced in the cultured CML MSCs (Figure 1F). This finding is consistent with our report that the loss of Lama4 in mouse BM MSCs promotes AML cell proliferation and drug resistance.35
CML BM stromal cells do not carry BCR-ABL1 fusion gene
Whether BM stromal cells harbor any genetic mutations that are found in the leukemic cells, which may be linked to the pathophysiology of leukemia, has remained controversial. The findings from the studies on culture-selected BM stromal cells have been contradictory.36-38 The possible contamination of remaining leukemic cells in the culture-selected stromal cells could lead to a false-positive result. Therefore, in this study, we analyzed the BCR-ABL1 fusion gene in freshly isolated MSCs, ECs, and mature stromal cells from CML BM by fluorescence in situ hybridization (supplemental Figure 2A). No BCR-ABL1 fusions were detected in stromal cells from patients with CML (supplemental Figure 2B-C). This suggests that the CML BM stromal cells do not harbor the driver mutation BCR-ABL1.
RNA sequencing reveals molecular alterations in CML stromal cells at diagnosis
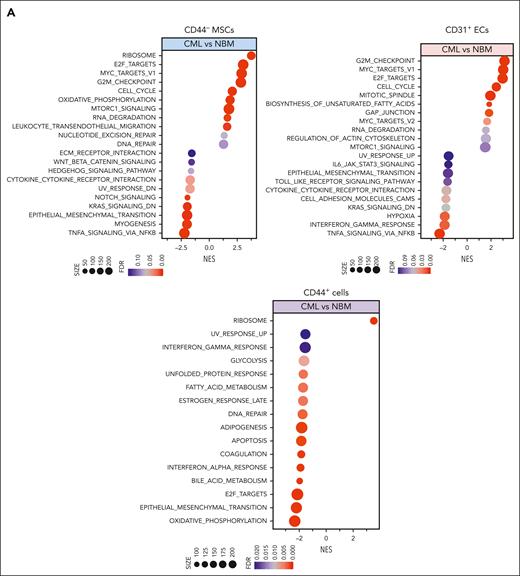
To unravel the molecular features of the stromal cells from patients with CML, we performed RNA sequencing of freshly sorted NBM and CML BM stromal cells. Principal component analysis shows distinct molecular profiles of the CML niche cell populations (supplemental Figure 3A). In line with the previous findings,14,39 the niche factors, such as cytokines and growth factors, were mainly expressed by MSCs and ECs, and not in the CD44+ mature stromal cells (Figure 2A; supplemental Figure 3B). Gene set enrichment analysis revealed differentially expressed genes in the CML niche cells (Figure 2A). In contrast with the enhanced inflammatory cytokine signaling observed in the BM niche of mice with MPN,20 inflammatory cytokine pathways including TRAF5, IL32, and interferon signaling pathways were downregulated in CML stromal cells whereas cell cycle and oxidative phosphorylation–associated genes were upregulated (Figure 2A-D; supplemental Figure 3C-D). PTPN11 activating mutation in mesenchymal progenitor cells has been shown to cause MPN.21 Upregulation of PTPN11 and downregulation of hematopoiesis-supportive genes including ANGPT1, ANGPTL4, KITLG, and LAMA4 in CML MSCs may indicate their possible contribution to CML pathogenesis (Figure 2C; supplemental Figure 4A). Cell-to-cell adhesive interactions are important for cell proliferation, migration, and differentiation.40,41 In this study, we detected dysregulation of adhesion molecules in the CML niche, including downregulation of ICAM1 and integrin α10/ITGA10, and upregulation of integrin α4/ITGA4/CD49D and ALCAM/CD166 in CML MSCs (Figure 2C; supplemental Figure 3E-5). However, ITGA4/CD49D, ITGA6/CD49F, and VCAM1/CD106 were downregulated in CML ECs (supplemental Figure 5).
RNA sequencing reveals molecular profiles of CML BM cellular niches. RNA sequencing was performed on FACS-sorted BM CD44– MSCs, CD31+ ECs, and CD44+ mature stromal cells from 5 patients with CML and 6 healthy BM donors. The false discovery rate (FDR) q value (FDR-q value) represents the false discovery rate of the P values. Gene set enrichment analysis (GSEA) was carried out on the RNA sequencing data to identify differentially expressed genes in the CML-derived stromal cells. (A) GSEA reveals differentially expressed gene sets in the CML CD44– MSCs, CD31+ ECs, and CD44+ mature stromal cells. (B) GSEA plot showing the downregulation of genes involved in the cytokine-receptor interaction in CML MSCs and the heatmap of the top 25 altered genes in this pathway. (C) Selected inflammatory cytokine and adhesion molecule expression in the CML MSCs. (D) Volcano plots showing the altered genes in the CML BM MSCs and ECs in comparison with their healthy counterparts. The red arrows highlight CXCL14 expression. (E) Venn diagram summarizing the commonly differentially expressed genes within the CML CD44– MSCs, CD31+ ECs, and CD44+ mature stromal cells. The numbers in the panel represent the genes that are significantly (P < .01 and FDR < 0.10) altered. (F) Downregulation of CXCL14 transcripts in the MSCs, CD44+ mature stromal cells, and ECs from patients with CML. Horizontal lines represent median values. The data were from 5 patients with CML and 6 normal BM donors. See also supplemental Figures 3-5. RPKM, reads per kilobase of transcript, per million mapped reads.
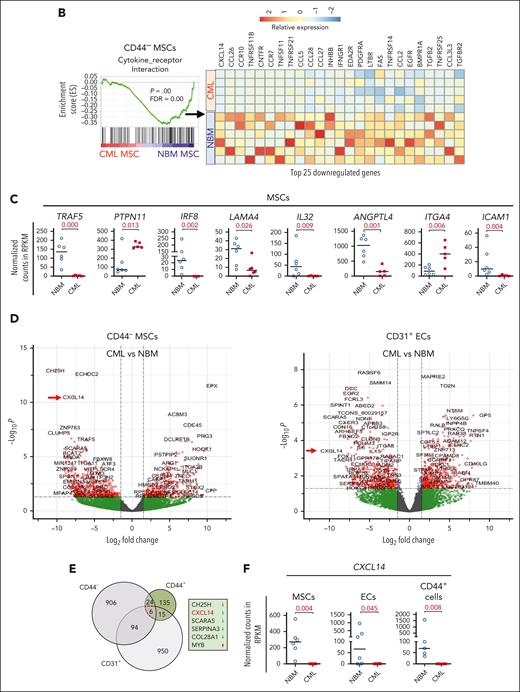
Notably, among the commonly differentially expressed genes in the CML MSCs, ECs, and mature stromal cells, CXCL14 was the most considerably reduced cytokine (Figure 2E-F). This alteration in CML MSCs was confirmed by quantitative polymerase chain reaction and FACS (supplemental Figure 4A; supplemental Figure 4C-E). Low or undetectable CXCL14 expression in hematopoietic cells in CML BM emphasizes its potential functional importance for CML cell growth (supplemental Figure 4B).
Enforced expression of CXCL14 in stroma suppresses CML LSC maintenance in vitro
To assess the impact of CXCL14 on the CML LSCs we took advantage of CXCL14-overexpressing NIH3T3 stromal cells (NIH3-CXCL14) using an in vitro coculture system followed by LTC-IC assay and transplantation into immunodeficient mice (Figure 3A). After a 7-day coculture of CML BM CD34+CD38− cells with NIH3-CXCL14 cells, the total numbers of the cells were increased but the numbers of LTC-ICs were reduced, compared with that in cells cocultured with the control stromal cells (NIH3-CTRL) (Figure 3B). Consistently, FACS analysis showed a reduced frequency of residual CD34+CD38– LSCs but increased fraction of CD15+CD66B+ myeloid cells from the CML CD34+CD38– cells after coculture with NIH3-CXCL14 cells (Figure 3C-D). In contrast, coculture with NIH3-CXCL14 stromal cells did not elicit any significant effects on normal BM CD34+CD38– cells (Figure 3B-D). These findings indicate that the stromal-derived CXCL14 promotes proliferation and differentiation of CML LSCs.

CXCL14 overexpression in stromal cells suppresses CML CD34+CD38− cell growth in vitro and engraftment in the NSG-SGM3 mice. (A) Scheme representing the experimental design of coculture system. BM CD34+CD38– cells from 5 to 10 patients with newly diagnosed CML and 7 age-matched healthy donors (NBM) were sorted and cocultured with CXCL14-overexpressed NIH3 stromal cells (NIH3-CXCL14) or control NIH3 cells (NIH3-CTRL) for 3 to 7 days and analyzed by FACS and LTC-IC assay or transplanted into sublethally irradiated NSG-SGM3 mice. (B) Total cell numbers and LTC-ICs from NBM or CML CD34+CD38− cells cocultured with control or NIH3-CXCL14 stroma. The statistical difference was determined by paired t test. (C) The frequency of CD34+CD38– and CD15+CD66B+ myeloid cells generated from NBM or CML CD34+CD38– cells cocultured with control or NIH3-CXCL14 stroma. (D) Representative FACS profiles showing gating strategy of CD15+CD66B+CD33− myeloid cells and CD34+CD38– cells after the cocultures. The numbers in the panels are the percentage of positive cells within total live (PI–) cells. (E) Representative FACS profiles showing gating strategy of human CD45+ CML cells engrafted in the NSG-SGM3 recipient mouse BM. The numbers in the panels are the percentage of positive cells within total live cells. (F) Reduced CML engraftment from the CML CD34+CD38– cells cultured with NIH3-CXCL14 stroma in the BM of NSG-SGM3 mice at 10 to 12 weeks after transplantation. The tested CML cells were transplanted at 3 to 4 days after the coculture. Data were from 2 independent experiments on BM from 3 patients with CML. Each dot represents engraftment in a single recipient mouse. Horizontal bars indicate median values. The statistical difference was determined by unpaired t test.
CXCL14 overexpression in stromal cells suppresses CML CD34+CD38− cell growth in vitro and engraftment in the NSG-SGM3 mice. (A) Scheme representing the experimental design of coculture system. BM CD34+CD38– cells from 5 to 10 patients with newly diagnosed CML and 7 age-matched healthy donors (NBM) were sorted and cocultured with CXCL14-overexpressed NIH3 stromal cells (NIH3-CXCL14) or control NIH3 cells (NIH3-CTRL) for 3 to 7 days and analyzed by FACS and LTC-IC assay or transplanted into sublethally irradiated NSG-SGM3 mice. (B) Total cell numbers and LTC-ICs from NBM or CML CD34+CD38− cells cocultured with control or NIH3-CXCL14 stroma. The statistical difference was determined by paired t test. (C) The frequency of CD34+CD38– and CD15+CD66B+ myeloid cells generated from NBM or CML CD34+CD38– cells cocultured with control or NIH3-CXCL14 stroma. (D) Representative FACS profiles showing gating strategy of CD15+CD66B+CD33− myeloid cells and CD34+CD38– cells after the cocultures. The numbers in the panels are the percentage of positive cells within total live (PI–) cells. (E) Representative FACS profiles showing gating strategy of human CD45+ CML cells engrafted in the NSG-SGM3 recipient mouse BM. The numbers in the panels are the percentage of positive cells within total live cells. (F) Reduced CML engraftment from the CML CD34+CD38– cells cultured with NIH3-CXCL14 stroma in the BM of NSG-SGM3 mice at 10 to 12 weeks after transplantation. The tested CML cells were transplanted at 3 to 4 days after the coculture. Data were from 2 independent experiments on BM from 3 patients with CML. Each dot represents engraftment in a single recipient mouse. Horizontal bars indicate median values. The statistical difference was determined by unpaired t test.
To further assess the impact of CXCL14 on CML LSCs, we transplanted the CML CD34+CD38– cells (equivalent to 1000 starting CD34+CD38– cells) after 3 to 4 days coculture into sublethally irradiated NSG-SGM3 mice. At 8 or 12 weeks after transplantation, engraftment (hCD45+) in the BM of the CML cells cocultured with NIH3-CXCL14 cells was significantly lower than CML cells from the same donor cultured with the control-NIH3 (Figure 3E-F). Taken together, these results suggest a suppressive role of CXCL14 in the maintenance of CML LSCs.
CXCL14 suppresses CML LSC growth and sensitizes the effect of IM in vitro
Next, we explored the impact of recombinant CXCL14 proteins on the survival of CML CD34+CD38– LSCs during TKI treatment by LTC-IC and CAFC assays using primary normal and CML BM MSCs. To allow for maximal cell adhesion/migration to the BM MSCs, IM was added to the cocultures 2 days after seeding CML CD34+CD38− cells (Figure 4A). CXCL14 alone exerted a significant inhibitory effect on CML LSC survival regardless of being cultured with normal or CML BM MSCs (Figure 4B). It appeared that CML LSCs were more resistant to IM in the cocultures with NBM MSCs than in the cocultures with patient-derived CML MSCs (Figure 4B). We observed an additive inhibition from the combined treatment with CXCL14 and IM in the cocultures with CML MSCs but not with normal MSCs (Figure 4B). This might be because of the promoted proliferation of CML cells in the presence of CML MSCs, as shown in Figure 1. The inhibitory effect of CXCL14 and IM on CML LSC growth was also shown by CAFC assay using patient-derived BM MSCs, as revealed by one-way analysis of variance analysis (Figure 4C). This was further supported by no detectable CFU–granulocyte-macrophage-erythrocyte reflecting stem and progenitors in the residual CAFCs after treatment with CXCL14 or IM (Figure 4D). These data suggest a suppressive effect of CXCL14 on CML LSCs. Such an inhibition was not observed with normal BM CD34+CD38– cells (supplemental Figure 6), indicating a selective effect of CXCL14 on CML LSCs.

Recombinant CXCL14 inhibits CML CD34+CD38– LSC growth and promotes their response to TKI treatment in vitro. (A) Experimental design for assessing the effect of CXCL14 on CML CD34+CD38– LSCs by LTC-IC and CAFC assays using primary BM MSCs. FACS-sorted BM MSCs from healthy donors (NBM) or patients with CML were expanded and plated 1 day before seeding CML CD34+CD38− BM cells into the culture in presence of CXCL14 (10 ng/mL). Imatinib (IM, 0.5 μM) was added at 2 days after coculture initiation, and the cultures were maintained for 6 weeks. For CAFC assay, the colonies were counted and transferred to methylcellulose for CFU-C assay. (B) LTC-ICs derived from CML CD34+CD38– LSCs cocultured with NBM or CML MSCs. Horizontal bars represent median values, and each dot represents the mean of triplicate or duplicate measurements from an individual BM sample. The data were from 7 patients with CML. The differences were determined by paired t test and one-way analysis of variance Friedman test. Green and red dots indicate data from the same patient but from different culture experiments with different donor MSCs. (C) CAFCs derived from CML CD34+CD38– LSCs cocultured with CML MSCs. Horizontal bars represent mean values, and each dot represents triplicate measurements on an individual patient. Shown are normalized CAFCs based on that in the nontreated groups. The data were from 6 patients with CML. The statistical differences were determined by paired t test and 1-way analysis of variance Friedman test. (D) Lineage distribution within the CAFC-derived CFU-Cs after treatment in the cocultures of CML CD34+CD38– LSCs with CML MSCs. Data shown are from 1 representative patient included in the assay in panel C. See also supplemental Figure 6.
Recombinant CXCL14 inhibits CML CD34+CD38– LSC growth and promotes their response to TKI treatment in vitro. (A) Experimental design for assessing the effect of CXCL14 on CML CD34+CD38– LSCs by LTC-IC and CAFC assays using primary BM MSCs. FACS-sorted BM MSCs from healthy donors (NBM) or patients with CML were expanded and plated 1 day before seeding CML CD34+CD38− BM cells into the culture in presence of CXCL14 (10 ng/mL). Imatinib (IM, 0.5 μM) was added at 2 days after coculture initiation, and the cultures were maintained for 6 weeks. For CAFC assay, the colonies were counted and transferred to methylcellulose for CFU-C assay. (B) LTC-ICs derived from CML CD34+CD38– LSCs cocultured with NBM or CML MSCs. Horizontal bars represent median values, and each dot represents the mean of triplicate or duplicate measurements from an individual BM sample. The data were from 7 patients with CML. The differences were determined by paired t test and one-way analysis of variance Friedman test. Green and red dots indicate data from the same patient but from different culture experiments with different donor MSCs. (C) CAFCs derived from CML CD34+CD38– LSCs cocultured with CML MSCs. Horizontal bars represent mean values, and each dot represents triplicate measurements on an individual patient. Shown are normalized CAFCs based on that in the nontreated groups. The data were from 6 patients with CML. The statistical differences were determined by paired t test and 1-way analysis of variance Friedman test. (D) Lineage distribution within the CAFC-derived CFU-Cs after treatment in the cocultures of CML CD34+CD38– LSCs with CML MSCs. Data shown are from 1 representative patient included in the assay in panel C. See also supplemental Figure 6.
CXCL14 suppresses CML LSCs in vivo
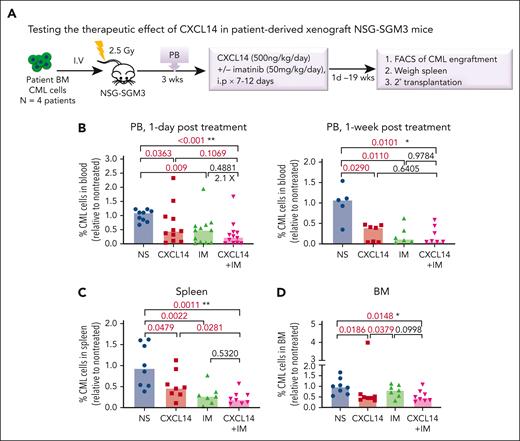
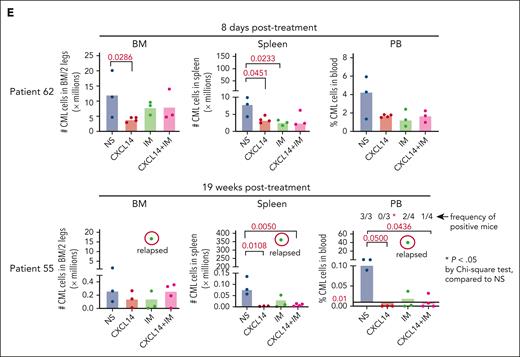
To further determine the therapeutic impact of CXCL14 on CML LSCs in vivo, we first established a xenografted mouse model by transplanting CML BM mononuclear cells into NSG-SGM3 mice (Figure 5A). At 3 weeks after transplantation, the mice with similar CML engraftment levels were distributed into 4 groups (supplemental Figure 7A) and treated with normal saline, CXCL14, IM, or the combination for 7 to 12 days. We did not observe any general side effects in the mice, and the blood cell counts, BM cellularity, and spleen size remained comparable with those of controls (supplemental Figure 7). A significant inhibition of CML engraftment in the spleen and blood but not the BM was detected after treatment with IM (Figure 5B-D; supplemental Figure 7B). Notably, CXCL14 treatment alone significantly inhibited CML engraftment in the blood, spleen, and BM, even to a greater degree than IM treatment in BM CML engraftment (Figure 5B-D; supplemental Figure 8A). It is worth emphasizing that, in cells from patients with suboptimal response to TKIs (BCR-ABL1 level >1% by 6 months after TKI initiation),42 CXCL14 inhibition persisted (Figure 5E). The CD34+ cell frequency in the recipient BM treated with CXCL14 was significantly lower than that in the IM-treated BM 8 days after the treatment discontinuation (supplemental Figure 8B-C), suggesting a possible stronger inhibition of CXCL14 compared with IM on CML LSCs. Serial transplantation of the residual CML cells showed a trend of decrease in the CML engraftment in secondary recipients receiving BM cells from primary recipients who had been treated with CXCL14 (supplemental Figure 8D). The mice treated with CXCL14 showed undetectable CML engraftment in the spleen and blood at 19 weeks after treatment whereas 2 of 4 mice treated with IM remained positive, with 1 showing relapse at 9 weeks after treatment (Figure 5E; supplemental Figure 8A). The combined treatment with CXCL14 and IM did not seem to further enhance inhibition of CML engraftment (Figure 5B). Altogether, these data suggest that CXCL14 strongly suppresses CML LSCs in vivo and might result in better treatment outcomes.
CXCL14 treatment in vivo suppresses CML cell engraftment in a patient-derived xenograft NSG-SGM3 mouse model. (A) Experimental design for assessing the in vivo effect of CXCL14 and IM on CML cell growth by xenograft transplantation into NSG-SGM3 mice. Primary BM MNCs from patients with CML were transplanted via tail vein into the NSG-SGM3 mice. Peripheral blood was collected at 3 weeks after transplantation to examine CML engraftment before treatment. The mice with similar CML engraftment were subjected to daily intraperitoneal injections of saline (NS), CXCL14, IM, or the combination for 7 to 12 days at the indicated doses. From 1 day to 19 weeks after the last injection, CML engraftment in the BM, spleen, and PB of the recipient mice were analyzed by FACS. (B-D) The relative frequencies of the CML cells in the recipient PB (B) at 1 day and 1 week after 7 to 12 days of treatment, and in the spleen (C) and BM (D) at the end points (1-8 days after treatment). The numbers in the panels are P values determined by unpaired t test; or ∗P < .05, ∗∗P < .01, by one-way analysis of variance Kruskal-Wallis test. (E) The CML engraftment derived from patients with CML with suboptimal response to TKI. The BM, spleen, and blood in the recipient mice were analyzed at the end point (when 1 of the mice showed symptoms) after 10- to 12-day treatments. The CML cell numbers were calculated based on the percentage of human CD45+ cells in each tissue type. The numbers in the lower right panel are frequencies of the mice with detectable CML cells (>0.01% of hCD45+ cells), defined based on the background staining in the mice that did not undergo transplantation. TKI suboptimal response: the patients who failed to reach <1% in BCR-ABL1 expression by polymerase chain reaction in blood by 6 months after TKI treatment initiation. The P values in the panels were determined by unpaired t test. Data were from 3 independent experiments on 3 patients with CML. Each dot represents CML engraftment in a single recipient mouse. Horizontal bars indicate median values. See also supplemental Figures 7-8.
RNA sequencing reveals molecular mechanisms of CXCL14 inhibition on CML LSCs
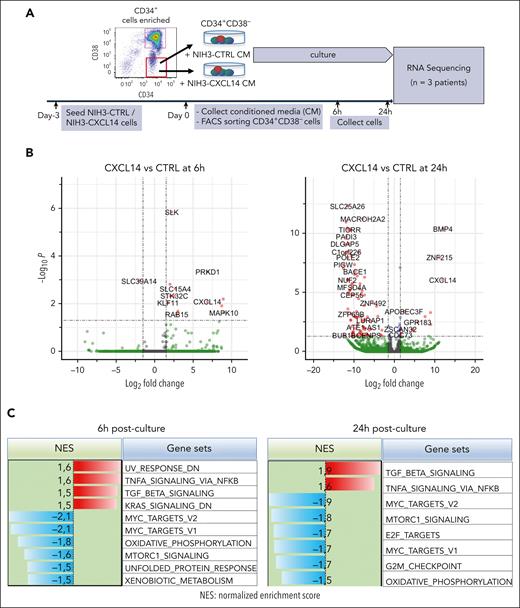
To determine the molecular mechanisms of CXCL14 action, we performed RNA sequencing of CML CD34+CD38– cells 6 and 24 hours after stimulation with conditioned media derived from NIH3-CTRL or NIH3-CXCL14 cells (Figure 6A). MTORC1 signaling and oxidative phosphorylation (OXPHOS) are known to be activated in CML cells and are critical to CML cell growth during TKI therapy.43-45 Consistent with the suppressive effect of CXCL14, after CXCL14 stimulation, the genes related to mTORC1 signaling and OXPHOS were downregulated in the CD34+CD38− cells (Figure 6B-E; supplemental Figure 9A-B). Specifically, OPA3, CYC1, and ATP2A2, known to be important for maintaining cell energy metabolism and growth,46,47 were markedly reduced (Figure 6E). Correspondingly, the MYC targets, E2F targets and G2M checkpoints that are downstream of these 2 pathways and BCR-ABL1 activation44,45,48 were downregulated (Figure 6C). Conversely, the TNF-α and transforming growth factor β signaling pathways were upregulated in the CML LSCs (Figure 6C-D). IL1RAP, reported to specifically mark CML LSCs,49,50 was lost in these cells after CXCL14 stimulation, suggesting possible selective loss of CML LSCs (Figure 6E). The upregulation of CSF3R is consistent with the promoted myeloid differentiation (Figure 3C) in the coculture with NIH3-CXCL14 cells. CXCL14 was undetectable in CML BM CD34+CD38– cells but upregulated after CXCL14 stimulation (supplemental Figure 4B; Figure 6C), which might facilitate the CXCL14-induced effect via an autocrine loop. These data suggest potential mechanisms for the functional impact of CXCL14 on CML cells (supplemental Figure 9C).
RNA sequencing reveals molecular changes in CML LSCs after CXCL14 stimulation. (A) Experimental setup. CML CD34+CD38– cells from the BM of patients with CML were sorted and cultured with conditioned media derived from NIH3-CXCL14 or NIH3-CTRL. The CML cells were collected at 6 and 24 hours and sorted directly into lysis buffer for subsequent RNA sequencing. Data were from 3 independent experiments with 3 patients with CML. (B) Volcano plots showing differentially expressed genes in the CML LSCs 6 hours and 24 hours after stimulation with CXCL14-CM compared with that with the control BM. FDR-q value represents the false discovery rate of the P values. (C) The upregulated and downregulated gene sets in the CML CD34+CD38− cells at 6 hours (left) and 24 hours (right) after stimulation with CXCL14-CM. Data are from 3 independent sorting experiments on 3 patients with CML. (D) The heatmap showing the top 25 dysregulated genes within the enriched gene sets of tumor necrosis factor alpha signaling and MYC targets_V2 in the CML CD34+CD38− cells at 6 hours after stimulation with CXCL14-CM. (E) RNA sequencing shows expressions of outer mitochondrial membrane lipid metabolism regulator (OPA3), cytochrome c1 (CYC1), ATPase sarcoplasmic/endoplasmic reticulum Ca2+ transporting 2 (ATP2A2), colony stimulating factor 3 receptor (CSF3R), and IL-1 receptor accessory protein (IL1RAP) in the CD34+CD38– cells at 6 hours and 24 hours after stimulation with CXCL14. The numbers in the panels are P values determined by unpaired t test. See also supplemental Figure 9. RPKM, reads per kilobase of transcript, per million mapped reads.
Reduced mitochondrial function of CML CD34+CD38– cells after CXCL14 stimulation
Next, we tested whether CXCL14-induced downregulation of MTORC1 signaling and OXPHOS could have any functional impact on the cells (Figure 7A). Among the selected downregulated genes, CYC1, a key component in mitochondrial respiratory chain, was confirmed to be reduced at protein level in the CML CD34+CD38– cells, 24 hours after CXCL14 stimulation (Figure 7B-D), which prompted us to explore the mitochondrial respiratory chain in these cells. Reactive oxygen species (ROS) are byproducts of OXPHOS and the mitochondrial respiratory chain. Consistent with reduced OXPHOS and CYC1, we detected reduced ROS in the cells whereas the mitochondrial mass remained unchanged (Figure 7E-F). To further examine the effect of CXCL14 on the mitochondrial function of CML cells, we adopted a FACS-based protocol51,52 on the CML cell line K562 to monitor their mitochondrial membrane potential (MMP), which has to be maintained by mitochondrial respiratory chain, thus, reflecting mitochondrial function (Figure 7G). The basal MMP after CXCL14 stimulation was comparable with that of nontreated cells. However, after the addition of pyruvate/malate to measure complex I activity, the MMP of CXCL14-stimulated K562 was reduced (Figure 7H), suggesting that CXCL14 treatment may impair mitochondrial function.

Reduced mitochondrial respiratory activities in CML CD34+CD38− cells 24 hours after CXCL14 stimulation. (A) Experimental setup. BM cells from patients with primary CML were first stimulated with recombinant CXCL14 proteins or phosphate buffered saline (PBS) for 24 hours and collected for the detection of mitochondrial mass, ROS, mTOR, and OXPHOS pathway by FACS. (B) FACS profile showing gating strategy for CML CD34+CD38– cells 24 hours after CXCL14 stimulation. (C) Representative histograms showing expression of CYC1, ATP2A2, phospho mTOR, OPA3, and SLC25A26. (D) The mean fluorescent intensities (MFI) of CYC1, ATP2A2, phospho mTOR, OPA3, and SLC25A26 in the CD34+CD38– BM cells. Each dot represents data from 1 patient with CML. The numbers in the panel are P values determined by paired t test. (E) Histograms showing mitochondrial mass and ROS intensity in the CML CD34+CD38– cells. (F) MFI of mitotracker red and ROS staining in the CD34+CD38– BM cells. Each dot represents data from 1 patient with CML. The numbers in the panel are P values determined by paired t test. (G) Experimental setup for monitoring MMP by tetramethylrhodamine staining in K562 CML cells 24 hours after stimulation with CXCL14. The cells stimulated by PBS or CXCL14 were separated by CellTrace violet, and their MMPs were recorded continuously before and after the additions of complex I stimulus malate and pyruvate, and subsequently, OXPHOS uncoupler carbonyl cyanide-4 (trifluoromethoxy) phenylhydrazone (FCCP). (H) Representative FACS profile showing dynamics of MMP (tetramethylrhodamine intensity) in the K562 cells after stimulation with PBS or CXCL14. The arrows indicate the addition of the corresponding reagents. See also supplemental Figure 9.
Reduced mitochondrial respiratory activities in CML CD34+CD38− cells 24 hours after CXCL14 stimulation. (A) Experimental setup. BM cells from patients with primary CML were first stimulated with recombinant CXCL14 proteins or phosphate buffered saline (PBS) for 24 hours and collected for the detection of mitochondrial mass, ROS, mTOR, and OXPHOS pathway by FACS. (B) FACS profile showing gating strategy for CML CD34+CD38– cells 24 hours after CXCL14 stimulation. (C) Representative histograms showing expression of CYC1, ATP2A2, phospho mTOR, OPA3, and SLC25A26. (D) The mean fluorescent intensities (MFI) of CYC1, ATP2A2, phospho mTOR, OPA3, and SLC25A26 in the CD34+CD38– BM cells. Each dot represents data from 1 patient with CML. The numbers in the panel are P values determined by paired t test. (E) Histograms showing mitochondrial mass and ROS intensity in the CML CD34+CD38– cells. (F) MFI of mitotracker red and ROS staining in the CD34+CD38– BM cells. Each dot represents data from 1 patient with CML. The numbers in the panel are P values determined by paired t test. (G) Experimental setup for monitoring MMP by tetramethylrhodamine staining in K562 CML cells 24 hours after stimulation with CXCL14. The cells stimulated by PBS or CXCL14 were separated by CellTrace violet, and their MMPs were recorded continuously before and after the additions of complex I stimulus malate and pyruvate, and subsequently, OXPHOS uncoupler carbonyl cyanide-4 (trifluoromethoxy) phenylhydrazone (FCCP). (H) Representative FACS profile showing dynamics of MMP (tetramethylrhodamine intensity) in the K562 cells after stimulation with PBS or CXCL14. The arrows indicate the addition of the corresponding reagents. See also supplemental Figure 9.
Discussion
The persistence of residual LSCs is the main cause of treatment failure and relapse in CML.4 There is a great demand to identify new therapeutic options targeting CML LSCs to prevent CML relapse, particularly after TKI treatment discontinuation. Many attempts have been made to search for overexpressed molecules as therapeutic targets to prevent leukemia recurrence. However, the drugs that target these molecules often cause severe side effects because the targets are also expressed in normal cells.53-55 On the contrary, restoration of the downregulated molecules may be more promising for treating cancers without strong side effects because they are abundantly present in normal cells.
Herein, our study identifies CXCL14 as a new therapeutic option for treating CML. Through molecular characterization of freshly isolated BM stromal cells from patients with CML at diagnosis, we have identified a set of dysregulated niche factors in CML MSCs and ECs. Among them, CXCL14 is lost in CML BM cellular niches, and, importantly, restoring CXCL14 expression inhibits CML LSC growth in vitro and CML engraftment after transplantation. Recombinant CXCL14 proteins inhibit CML LSC survival and enhance TKI inhibitory effects on the CML LSCs in LTC-IC and CAFC assays. Notably, CXCL14 single treatment of mice with xenografts derived from patients with CML significantly inhibited CML engraftment, even to a greater degree than IM. The inhibition persisted in patients with suboptimal TKI response. Mechanistically, CXCL14 upregulates inflammatory cytokine signaling but downregulates mTORC and OXPHOS signaling pathways, accompanied by impaired mitochondrial respiratory function. This finding is consistent with previous reports that mTOR signaling inhibition sensitizes CML LSC response to TKI.44,45,56,57
CXCL14 is a CXC chemokine highly conserved in mammals, with only a 2–amino acid difference between mice and humans, and was initially identified in breast and kidney cells,58 thus termed BRAK. CXCL14 shares high amino acid sequence conservation with CXCL12,59 which is known to be important in maintaining normal hematopoiesis60,61 and protecting CML LSCs during TKI treatment.25,62 However, CXCL14 has a unique 5–consecutive amino acid insertion, which is different to CXCL11 and CXCL12, and is essential for its degradation in cancer cells.63 Recently, a G-protein–coupled receptor ACKR2 has been identified to mediate CXCL14 function in a breast cancer model.64 Nevertheless, CXCL14-equivalent receptors in CML remain to be identified.
CXCL14 plays a controversial role in solid cancers.65-69 Low CXCL14 expression may result in low recruitment of dendritic cells, thus inhibiting their ability to initiate antitumor immune responses.70 Reexpression of CXCL14 suppresses solid cancer growth and progession.71 However, high CXCL14 expression in the stroma is reportedly associated with shorter survival in breast cancer.72 Here, we found that CXCL14 is exclusively expressed in normal human BM stromal cells, suggesting that BM stromal cells might be the major cellular resources for CXCL14 in human BM, and that any changes in CXCL14 expression in these cells may have biological consequences. Along with this, enforced CXCL14 expression in the stroma promoted CML LSC differentiation at the expense of their self-renewal. Altogether, our data suggest that restoring CXCL14 may be a promising therapeutic option for treating CML.
Several mechanisms have been proposed for the tumor suppressive effects of CXCL14 in solid cancer, such as CXCL14-induced immune cell recruitment, cell cycle arrest, and suppressed angiogenesis.73 Here, we show that CXCL14 may act through downregulating OXPHOS, accompanied by declined mitochondrial respiratory function and ROS levels in the CML LSCs, which might lead to disturbed energy metabolism and induced susceptibility to apoptosis in the LSCs. However, other mechanisms might be involved in this regulation. IL1RAP, a marker reportedly specifically expressed in CML LSCs,49,50 became undetectable in the CD34+CD38− cells after CXCL14 stimulation, pointing to a possible selective loss of CML LSCs.
In addition to CXCL14, we found the downregulation of several other factors in the CML MSCs. This includes KIT ligand, LAMA4, and IL-32. We recently reported that Lama4 loss in BM MSCs increases AML proliferation and chemoresistance,35 meriting future studies on the impact of LAMA4 expression on CML progression. PTPN11 is critical for the survival and maintenance of normal HSPCs74 and its activating mutation in mesenchymal progenitor cells has been shown to evoke MPN.21 It is upregulated in the CML MSCs. These changes may collectively contribute to the functional alterations of CML MSCs including their hematopoiesis-supportive function and differentiation. More work is required to elucidate the exact impact of these niche alterations.
In conclusion, our study has revealed molecular and functional characteristics of BM stromal cells in patients with CML and loss of CXCL14 in BM stromal cells in these patients at diagnosis. Restoring CXCL14 suppressed CML LSC survival, presumably by downregulation of mTORC signaling and OXPHOS associated with reduced mitochondrial dysfunction and MYC targets (supplemental Figure 9C). Importantly, CXCL14 treatment inhibits engraftment of CML cells from patients who failed to optimally respond to TKIs. Together, our study has identified CXCL14 as a promising therapeutic option targeting CML LSCs.
Acknowledgments
The authors thank Johannis Klang and Monika Jansson for their technical assistance. All major computations were performed on resources provided by the Swedish National Infrastructure for Computing through Uppsala Multidisciplinary Center for Advanced Computational Science under project b2014299 migrated to sens2018540. The authors also thank the core facility at NEO, BEA, Bioinformatics and Expression Analysis, which is supported by the board of research at the Karolinska Institute (KI) and the research committee at the Karolinska University Hospital. FACS analysis and cell sorting were performed at MedH Flow Cytometry core facility (KI), supported by KI/Stockholms läns landsting.
This work was supported by the Swedish Research Council (2019-01361, 2022-01228), Swedish Childhood Society (PR2015-0142, FoAss13/015, PR2017/0154, and PR2020-0166), Swedish Cancer Society (CAN2017/774, 19 0092 SIA, and 20 1222 PjF), Åke Olsson foundation, Radiumhemmets Forskningsfonder and Karolinska Institute Wallenberg Institute for Regenerative Medicine, Karolinska Institute Doctoral Education (KID) funding (2-1293/2014, 2021-00480), Stiftelsen Clas Groschinskys Minnesfond (M16 50), the Knut and Alice Wallenberg Foundation (KAW 2020.0102), Cancer Research KI (Karolinska Institute), Incyte Biosciences Nordic, and Blodcancerfonden (H.Q.), and Nordic Cancer Union and Cancer Foundation Finland (S.M.).
Authorship
Contribution: M.D., H.C., and A.M. participated in experimental design, performing experiments, collection and assembly of data, data analysis and interpretation, and figure preparation; J.S., E.L., J.P.M., P.X., Y.G., M.C., L. Sandhow, M.K., T.B., and A.-S.J. performed experiments, collected data, and analyzed data; X.L., L. Stenke, U.O.-S., S.M., and M.E. contributed to data analysis and interpretation; S.S., M.J., K.L.B., S.D., J.U., E.H.-L., S.L., and M.T. contributed to sample collection and data analysis; A.O. contributed to the NIH3-CXCL14 cells and provided scientific input; M.S. contributed to the RNA sequencing; H.Q. designed the study, performed some experiments, collected and analyzed data, prepared figures, and wrote the manuscript; and all authors approved the final version of the manuscript.
Conflict-of-interest disclosure: The authors declare no competing financial interests.
Correspondence: Hong Qian, Center for Hematology and Regenerative Medicine, Department of Medicine Huddinge, Karolinska Institute, Neo, Floor 7, HERM, 141 86 Stockholm, Sweden; e-mail: hong.qian@ki.se.

This feature is available to Subscribers Only
Sign In or Create an Account Close Modal