Key Points
Regulatory T cells modulate Tcon transcriptome during GVHD suppression by affecting several nonredundant pathways.
Regulatory T cells undergo activation and clonal expansion during GVHD suppression.
Abstract
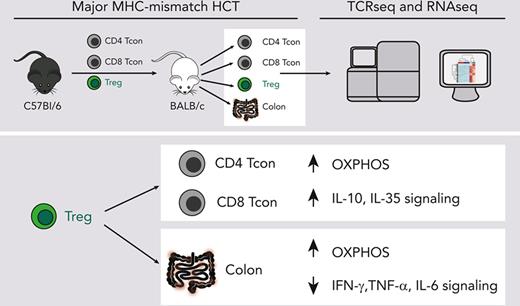
CD4+FOXP3+ regulatory T cells (Tregs) have demonstrated efficacy in the prevention and treatment of graft-versus-host disease (GVHD). Preclinical and clinical studies indicate that Tregs are able to protect from GVHD without interfering with the graft-versus-tumor (GVT) effect of hematopoietic cell transplantation (HCT), although the underlying molecular mechanisms are largely unknown. To elucidate Treg suppressive function during in vivo suppression of acute GVHD, we performed paired T-cell receptor (TCRα and ΤCRβ genes) repertoire sequencing and RNA sequencing analysis on conventional T cells (Tcons) and Tregs before and after transplantation in a major histocompatibility complex –mismatched mouse model of HCT. We show that both Tregs and Tcons underwent clonal restriction, and Tregs did not interfere with the activation of alloreactive Tcon clones and the breadth of their TCR repertoire but markedly suppressed their expansion. Transcriptomic analysis revealed that Tregs predominantly affected the transcriptome of CD4 Tcons and, to a lesser extent, that of CD8 Tcons, thus modulating the transcription of genes encoding pro- and anti-inflammatory molecules as well as enzymes involved in metabolic processes, inducing a switch from glycolysis to oxidative phosphorylation. Finally, Tregs did not interfere with the induction of gene sets involved in the GVT effect. Our results shed light onto the mechanisms of acute GVHD suppression by Tregs and will support the clinical translation of this immunoregulatory approach.
Introduction
Allogeneic hematopoietic cell transplantation (HCT) is a well-established and potentially curative therapy for a broad range of hematologic malignancies due to the graft-versus-tumor (GVT) effect. Unfortunately, allogeneic HCT is still associated with significant morbidity and mortality related to cancer relapse and transplantation complications, namely graft-versus-host disease (GVHD). The immunological mechanism responsible for GVHD, that is donor T-cell alloreactivity toward host antigens, is also responsible for the beneficial GVT effect of allogeneic HCT.1 Because of the interconnection between these 2 phenomena, none of the currently used strategies for GVHD prevention and treatment can efficiently target GVHD without affecting GVT.
Immunoregulatory cellular therapies are a promising approach for GVHD prevention and treatment.2,3 We, and others, have previously shown in preclinical murine models that CD4+FOXP3+ regulatory T cells (Tregs) are able to protect from GVHD without interfering with the GVT effect of HCT.4-6 There are ongoing efforts to translate the use of Treg adoptive transfer for GVHD prevention7-10 and treatment11,12 to clinical settings with promising results.
The precise cellular and molecular mechanisms underlying GVHD suppression by Tregs are not completely understood. Two nonexclusive and potentially complementary models exist: Tregs could quantitatively affect T-cell responses by limiting the activation and expansion of alloreactive T-cell clones and/or might qualitatively modulate T-cell function by selectively interfering with pathways responsible for GVHD but dispensable for GVT. To gain further insights in support of one or the other of these models, we performed paired T-cell receptor (TCR) and RNA sequencing analysis on Tcons and Tregs before and after transplantation using a major histocompatibility complex–mismatched mouse model for acute GVHD.
Material and methods
Acute GVHD murine model
Donor CD4+ and CD8+ conventional T cells (Tcons) were separately isolated from splenocytes harvested from CD45.1 Thy1.1 luc+ C57Bl/6 mice via negative enrichment (STEMCELL Technologies). T-cell–depleted bone marrow (TCD-BM) cells were prepared from CD45.1 Thy1.2 C57Bl/6 mice by first crushing bones, followed by T-cell depletion using CD4 and CD8 MicroBeads (Miltenyi Biotec). CD45.2 Thy1.2 FoxP3/GFP+ CD4+ Tregs from CD8/CD19-depleted single-cell suspensions from the spleens and lymph nodes of CD45.2 Thy1.2 FoxP3GFP+ C57Bl/6 mice were sorted using a fluorescence-activated cell sorter (FACS), BD FACS Aria II. CD45.2 Thy1.2 BALB/c mice were lethally irradiated (8.8 Gy) and received transplantation with 5 × 10⁶ TCD-BM cells from either CD45.1 Thy1.2 C57Bl/6 mice alone or together with CD45.2 Thy1.2 C57Bl/6 FoxP3/GFP+ Tregs (1 × 10⁶) on day 0. On day 2, CD45.1+ Thy1.1+ C57Bl/6 Tcons (1 × 10⁶; CD4:CD8 ratio, 2:1) were injected into the mice to induce GVHD. Irradiated (11 Gy) syngeneic C57Bl/6 recipients receiving C57Bl/6 CD45.1+ Thy1.2+ TCD-BM and CD45.1+ Thy1.1+ Tcons were used as controls. Mice were monitored daily, and body weight and GVHD score were assessed weekly.
Cell isolation
Recipient mice were euthanized 8 days after HCT (6 days after Tcon adoptive transfer), and single-cell suspensions were obtained from spleens and lymph nodes. Cells from 3 animals per group were pooled to obtain 2 biological replicates in each of the 2 independent experiments. After Fc block (Miltenyi), cells were incubated with the following antibodies (BioLegend): CD4 (BV421), CD8 (BV605), Thy1.1 (phycoerythrin [PE]), CD45.1 (PE-Cy7), CD45.2 (allophycocyanin [APC]), H-2kd (biotin), and CD19 (biotin) followed by streptavidin APC-Fire. Donor-derived Thy1.1+ CD45.1+ CD4 and CD8 Tcons as well as Thy1.2+ CD45.2+ CD4+ FoxP3/GFP+ Tregs were FACS-sorted. Tcons and Tregs either taken from the donor aliquot before injection or recovered at day 8 after HCT were frozen in TRIzol reagent (Thermo Fisher Scientific) and conserved at −80°C until analysis.
Supplemental methods
Animals used in the study as well as materials and methods used for bioluminescent imaging, genomics analyses, histopathological analyses, and statistical analyses are detailed in the supplemental Methods, available on the Blood website.
Results
Treg treatment inhibited Tcon expansion and target tissue infiltration without affecting their TCR repertoire breadth
We used a well-established mouse model of GVHD, in which Tregs were transferred at time of HCT, 2 days before the adoptive transfer of Tcons.13 As previously described, mice treated with Tregs before Tcon transfer showed significantly improved survival and GVHD scores compared with mice receiving Tcons alone (supplemental Figure 1A). The use of Tcons isolated from luciferase+ donors revealed that this effect was associated with a significant reduction of Tcon expansion at day 8 after transplantation (day 6 after Tcon administration; supplemental Figure 1B-C). At this time point, previously reported to be the peak of Tcon expansion,14 Treg treatment also affected the localization of luc+ Tcons. The Tcon-derived signal was mainly restricted to secondary lymphoid organs (SLO) (spleen and lymph nodes) and reduced in the abdominal region for mice receiving Tregs compared with untreated mice with GVHD (supplemental Figure 1B).
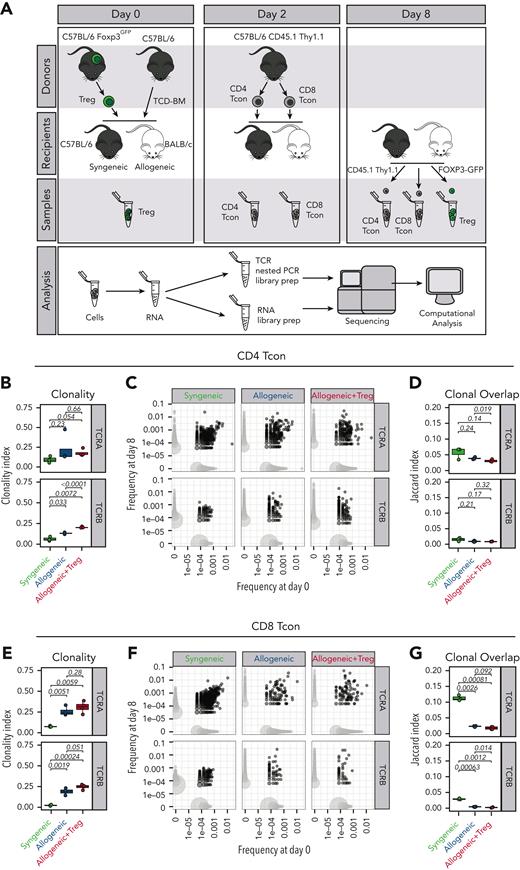
Based on these results, we first hypothesized that Tregs would inhibit the expansion of alloreactive clones during GVHD by controlling the TCR repertoire breadth, similar to what has been previously shown during antiviral responses.15 To test this hypothesis, at day 8 after HCT, we reisolated donor-derived CD45.1+ Thy 1.1+ CD4 and CD8 Tcons previously administered to syngeneic CD45.2+ C57Bl/6 mice or allogeneic CD45.2+ BALB/c mice in the presence or absence of CD45.2+ FOXP3GFP+ Tregs (Figure 1A). As expected, the analysis of the TCR repertoire based on the sequencing of the TCRα and TCRβ chains revealed a significant clonal restriction of both CD4 (Figure 1B, left panel) and CD8 (Figure 1C, left panel) Tcons recovered from allogeneic HCT recipients compared with Tcons from syngeneic HCT recipients. Importantly, such clonal restriction in allogeneic HCT recipients was not inhibited by Treg treatment (Figure 1B-C, left panels). Clonal overlap between Tcons collected at day 8 and those collected before injection was reduced in allogeneic HCT recipients compared with syngeneic controls (Figure 1B-C, middle panels) and Tregs did not inhibit such reduction in clonal overlap (Figure 1B-C, right panels). Collectively, our data indicate that Tregs affected the expansion and the localization of Tcons after HCT without affecting the TCR repertoire breadth of Tcons and the initial activation of alloreactive T-cell clones during GVHD.
Tregs did not affect the TCR breadth of Tcons after HCT. (A) Schematic representation of the experimental pipeline. On day 0, Balb/c or C57Bl/6 recipient mice were lethally irradiated and received transplantation with 5 × 10⁶ CD45.1+ Thy 1.2+ TCD-BMs with or without 1 × 10⁶ Foxp3GFP Tregs from C57Bl6 donors. On day 2, 1 × 10⁶ CD45.1+ Thy1.1+ Tcons from C57Bl/6 donors were injected. GFP+ donor Tregs and CD45.1+ Thy1.1+ CD4 and CD8 donor Tcons before transplantation (day 0 of 2) and isolated on day 8 were used for sequencing analysis. (B-G) Clonality of the TCRA and TCRB repertoire in CD4 (B) and CD8 (E) Tcons recovered at day 8 after HCT in syngeneic recipients (green box and symbols), allogeneic recipients (blue box and symbols), and allogeneic recipients receiving Tregs (red box and symbols). Representative example of overlap of the TCRA and TCRB repertoire in CD4 (C) and CD8 (F) Tcons before transplantation and at day 8 after HCT (left panels). Scatter plots (C,F) represent clone frequencies before and after HCT and the number of unique clones (dot size). Clones that are only observed at 1 time point are colored in light gray, whereas overlapping clones are colored in dark gray. Repertoire overlap in CD4 (D) and CD8 (G) Tcons recovered at day 8 after HCT and before injection quantified using the Jaccard index of similarity. Groups were compared using a nonparametric Mann–Whitney U test and P values are shown.
Tregs did not affect the TCR breadth of Tcons after HCT. (A) Schematic representation of the experimental pipeline. On day 0, Balb/c or C57Bl/6 recipient mice were lethally irradiated and received transplantation with 5 × 10⁶ CD45.1+ Thy 1.2+ TCD-BMs with or without 1 × 10⁶ Foxp3GFP Tregs from C57Bl6 donors. On day 2, 1 × 10⁶ CD45.1+ Thy1.1+ Tcons from C57Bl/6 donors were injected. GFP+ donor Tregs and CD45.1+ Thy1.1+ CD4 and CD8 donor Tcons before transplantation (day 0 of 2) and isolated on day 8 were used for sequencing analysis. (B-G) Clonality of the TCRA and TCRB repertoire in CD4 (B) and CD8 (E) Tcons recovered at day 8 after HCT in syngeneic recipients (green box and symbols), allogeneic recipients (blue box and symbols), and allogeneic recipients receiving Tregs (red box and symbols). Representative example of overlap of the TCRA and TCRB repertoire in CD4 (C) and CD8 (F) Tcons before transplantation and at day 8 after HCT (left panels). Scatter plots (C,F) represent clone frequencies before and after HCT and the number of unique clones (dot size). Clones that are only observed at 1 time point are colored in light gray, whereas overlapping clones are colored in dark gray. Repertoire overlap in CD4 (D) and CD8 (G) Tcons recovered at day 8 after HCT and before injection quantified using the Jaccard index of similarity. Groups were compared using a nonparametric Mann–Whitney U test and P values are shown.
Treg treatment affected CD4 and to a lesser extent CD8 Tcon transcriptome during GVHD
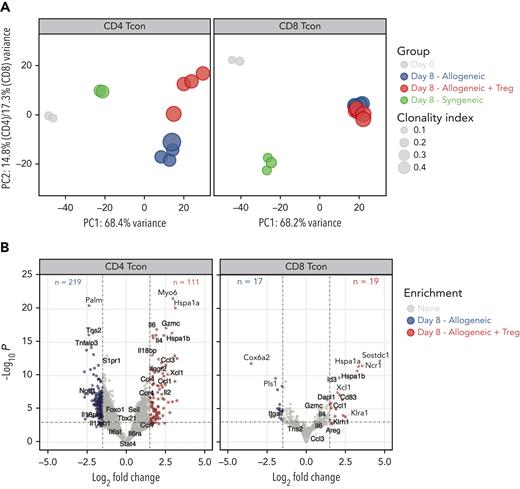
Next, we evaluated the impact of Treg treatment on CD4 and CD8 Tcons at the transcriptomic level. Principal component (PC) analysis of the top 1000 most differentially expressed genes across all samples revealed that 68% of the variance was explained in PC1, which clearly segregated CD4 and CD8 Tcons recovered at day 8 from allogeneic recipients from cells before injection or recovered from syngeneic recipients (Figure 2A), revealing a dominant effect of the allogeneic transplant procedure on the different T-cell populations. PC1 was mainly driven by naive T-cell genes (Ccr7, Sell, Il6ra, Il6st, Foxo1) that were progressively downregulated along PC1, pointing to T-cell activation/effector differentiation as a main element affected by the transplantation into allogeneic mice and, to a lesser extent, into syngeneic recipients (Figure 2A). The impact of Tregs on CD4 and CD8 Tcon transcriptome was revealed in PC2 (Figure 2A), which contributed to 14.8% and 17.3% of the variance in CD4 and CD8 Tcons, respectively. Treg treatment mainly affected CD4 Tcon transcriptome (Figure 2A, left panel), inducing the downregulation of 219 genes and the upregulation of 111 genes (Figure 2B, left panel) compared with Tcons in the absence of Tregs. In particular, Treg coadministration induced the downregulation of proinflammatory genes (Il18rap) and of Th1-signature genes (Tbx21, Il12rb1, Il12rb2) compared with Tcons injected alone. However, compared with resting cells (day 0) or with cells injected into syngeneic recipients, Tregs still allowed significant upregulation of Tbx21, encoding for the Th1-master regulator transcription factor T-bet (supplemental Figure 2). Tregs promoted the upregulation of anti-inflammatory genes (Il18bp) and Th2 signature genes (Ccr4, Il4) in CD4 Tcons (Figure 2B left panel; supplemental Figure 2). Conversely, only a limited impact of Treg treatment was observed on CD8 Tcons (Figure 2A, right panel), with only 19 genes upregulated and 17 genes downregulated (Figure 2B, right panel) in Treg-treated CD8 Tcons compared with those in untreated CD8 Tcons. Collectively, these results revealed that Tregs did not interfere with the major transcriptomic changes associated with T-cell activation/effector differentiation during GVHD but exerted a CD4-dominant immunomodulatory effect on lineage-specific genes suppressing Th1 differentiation.
Tregs modulated CD4 and, to a lesser extent, CD8 Tcon transcriptome during GVHD. (A) Principal component analysis of transcriptome based on the top 1000 differentially expressed genes across all CD4 (left) and CD8 (right) Tcon samples. (B) Volcano plots showing significance and log2 fold change of transcripts from Tregs treated CD4 (left) and CD8 (right) Tcons compared with those from untreated Tcons. Vertical dashed lines on volcano plots indicate a log2 fold change of 1.5; horizontal dashed line indicates an adjusted P value = .05.
Tregs modulated CD4 and, to a lesser extent, CD8 Tcon transcriptome during GVHD. (A) Principal component analysis of transcriptome based on the top 1000 differentially expressed genes across all CD4 (left) and CD8 (right) Tcon samples. (B) Volcano plots showing significance and log2 fold change of transcripts from Tregs treated CD4 (left) and CD8 (right) Tcons compared with those from untreated Tcons. Vertical dashed lines on volcano plots indicate a log2 fold change of 1.5; horizontal dashed line indicates an adjusted P value = .05.
Tregs underwent clonal restriction and activation during GVHD suppression
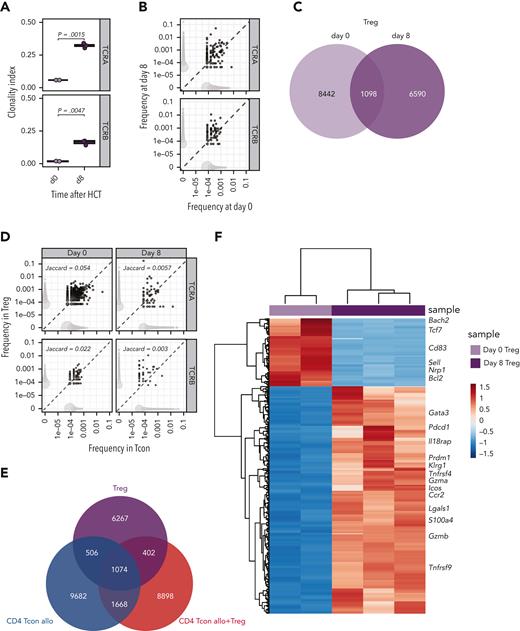
Next, we performed the same integrated analysis of the TCR repertoire and the transcriptome on Tregs during GVHD suppression. Similar to what we had observed in Tcons, Tregs underwent clonal restriction during GVHD suppression, as revealed by a significantly increased TCRα and TCRβ clonality index at day 8 compared with that before injection (Figure 3A). Accordingly, we observed only limited TCR overlap between day-0 and day-8 Tregs (Figure 3B-C). These results indicated that during GVHD suppression Tregs underwent clonal restriction to a similar extent as CD4 Tcons (Figure 1B). To assess whether Tregs and CD4 Tcons reacted to the same antigens during GVHD, we subsequently compared the TCR repertoire of these 2 subpopulations. We observed a small clonal overlap between Tregs and CD4 Tcons before injection, and this was further reduced at day 8 after transplantation (Figure 3D-E), suggesting that Tregs and CD4 Tcons responses during GVHD engage different cell clonotypes triggered by different epitopes or antigens. The increased activation state of Tregs during GVHD suppression was further supported by the transcriptomic analysis revealing downregulation of genes characterizing naive Tregs (Sell) and upregulation of several genes involved in the activation, such as Icos, Tnfrsf4 (encoding the costimulatory molecule OX40), Ccr2, Klrg1, and Gzmb (Figure 3F). After transplantation, Tregs preserved the distinct transcriptomic signature observed before injection (supplemental Figure 3A), further enhanced by the upregulation of genes involved in Treg activation and suppressive function (Ccr4, Ccr8, Gata3, Il9r, Il2ra, Il10, Tnfrsf18, Tnfrsf4, Areg) (supplemental Figure 3B). Collectively, these data indicate that during GVHD suppression Tregs undergo activation and clonal restriction similarly to that observed in CD4 Tcons, although the analysis of the TCR repertoire of the 2 populations indicated divergence rather than similarity between Tregs and CD4 Tcons during GVHD.
Tregs underwent clonal restriction of the TCR repertoire and activation during GVHD suppression. (A) Clonality of the TCRA and TCRB repertoire in Tregs at day 0 (light pink box and symbols) and day 8 (purple box and symbols) after HCT. (B) Representative example of overlap of the TCRA and TCRB repertoire in Tregs before transplantation and at day 8 after HCT. Scatter plots represent frequency of clones before and after HCT, and the number of unique clones (dot size). Clones that are observed at only 1 time point are colored in light gray, whereas overlapping clones are colored in dark gray. (C) Venn diagram representing the number of overlapping and nonoverlapping clones between day-0 (light pink box and symbols) and day-8 (purple box and symbols) Tregs. (D) Representative example of overlap of the TCRA and TCRB repertoire in CD4 Tcons (x-axis) and Tregs (y-axis) at day 8 after HCT in allogeneic mice receiving both Tcons and Tregs. Scatter plots represent frequencies of clones in Tcons and Tregs, and the number of unique clones (dot size). Clones that are observed in only 1 population are colored in light gray, whereas overlapping clones are colored in dark gray. Jaccard indexes are indicated. (E) Venn diagram representing the number of overlapping and nonoverlapping clones between Tregs and Tcons treated or not treated with Tregs recovered at day 8 after HCT. (F) Heatmap and hierarchical clustering based on the 500 most highly differentially expressed genes across all samples. Immune-related genes are highlighted. Expression for each gene is scaled (z scored) across single rows.
Tregs underwent clonal restriction of the TCR repertoire and activation during GVHD suppression. (A) Clonality of the TCRA and TCRB repertoire in Tregs at day 0 (light pink box and symbols) and day 8 (purple box and symbols) after HCT. (B) Representative example of overlap of the TCRA and TCRB repertoire in Tregs before transplantation and at day 8 after HCT. Scatter plots represent frequency of clones before and after HCT, and the number of unique clones (dot size). Clones that are observed at only 1 time point are colored in light gray, whereas overlapping clones are colored in dark gray. (C) Venn diagram representing the number of overlapping and nonoverlapping clones between day-0 (light pink box and symbols) and day-8 (purple box and symbols) Tregs. (D) Representative example of overlap of the TCRA and TCRB repertoire in CD4 Tcons (x-axis) and Tregs (y-axis) at day 8 after HCT in allogeneic mice receiving both Tcons and Tregs. Scatter plots represent frequencies of clones in Tcons and Tregs, and the number of unique clones (dot size). Clones that are observed in only 1 population are colored in light gray, whereas overlapping clones are colored in dark gray. Jaccard indexes are indicated. (E) Venn diagram representing the number of overlapping and nonoverlapping clones between Tregs and Tcons treated or not treated with Tregs recovered at day 8 after HCT. (F) Heatmap and hierarchical clustering based on the 500 most highly differentially expressed genes across all samples. Immune-related genes are highlighted. Expression for each gene is scaled (z scored) across single rows.
Paired transcriptomic analysis of Tregs and Tcons identified interleukin-10 (IL-10) and IL-35 as potential mechanisms of GVHD suppression
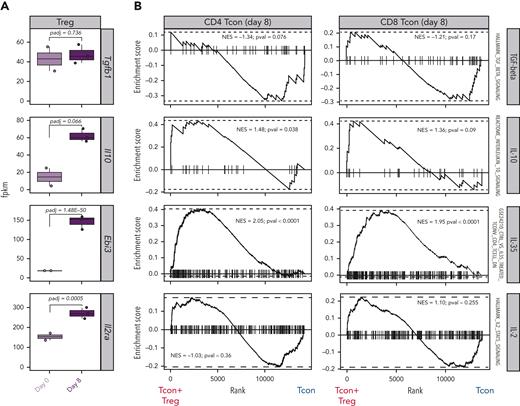
Tregs use a wide range of mechanisms to suppress immunopathological processes, ranging from the production of immunosuppressive molecules to the metabolic modulation of target cells.16,17 To deduce the dominant mechanisms of suppression used by Tregs to control GVHD from transcriptomic data, we analyzed the transcript expression of suppressive molecules in Tregs before and after HCT as well as the expression of gene sets induced by such molecules in Tcons. We did not observe any differences in Tgfb gene expression between Tregs obtained before injection (day 0) and Tregs recovered at day 8 after HCT (Figure 4A). Accordingly, gene set enrichment analysis (GSEA) of transforming growth factor–β–induced genes did not reveal any differences between Tcons treated or not treated with Tregs (Figure 4B). Conversely, Tregs at day 8 after HCT expressed higher transcript levels of Il10 and Ebi3, encoding for 1 of the 2 subunits constituting IL-35, compared with Tregs before injection (Figure 4A). Accordingly, GSEA revealed a significant enrichment of IL-10–induced genes in CD4 Tcons and IL-35–induced genes in CD4 and CD8 Tcons (Figure 4B). Finally, the day-8 Tregs displayed a significant upregulation of the Il2ra gene, encoding the α-chain of the Il-2 receptor (Figure 4A). In addition to being a constitutively expressed marker in Tregs that is further upregulated during activation, IL-2RA is also essential in the IL-2 deprivation of Tcons, an additional Treg mechanism of suppression.18,19 GSEA for IL-2–induced genes in Tcons did not reveal any significant difference between Tcons recovered from mice treated or not treated with Tregs (Figure 4B). Collectively, our transcriptomic results support the involvement of IL-10 and IL-35 production by Tregs and their downstream signaling in Tcons as major mechanisms of suppression of GVHD by Tregs.
Paired transcriptomic analysis of Tcons and Tregs identified mechanisms of GVHD suppression. (A) Transcript expression of genes encoding for molecules involved in classical Treg mechanisms of suppression. (B) Enrichment plots displaying enrichment scores for the genes involved in Tgfb (HALLMARK_TGF_BETA_SIGNALING), Il10 (REACTOME_INTERLEUKIN_10_SIGNALING), Il35 (GSE24210_CTRL_VS_IL35_TREATED_TCONV_CD4_TCELL_DN), and Il2 (HALLMARK_IL2_STAT5_SIGNALING) in CD4 (left) and CD8 (right) Tcons recovered at day 8 after HCT in the presence or absence of Tregs. Gene signatures were obtained from the Molecular Signatures Database (MSigDB).
Paired transcriptomic analysis of Tcons and Tregs identified mechanisms of GVHD suppression. (A) Transcript expression of genes encoding for molecules involved in classical Treg mechanisms of suppression. (B) Enrichment plots displaying enrichment scores for the genes involved in Tgfb (HALLMARK_TGF_BETA_SIGNALING), Il10 (REACTOME_INTERLEUKIN_10_SIGNALING), Il35 (GSE24210_CTRL_VS_IL35_TREATED_TCONV_CD4_TCELL_DN), and Il2 (HALLMARK_IL2_STAT5_SIGNALING) in CD4 (left) and CD8 (right) Tcons recovered at day 8 after HCT in the presence or absence of Tregs. Gene signatures were obtained from the Molecular Signatures Database (MSigDB).
Treg-modulated genes involved in metabolic pathways favoring oxidative phosphorylation and suppressing glycolysis in CD4 and CD8 Tcons
To identify additional mechanisms of Treg suppression during GVHD, we performed GSEA for hallmark gene sets on CD4 and CD8 Tcons in the presence or absence of Tregs. This analysis identified the oxidative phosphorylation (OXPHOS) gene set as the top gene set induced in CD4 Tcons (Figure 5A) and the top third in CD8 Tcons (Figure 5B). Given the recently discovered importance of T-cell metabolism in GVHD,20-22 we analyzed in detail the impact of Tregs on genes involved in the main metabolic pathways (Figure 5C). Treg treatment significantly suppressed the transcription of genes involved in glycolytic processes including Slc2a1, encoding for the glucose receptor GLUT1, and Pkm, encoding for the key glycolytic enzyme pyruvate kinase, in both CD4 and CD8 Tcons (Figure 5C). Conversely, Treg treatment led to a global upregulation of genes encoding for enzymes involved in OXPHOS (Figure 5C). We did not observe any significant impact of Tregs on Tcon transcription of genes involved in fatty acid β-oxidation (FAO) or the tricarboxylic acid cycle (Figure 5C). Analysis of metabolic gene sets in Tregs at day 8 after HCT compared with Tregs before injection revealed an enrichment in both OXPHOS and glycolysis gene signatures and a trend toward enrichment of FAO gene signatures (supplemental Figure 4). Collectively, our results demonstrated that Tregs significantly modulate genes involved in Tcon metabolism, leading to the downregulation of genes involved in glycolysis and the upregulation of the genes responsible for OXPHOS, pointing to a metabolic shift of Tcons induced by Tregs during GVHD.
Treg-modulated genes regulate metabolic patterns in CD4 and CD8 Tcons during GVHD. (A-B) Top 10 enriched terms/pathways in CD4 (A) and CD8 (B) Tcons from mice receiving Tcons and Tregs (positive normalized enrichment score [NES], red bars indicate the significant pathways) or Tcons alone (negative NES, blue bars indicate the significant pathways) revealed via hallmark GSEA. (C) Map of genes regulating CD4 and CD8 Tcon metabolism before and after HCT. Single genes heatmap represent the row-scaled gene expression in FPKM (fragments per kilobase of transcript per million reads mapped). Genes and enzymes are indicated.
Treg-modulated genes regulate metabolic patterns in CD4 and CD8 Tcons during GVHD. (A-B) Top 10 enriched terms/pathways in CD4 (A) and CD8 (B) Tcons from mice receiving Tcons and Tregs (positive normalized enrichment score [NES], red bars indicate the significant pathways) or Tcons alone (negative NES, blue bars indicate the significant pathways) revealed via hallmark GSEA. (C) Map of genes regulating CD4 and CD8 Tcon metabolism before and after HCT. Single genes heatmap represent the row-scaled gene expression in FPKM (fragments per kilobase of transcript per million reads mapped). Genes and enzymes are indicated.
Tregs reduced the infiltration of activated T cells and inflammation in intestinal tissues while inducing OXPHOS
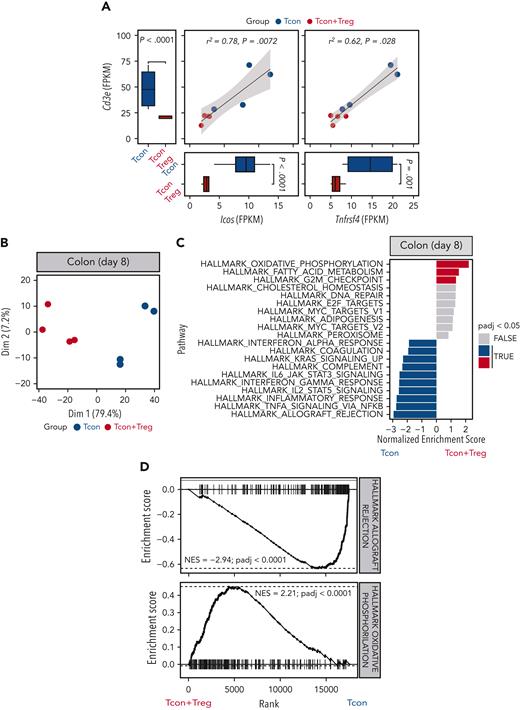
To assess the impact of Treg treatment in GVHD target organs, we performed a transcriptomic analysis of colonic tissues harvested 8 days after transplantation from mice receiving Tcons in the presence or absence of Tregs. We detected significantly reduced Cd3e transcripts in the colon from mice receiving Tregs compared with mice receiving Tcons alone (Figure 6A). Similarly, we observed a reduction in transcripts of the Trac, Trbc1, and Trbc2 genes, encoding TCR subunits (supplemental Figure 5A). Immunohistochemistry staining for CD3 of colonic tissues from mice receiving Tregs confirmed a reduction in T-cell infiltration compared with tissues from mice receiving Tcons alone (supplemental Figure 5B-C). We have previously shown that expression of the T-cell activation markers ICOS and OX40 is a sensitive parameter for GVHD monitoring.23,24 We detected reduced transcript levels of both Icos and Tnfrsf4, encoding ICOS and OX40 respectively, whose expressions positively correlated with Cd3e expression (Figure 6A).
Tregs modulated colon T-cell infiltration and gene expression. (A) Scatter plots and marginal bar plots correlating and comparing the transcript expression of Cd3e, Icos, and Tnfrsf4 in the colon from mice receiving Tcons alone (blue dots and bars) or Tcons and Tregs (red dots and bars). Differences between groups were assessed using DESeq2. Correlations were evaluated using a Spearman rank correlation coefficient test. (B) PC analysis of transcriptome based on the top 1000 differentially expressed genes across colon tissues isolated at day 8 from mice receiving Tcons alone (blue dots) or Tcons and Tregs (red dots). (C) Top 10 enriched terms/pathways in colon Tcons from mice receiving Tcons and Tregs (positive NES, red bars indicate the significant pathways) or Tcons alone (negative NES, blue bars indicate the significant pathways) revealed by hallmark GSEA. (D) Enrichment plots displaying enrichment scores for the genes involved in allograft rejection (HALLMARK_ALLOGRAFT_REJECTION) and OXPHOS (HALLMARK_OXIDATIVE_PHOSPHORILATION) from colon tissues recovered at day 8 after HCT in the presence or absence of Tregs.
Tregs modulated colon T-cell infiltration and gene expression. (A) Scatter plots and marginal bar plots correlating and comparing the transcript expression of Cd3e, Icos, and Tnfrsf4 in the colon from mice receiving Tcons alone (blue dots and bars) or Tcons and Tregs (red dots and bars). Differences between groups were assessed using DESeq2. Correlations were evaluated using a Spearman rank correlation coefficient test. (B) PC analysis of transcriptome based on the top 1000 differentially expressed genes across colon tissues isolated at day 8 from mice receiving Tcons alone (blue dots) or Tcons and Tregs (red dots). (C) Top 10 enriched terms/pathways in colon Tcons from mice receiving Tcons and Tregs (positive NES, red bars indicate the significant pathways) or Tcons alone (negative NES, blue bars indicate the significant pathways) revealed by hallmark GSEA. (D) Enrichment plots displaying enrichment scores for the genes involved in allograft rejection (HALLMARK_ALLOGRAFT_REJECTION) and OXPHOS (HALLMARK_OXIDATIVE_PHOSPHORILATION) from colon tissues recovered at day 8 after HCT in the presence or absence of Tregs.
PC analysis performed for the top 1000 most differentially expressed genes helped clearly segregate tissues from mice receiving Tcons and Tregs from mice receiving Tcons alone, with PC1 explaining 79.4% of the variance (Figure 6B). Differential gene expression analysis helped identify 106 downregulated genes and 54 upregulated genes in the colon of mice receiving Tregs treatment compared with that of mice receiving Tcons in the absence of Tregs (supplemental Figure 5D). GSEA for hallmark gene sets on colonic tissues from mice receiving Tregs identified the OXPHOS gene set as the top induced gene set (Figure 6C-D). Conversely, the top hallmark gene signature suppressed by Tregs was allograft rejection (Figure 6C-D). In addition, Treg administration was associated with a significant downregulation of gene signatures involved in the signaling pathways of several proinflammatory molecules including tumor necrosis factor-α, interferon gamma, IL-2/STAT5, and IL-6/JAK/STAT3 (Figure 6C).
Collectively, the transcriptomic analysis of colonic tissues revealed an impact of Tregs on colon infiltration of activated Tcons, suppression of tissue inflammation, and induction of OXPHOS during GVHD.
Treg treatment did not affect the induction of effector gene sets involved in GVT effect
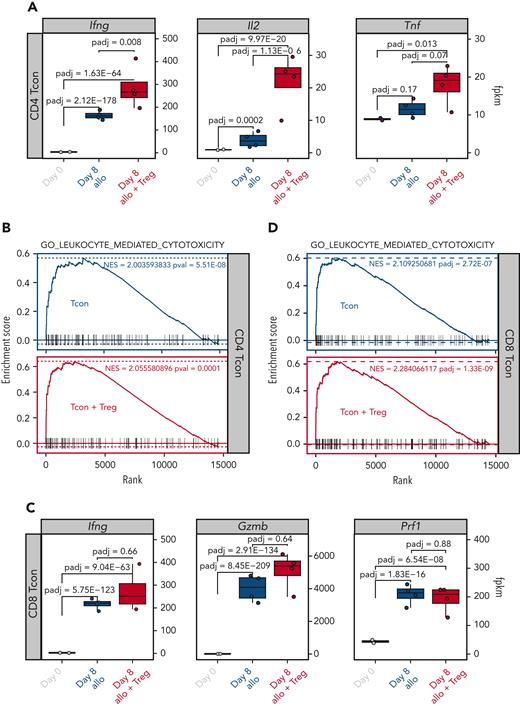
We, and others, have previously shown that Tregs are capable of suppressing GVHD without impairing the GVT effect of the transplantation procedure.5 We therefore hypothesized that Treg treatment would have minimal, if any, impact on Tcon transcription of effector molecules involved in the GVT effect. To test this hypothesis, we compared the transcription of effector molecules in Tcons recovered at day 8 from allogeneic mice treated or not treated with Tregs. As shown in Figure 7A, the addition of Tregs did not inhibit but further increased the transcription of Ifng, Il2, and Tnf in CD4 Tcons. Accordingly, Tregs did not prevent the upregulation of gene sets involved in leukocyte-mediated cytotoxicity after HCT (Figure 7B). Similar results were observed in CD8 Tcons in which Tregs did not prevent the upregulation of cytotoxic genes, including Ifng, Gzmb, and Prf1 (Figure 7C), nor the enrichment of genes involved in leukocyte-mediated cytotoxicity (Figure 7D). Collectively, these results demonstrate that Treg treatment did not interfere with the induction of genes encoding effector molecules involved in the GVT effect of HCT.
Tregs did not inhibit the upregulation of gene sets involved in the GVT effect. (A) Transcript expression of effector molecules (Ifng, Il2, Tnf) in CD4 Tcons. (B) Enrichment plots displaying enrichment scores for the genes involved in leukocyte cytotoxicity (GO_LEUKOCYTE_MEDIATED_CYTOTOXICITY) from CD4 Tcons recovered at day 8 after HCT in the presence or absence of Tregs. (C) Transcript expression of effector molecules (Ifng, Gzmb, Prf1) in CD8 Tcons. (D) Enrichment plots displaying enrichment scores for the genes involved in leukocyte cytotoxicity (GO_LEUKOCYTE_MEDIATED_CYTOTOXICITY) from CD8 Tcons recovered at day 8 after HCT in the presence or absence of Tregs. Gene signatures were obtained from MSigDB.
Tregs did not inhibit the upregulation of gene sets involved in the GVT effect. (A) Transcript expression of effector molecules (Ifng, Il2, Tnf) in CD4 Tcons. (B) Enrichment plots displaying enrichment scores for the genes involved in leukocyte cytotoxicity (GO_LEUKOCYTE_MEDIATED_CYTOTOXICITY) from CD4 Tcons recovered at day 8 after HCT in the presence or absence of Tregs. (C) Transcript expression of effector molecules (Ifng, Gzmb, Prf1) in CD8 Tcons. (D) Enrichment plots displaying enrichment scores for the genes involved in leukocyte cytotoxicity (GO_LEUKOCYTE_MEDIATED_CYTOTOXICITY) from CD8 Tcons recovered at day 8 after HCT in the presence or absence of Tregs. Gene signatures were obtained from MSigDB.
Discussion
In this work, we used integrated TCR repertoire and transcriptomic analysis of murine Tcons and Tregs to gain further insights into the mechanisms of acute GVHD suppression by Tregs. Our results indicate that Treg treatment did not interfere with the activation and differentiation of alloreactive Tcon clones during GVHD. Tregs predominantly affected the CD4 Tcon and to a lesser extent the CD8 Tcon transcriptome, modulating the transcription of genes encoding pro- and anti-inflammatory molecules as well as enzymes involved in glycolytic processes.
CD4+CD25+FOXP3+ Tregs are a well-established immunomodulatory cell population able to suppress Tcon responses via several, nonmutually exclusive mechanisms.16 Our analysis identified multiple pathways potentially involved in Treg suppression of GVHD, namely anti-inflammatory cytokine production mirrored by downstream Tcon signaling of IL-10 and IL-35 as well as a metabolic switch of Tcons from glycolysis to OXPHOS. Conversely, we did not find evidence for a role of transforming growth factor-β production and competition for IL-2 to be dominant mechanisms of Treg suppression. The study of Tcon and Treg transcriptome during GVHD limited our analysis to T-cell–intrinsic mechanisms of suppression; however, it did not allow us to evaluate the relevance of cytolysis of effectors and APCs. Previous studies that addressed the role of cytolysis mediated by Tregs through production of cytotoxic molecules failed to find evidence for a role of granzyme B25 and showed experimental26 and clinical27 evidence for the role of granzyme A in Treg-mediated suppression of GVHD. Our transcriptomic analysis found an upregulation of Gzmb and Gzma in Tregs after transplantation (Figure 3F).
Recent studies point to an important role of metabolic regulation of T cells during GVHD (reviewed in Mohamed et al28). Murine studies revealed that donor T cells undergo metabolic reprogramming after allogeneic HCT, switching from FAO and pyruvate oxidation via the tricarboxylic cycle to aerobic glycolysis.20 Using transcriptomic and metabolomic analysis, Assmann et al21 confirmed that murine donor CD4+ T cells acquired a highly glycolytic profile during acute GVHD and showed increased transcription of glycolytic enzymes in human CD4+ T cells isolated from allogeneic hematopoietic stem cell transplantation recipients just before the onset of acute GVHD. Our transcriptomic results suggest that Tregs inhibit the metabolic switch of Tcons toward glycolysis by interfering at different crucial points. We observed a decrease in the transcription of the gene encoding the glucose transporter GLUT1, which contributes to the pathogenicity of allogeneic Tcons during GVHD.22,29 Moreover, Tregs inhibited the induction of genes encoding several glycolytic enzymes, including 6-phosphofructo-2-kinase/fructose-2,6-biphosphatase 3, the rate-limiting factor in glycolytic metabolism whose specific pharmacological inhibition using 3-(3-pyridinyl)-1-(4-pyridinyl)-2-propen-1-one has been shown to protect against acute GVHD.20 T-cell metabolic fitness through glycolysis and OXPHOS has been recently shown to play an essential role in the GVT effect after allogeneic HCT.30 In our experiments, Tregs not only inhibited the transcription of glycolytic genes but also increased the transcription of OXPHOS-related genes, suggesting a metabolic switch toward mitochondrial respiration as a source of energy. These results, so far entirely based on transcriptomic analysis, will need functional validation before being used to improve the efficacy of Treg-based therapies.
The need for TCR activation as well as the nature of the antigens recognized by Tregs during GVHD is still being debated. The beneficial effects of low-dose IL-2 treatment on Treg numbers and function in chronic GVHD31-33 suggest that cytokine-mediated Treg activation is sufficient for GVHD suppression without the need for TCR triggering. However, we previously showed that major histocompatibility complex disparities between Tregs and the host were necessary because both donor and third-party Tregs, but not host Tregs, protect from GVHD in murine allogeneic HCT,34 pointing to a critical role of TCR activation for alloreactive Treg suppression of GVHD. Our present study further supports a model of TCR-mediated Treg activation for GVHD suppression, given the clonal restriction that Tregs undergo after allogeneic HCT. Interestingly, we observed a divergence, rather than a convergence, of Tcons and Tregs clonotypes detected after HCT compared with the steady state, suggesting that Tcons and Tregs react against different antigens during GVHD. The contribution of Tcon-derived IL-2 to this process is not excluded.
Our results have clinical implications, given the increasing interest in Treg-based therapies for GVHD prevention and treatment. The Perugia group pioneered the adoptive transfer of fresh Tregs followed by Tcons in a T-cell–depleted CD34-selected HLA-haploidentical HCT platform7,10,35 demonstrating the potential of human Tregs to prevent GVHD but still allow the GVT effect in patients. We reported a similar approach in HLA-matched recipients.9 Recently, therapeutic adoptive transfer of Treg-enriched donor lymphocyte infusion combined with low-dose IL-2 has been reported in chronic GVHD.11 A better understanding of the mechanisms of GVHD suppression by Tregs is particularly relevant now, after years of monocentric early-phase clinical trials and, more recently, multicentric phase 3 clinical trials.
Given the rarity of Tregs, several groups attempted ex vivo Treg expansion from cord-blood8,36 or from peripheral blood.12 Our results point to the need for optimized culture conditions that favor the expansion of IL-10– and IL-35–producing Tregs.37
Our data reveal that, during GVHD suppression, Tregs preserved a transcriptomic signature distinct from CD4 and CD8 Tcons (supplemental Figure 3). Among differentially expressed genes, we identified genes encoding several surface markers, including killer cell lectin-like receptor family molecules (Klrc1, Klrd1, Klrk1, Klrb1b), CD160, and cytotoxic and regulatory T-cell molecule (Crtam). There are ongoing efforts to target these and other markers to selectively deplete alloreactive T cells while sparing Tregs.
Our analysis on Tregs and Tcons was conducted using cells recovered from SLO and not using GVHD target tissues, as previously reported by other groups who focused on Tcons.38-41 We decided to study SLO because this is the site where Treg suppression of Tcon-mediating GVHD is thought to take place.6,42 Moreover, the reduction in Tcon tissue infiltration upon Treg treatment precluded the isolation of sufficient numbers of Tcons and Treg from the GVHD target tissue sites to conduct this kind of analysis. However, our bulk analysis of the colons recovered from mice receiving Tcons in the presence or absence of Tregs supports the results we obtained in SLO, identifying the OXPHOS signature as the most strongly upregulated factor upon Treg treatment and identifying several inflammatory molecule signaling pathways suppressed by Treg administration.
Our study has several limitations. Firstly, our analysis was performed at the peak of Tcon expansion and lacks the dynamic information about the early impact of Tregs during the very first days of GVHD suppression. Unfortunately, the limited number of cells that is possible to recover at earlier time points represents an obstacle to this analysis. Secondly, the strain combination of C57Bl/6 donors that was transplanted into BALB/c recipients is known to be more dependent on CD4+ T cells, and it is possible that other strain combinations more dependent on CD8+ T cells may show a greater impact of Tregs with this cell population.
In conclusion, our results provide further insights into the mechanisms of Treg suppression of GVHD. Moreover, our data support a model in which Tregs qualitatively modulate Tcon function through several mechanisms rather than prevent the activation of alloreactive clones, providing a potential explanation for the ability of Tregs to suppress GVHD while allowing GVT.
Acknowledgments
This work was supported with funding from National Institutes of Health (NIH), National Cancer Institute grants R01 CA23158201 (R.S.N.) and P01 CA49605 (R.S.N.), the Parker Institute for Cancer Immunotherapy (R.S.N.), German Cancer Aid Mildred Scheel Postdoctoral Fellowship (J.K.L.), Swiss Cancer League BIL KLS 3806-02-2016 (F.S.), Geneva Cancer League LGC 20 11 (F.S.), the American Society for Blood and Marrow Transplantation New Investigator Award 2018 (F.S.), Dubois-Ferrière-Dinu-Lipatti Foundation (F.S.), the ChooseLife Foundation (F.S.), Fondation Gustave & Simone Prévot (F.S.), Fondation Henriette Meyer (F.S.), and Gruenewald-Zuberbier Foundation (N.K.). Flow cytometry analysis and sorting were performed on instruments in the Stanford Shared FACS Facility purchased using an S10 Shared Instrumentation Grant from the NIH (S10RR027431-01). Sequencing was performed on instruments in the Stanford Functional Genomics Facility, including the Illumina HiSeq 4000 purchased using an S10 Shared Instrumentation Grant from the NIH (S10OD018220).
Authorship
Contribution: J.K.L., T.H., M.T., and F.S. conceived and designed research studies; J.K.L., T.H., M.T., T.L.R., A.M., I.W., A.P., S.W., and F.S. conducted experiments; J.K.L., S. Buhler, N.K., S.W., and F.S. analyzed data; X.J. developed methodology and analyzed data; J.B. developed methodology and provided essential reagents; S. Becattini, J.V., D.M., and Y.C. provided essential tools and intellectual input; J.K.L., F.S., and R.S.N. wrote the manuscript; and F.S. and R.S.N. supervised the research.
Conflict-of-interest disclosure: The authors declare no competing financial interests.
Correspondence: Robert S. Negrin, Division of Blood and Marrow Transplantation and Cellular Therapy, Department of Medicine, Stanford University School of Medicine, Center for Clinical Sciences Research Building, Room 2205, 269 W Campus Dr, Stanford, CA 94305; e-mail: negrs@stanford.edu; and Federico Simonetta, Division of Blood and Marrow Transplantation and Cellular Therapy, Department of Medicine, Stanford University School of Medicine, Center for Clinical Sciences Research Building, Room 2205, 269 W Campus Dr, Stanford, CA 94305; e-mail: federico.simonetta@unige.ch.
References
Author notes
∗R.S.N. and F.S. are joint senior authors.
The data reported in this article have been deposited in the Gene Expression Omnibus database (accession number GSE205375).
Data are available on request from the corresponding authors, Robert S. Negrin (negrs@stanford.edu) and Federico Simonetta (federico.simonetta@unige.ch).
The online version of this article contains a data supplement.
There is a Blood Commentary on this article in this issue.
The publication costs of this article were defrayed in part by page charge payment. Therefore, and solely to indicate this fact, this article is hereby marked “advertisement” in accordance with 18 USC section 1734.

![Treg-modulated genes regulate metabolic patterns in CD4 and CD8 Tcons during GVHD. (A-B) Top 10 enriched terms/pathways in CD4 (A) and CD8 (B) Tcons from mice receiving Tcons and Tregs (positive normalized enrichment score [NES], red bars indicate the significant pathways) or Tcons alone (negative NES, blue bars indicate the significant pathways) revealed via hallmark GSEA. (C) Map of genes regulating CD4 and CD8 Tcon metabolism before and after HCT. Single genes heatmap represent the row-scaled gene expression in FPKM (fragments per kilobase of transcript per million reads mapped). Genes and enzymes are indicated.](https://ash.silverchair-cdn.com/ash/content_public/journal/blood/141/14/10.1182_blood.2022017982/3/m_blood_bld-2022-017982-gr5.jpeg?Expires=1769545147&Signature=yj5HPVXIHmp9fiwEhTpdHEclMhubud0jTm4pvofSJI9ASjQaE2QU8vTVSMXOkHnZJVaWxplGkwlg1ldsM1tAtk3Jd-XTghpCeWxmI~JQvqayWEvEOWGM-CEIUzja8QVompMpqMYZN3cv6tlNAhm1JT-oxBIjLzLwdcVV2iiZo517D8WIphGtJXCprV2jW1RG4ILyaLYphweYeNS6RzUrvGyfQOUWiZjdutUxKkLxPcWTt2beXpgjU0ax2CQB0fs2jW1xQ1ll8DalDQMgOl72GCz7yb5lwz42iNK3Ulq5lqHBYk1DSqYD1ySugmGppjYleeoc9pW59Ok2SuHJeXoapA__&Key-Pair-Id=APKAIE5G5CRDK6RD3PGA)
This feature is available to Subscribers Only
Sign In or Create an Account Close Modal