

Key Points
FCS, defined by lpWGS of cfDNA, is associated with inferior outcomes in patients with LBCL treated with CAR T-cell therapy.
FCS, LDH, and number of extranodal sites significantly stratified outcomes in a large single center cohort of CAR T cell–treated patients.

Abstract
Patients with relapsed or refractory large B-cell lymphomas (rrLBCL) can achieve long-term remission after CD19 chimeric antigen receptor T-cell therapy (CART19). However, more than half of recipients will experience treatment failure. Thus, approaches are needed to identify high-risk patients who may benefit from alternative or consolidative therapy. We evaluated low-pass whole-genome sequencing (lpWGS) of cell-free DNA (cfDNA) before CART19 as a new approach for risk stratification. We performed lpWGS on pretreatment plasma samples from 122 patients at time of leukapheresis who received standard-of-care CART19 for rrLBCL to define DNA copy number alterations (CNAs). In multivariable selection, high focal CNA score (FCS) denoting genomic instability was the most significant pretreatment variable associated with inferior 3-month complete response rates (28% vs 56%, P = .0029), progression-free survival (PFS; P = .0007; hazard ratio, 2.11), and overall survival (OS; P = .0026; hazard ratio, 2.10). We identified 34 unique focal CNAs in 108 (89%) patients; of these, deletion 10q23.3 leading to loss of FAS death receptor was the most highly associated with poor outcomes, leading to inferior PFS (P < .0001; hazard ratio, 3.49) and OS (P = .0027; hazard ratio, 2.68). By combining FCS with traditional markers of increased tumor bulk (elevated lactate dehydrogenase and >1 extranodal site), we built a simple risk model that could reliably risk stratify patients. Thus, lpWGS of cfDNA is a minimally invasive assay that could rapidly identify high-risk patients and may guide patient selection for and targeted therapies to evaluate in future clinical trials.
Introduction
Patients with multiply relapsed or refractory large B-cell lymphomas (rrLBCL) experienced dismal outcomes before the approval of CD19 chimeric antigen receptor T-cell therapy (CART19).1,2 The 3 available CART19 products, axicabtagene ciloleucel (axi-cel), tisagenlecleucel (tisa-cel), and lisocabtagene maraleucel, produce complete response rates of 40% to 54%,3-5 with most responding patients achieving durable remissions.6-8 Unfortunately, more than half of patients will experience progressive disease, often within the first 3 months.9 Pretreatment prognostic measures are needed to identify patients unlikely to have durable responses to CART19 and/or who may benefit from consolidative or alternative treatment strategies.
Disease characteristics reflective of increased tumor bulk such as elevated lactate dehydrogenase (LDH), multiple extranodal sites of disease, and high metabolic tumor volume on functional imaging have been associated with inferior outcomes following CART19,9-11 although these are nonspecific markers that reveal little about underlying tumor biology. Tumor-intrinsic genomic factors such as genome-wide mutational signatures12 and TP53 alterations13 have recently been associated with clinical outcomes after CART19. Cell-free DNA (cfDNA) isolated from the plasma of peripheral blood is an accessible source for evaluating tumor genetic alterations.14 Analysis of cfDNA with hybrid-capture duplex sequencing and polymerase chain reaction (PCR)-based clonotype sequencing has been shown to have prognostic value in diffuse large B-cell lymphoma (DLBCL),15,16 including in CART19-treated patients.17,18 However, these technologies are technically complex, require pretreatment calibration and proprietary bioinformatics pipelines, and are therefore not available at most centers limiting their application in the standard-of-care setting.
Somatic copy number alterations (CNAs) are a hallmark of human cancer, and patterns of CNA complexity are associated with outcome in DLBCL.19,20 CNAs can be effectively profiled with low-pass whole-genome sequencing (lpWGS) of cfDNA, requiring simple library preparation and sequencing to a depth 0.1 to 1.0× genome coverage.21-23 We therefore hypothesized that lpWGS analysis of cfDNA before CART19 may represent a new and effective method for profiling genomic complexity and predicting outcome. We evaluated this in a cohort of patients with rrLBCL treated with standard-of-care CART19 and determined that both high overall burden of focal CNAs and specific focal CNAs in cfDNA were associated with inferior post-CART19 outcomes. Furthermore, minimally invasive measurements of focal CNA burden were incorporated with other clinical factors to create a risk model that identified groups of patients with significantly divergent outcomes after standard-of-care CART19.
Methods
Patients
Patients with rrLBCL (including diffuse LBCL, primary mediastinal B-cell lymphoma [PMBL], and transformed indolent lymphoma) after at least 2 prior systemic treatments treated with standard-of-care CART19 at MD Anderson Cancer Center with plasma samples collected from the day of leukapheresis were eligible for inclusion on this study. Patients treated with out-of-specification products not meeting commercial release criteria through the expanded access program were included. Baseline patient and disease characteristics were retrospectively abstracted from the electronic medical record and recorded at time of leukapheresis.
Sample collection and processing
Samples were obtained following informed consent, and all studies performed under protocols approved by the internal review board of MD Anderson Cancer Center (protocol numbers 2005-0656 and PA18-0099). Peripheral blood samples were drawn in EDTA tubes from patients from the same venipuncture used for clinically indicated samples on the day of leukapheresis. Samples were processed by centrifugation to obtain plasma and stored at −80°C within 4 hours of blood draw.
cfDNA extraction
cfDNA was extracted from 4 to 10 mL plasma using a QIAamp Circulating Nucleic Acid (Qiagen). cfDNA concentration was quantified using a Qubit Fluorometer and Qubit double-stranded high-sensitivity reagents (Thermo Fisher Scientific). cfDNA size distribution and absence of high-molecular-weight genomic DNA was assessed using a TapeStation instrument and D1000 high-sensitivity tapes (Agilent Technologies).
Library preparation and sequencing
Libraries were constructed using up to 150 ng cfDNA with a modified protocol using a KAPA HyperPrep Kit (Roche). cfDNA was end-repaired and a-tailed and then ligated using a 1:10 molar ratio of xGen stubby duplex unique molecular identifiers (IDT). Ligated products were cleaned up using AMPure XP beads (Beckman Coulter) in a 1:1 volume ratio before undergoing 5 to 8 cycles of PCR with xGen unique dual index primer pairs (IDT) for each library. The PCR product was again cleaned up using AMPure beads in a 1:1 volume ratio before quantification with a Qubit high-sensitivity kit and evaluation of size distribution using Tapestation. Libraries were multiplexed 16 to 28 times with the target of 100 ng total cfDNA per pool and sequenced with 100-bp paired end reads on a single lane on an SP flowcell using the NovaSeq 6000 system (Illumina) to an average coverage of 1.3×.
lpWGS analysis pipeline
Reads were quality trimmed, mapped, deduplicated, and realigned around insertions/deletions. Bam files were then used to generate CNA segmentation data with CopyWriteR24 using 100-kb bins and estimate tumor fraction with IchorCNA22 (prespecified tumor fraction benchmarks of 0.5%, 1%, 10%, and 50%). CNApp was used to compute scores for focal (FCS, <50% chromosome arm affected) and broad (BCS, ≥50%) CNA burdens using segmentation data and correcting for tumor fraction.25 Default re-segmentation parameters and copy number alteration calling thresholds were used. FCS and BCS are unitless weighted sums of values for each unique CNA based on the copy number amplitude. The bioinformatics pipeline repository is publicly available at https://github.com/Green-Lab-MDACC/lpWGS_pipeline.
Identification of significant CNA targets
Significant peaks of DNA copy number gain and loss were identified from CNA segmentation data using GISTIC2,26 as previously described.27 GISTIC scores and peak boundaries were compared with a prior analysis of 1000 previously untreated DLBCL tumors.20 Matching Affymetrix U133 plus 2.0 gene expression microarray data were available for 249 tumors and used for integrative analysis of gene expression and CNA data for the 10q23.31 deletion. Specifically, genes identified within the 10q23.31 deletion peak were tested for significant differences in expression between tumors with or without 10q23.31 deletion using a Student t test adjusted for false discovery rate with a Benjamini-Hochberg correction.
Statistical analysis of associations with patient outcome
Response assessments were performed from imaging scans performed at 1 and 3 months after infusion when available using the Lugano classification.28 Progression-free survival (PFS) was defined as time from CART19 infusion to the first occurrence of LBCL relapse, progression, or death from any cause. Overall survival (OS) was defined as time from CART19 infusion to death from any cause. Co-primary end points were PFS and complete response (CR) rate at 3 months after infusion. Fisher’s exact tests and Wilcoxon rank-sum tests were used to assess the association between categorical and continuous variables, respectively, with binary patient clinical outcomes. The log-rank test was used to evaluate the difference in PFS/OS between patient groups, and the Cox proportional hazards model was to estimate the hazard ratio for covariates in both univariate and multivariate analyses. The association between presence of specific CNAs identified by GISTIC and PFS was tested with a Bonferroni adjustment for false discovery rate (<0.1).
Two complementary variable selection approaches for building parsimonious and interpretable models for predicting patient outcomes were used. Specifically, we considered the L1-penalized Cox proportional hazard regression with the PFS outcome, and we also used the tree-based approach of recursive partitioning with 3-month CR as the outcome. The methods are complementary because the regularized Cox regression is noted for its ability to enforce sparsity, whereas a partitioning procedure is not constrained by linear effects and proportional hazards assumptions. Ten-fold cross-validation was performed to evaluate models for both approaches.
Results
Pretreatment genomic complexity assessed by cfDNA lpWGS is associated with outcome in patients with rrLBCL treated with CART19
A total of 122 of 135 patients who had successful cfDNA lpWGS and were treated with CART19 between May 2018 and February 2021 were evaluable (Figure 1), with a median follow-up of 20.7 months (range, 0.5-36 months). All patient characteristics and their association with 3-month CR are described in Table 1. Overall response rate was 78% (50% CR, 28% partial response [PR]) at 1 month after cell infusion and 46% (42% CR, 4% PR) at 3 months after cell infusion. Median PFS and OS were 4.5 (95% confidence interval [CI], 3.6-7.7) and 13.5 (95% CI, 11.8-24.9) months, respectively (supplemental Figure 1 available on the Blood Web site).
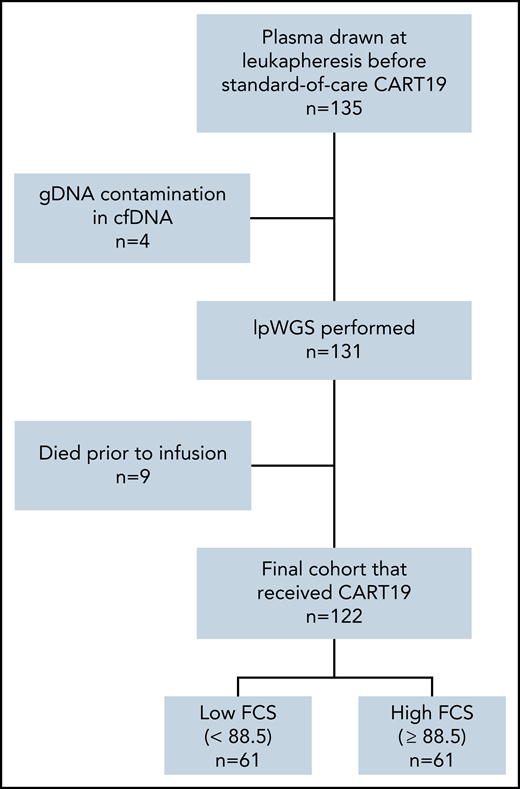
Patient flow diagram. lpWGS was successfully performed on 131 of 135 (97%) plasma samples drawn from patients at time of leukapheresis. Nine patients subsequently died before CART19 infusion, leaving an evaluable cohort of 122 patients that were dichotomized by the median focal copy number alteration burden score of 88.5.
Patient flow diagram. lpWGS was successfully performed on 131 of 135 (97%) plasma samples drawn from patients at time of leukapheresis. Nine patients subsequently died before CART19 infusion, leaving an evaluable cohort of 122 patients that were dichotomized by the median focal copy number alteration burden score of 88.5.
Baseline characteristics at time of leukapheresis for all treated patients (N = 122) and stratified by 3-month response
| Characteristics* | All patients (N = 122), N (%) | 3-mo complete response (N = 50†), N (%) | 3-mo no complete response (N = 70†), N (%) | P‡ |
|---|---|---|---|---|
| Median age (range) | 60.5 (18-88) | 59.5 (18-84) | 63 (24-88) | .29 |
| Age > 60 y | 61 (50) | 23 (46) | 38 (54) | .46 |
| Male sex | 87 (71) | 33 (66) | 54 (77) | .22 |
| Stage III/IV | 99 (81) | 39 (78) | 58 (83) | .64 |
| Extranodal sites > 1 | 77 (63) | 29 (53) | 47 (72) | .036 |
| ECOG performance status | ||||
| 0-1 | 107 (88) | 46 (92) | 59 (84) | .40 |
| 2 | 11 (9) | 4 (8) | 7 (10) | |
| 3 | 4 (3) | 0 (0) | 4 (6) | |
| LDH | ||||
| >upper limit normal | 92 (75) | 35 (70) | 55 (79) | .30 |
| >2× upper limit normal | 21 (17) | 6 (12) | 14 (20) | .32 |
| International prognostic index 3-5 | 75 (62) | 27 (54) | 47 (67) | .183 |
| Histology | ||||
| Diffuse LBCL | 72 (59) | 30 (60) | 42 (60) | .02 |
| Transformed indolent | 43 (35) | 15 (30) | 28 (40) | |
| Primary mediastinal | 7 (6) | 5 (10) | 0 (0) | |
| Bulky disease | ||||
| >5 cm | 57/121 (47) | 20/49 (41) | 35 (50) | .36 |
| >10 cm | 19/121 (16) | 6/49 (12) | 11 (16) | .79 |
| Double expressor | 34/87 (39) | 13/36 (36) | 21/51 (41) | .66 |
| Double hit | 17/97 (18) | 5/39 (14) | 12/56 (21) | .42 |
| Cell-of-origin | ||||
| GCB | 72/113 (64) | 28/44 (64) | 43/67 (64) | 1.0 |
| Non-GCB | 41/113 (36) | 16/44 (36) | 24/67 (36) | |
| Median prior lines of therapy (range) | 3 (2-11) | 3 (2-11) | 3 (2-10) | .36 |
| Prior lines > 2 | 88 (72) | 34 (68) | 53 (76) | .41 |
| Prior autologous stem cell transplant | 28 (23) | 13 (26) | 14 (20) | .51 |
| Primary refractory to frontline therapy§ | 77 (63) | 28 (56) | 47 (67) | .25 |
| Received bridging therapy | 66 (45) | 24 (48) | 40 (57) | .36 |
| CART19 product received | ||||
| Axicabtagene ciloleucel | 112 (92), 4/112 OOS | 48 (96) | 62 (89) | .19 |
| Tisagenlecleucel | 10 (8), 1/10 OOS | 2 (4) | 8 (11) | |
| Grade 3-4 cytokine release syndrome | 10 (8) | 3 (6) | 6 (9) | .73 |
| Grade 3-4 neurotoxicity | 41 (34) | 17 (34) | 23 (33) | 1.0 |
ECOG, Eastern Cooperative Oncology Group; GCB, germinal center B-cell; OOS, out of specification product.
All baseline characteristics were recorded at time of leukapheresis.
Two patients were excluded from 3-month response assessment because they were lost to follow-up.
By Fisher’s exact test for categorical variables and Wilcoxon rank sum test for continuous variables.
Defined as nonresponse or progression of disease within 6 months of frontline therapy.
We observed that lpWGS of cfDNA was able to effectively detect DNA CNAs within our cohort of patients with rrLBCL (Figure 2A). Tumor fraction determined by IchorCNA22 had a median of 3.2% (range, 0.9%-87.6%) and was modestly associated with patient outcome (supplemental Figure 2). We therefore calculated FCS (informed by CNAs of <50% of a chromosome arm) and BCS (informed by CNAs of >50% of a chromosome arm) using CNapp,25 normalizing for tumor fraction to reduce the confounding effect of tumor burden on these measures of genomic complexity. Median FCS and BCS were 88.5 (range, 38-579) and 4.5 (range, 0-24), respectively. Representative genome-wide CNA profiles for 4 patients, 1 from each FCS quartile, are depicted in Figure 2A.
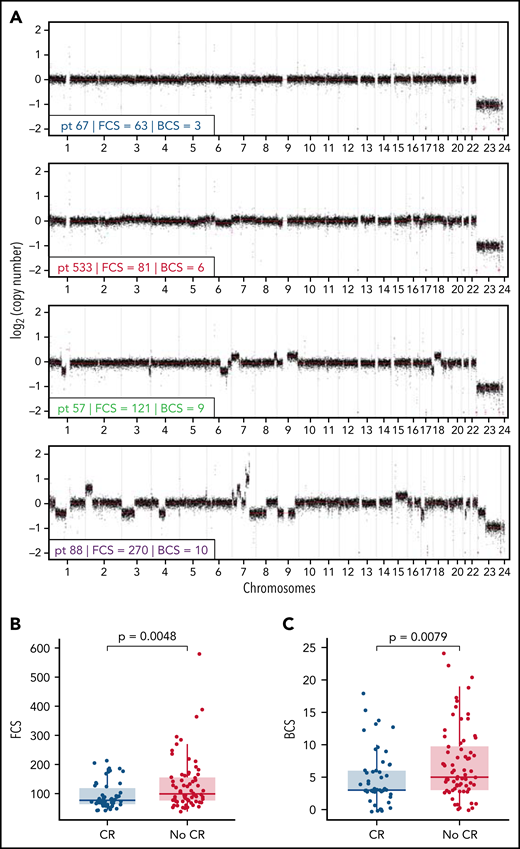
Focal copy number alteration burden score (FCS) and 3-month response rates after CART19. (A) Genome-wide copy number alteration profiles from lpWGS of cfDNA of 4 patients with FCS values from each quartile (A, blue = first quartile, red = second quartile, green = third quartile, purple = fourth quartile). Broad copy number alteration burden scores (BCSs) are also included. (B-C) Box plots comparing distribution of (B) FCS and (C) BCS in patients with complete response (blue) or without complete response (red) at the 3-month post-CART19 evaluation demonstrate that FCS and BCS were significantly higher in patients without 3-month complete response.
Focal copy number alteration burden score (FCS) and 3-month response rates after CART19. (A) Genome-wide copy number alteration profiles from lpWGS of cfDNA of 4 patients with FCS values from each quartile (A, blue = first quartile, red = second quartile, green = third quartile, purple = fourth quartile). Broad copy number alteration burden scores (BCSs) are also included. (B-C) Box plots comparing distribution of (B) FCS and (C) BCS in patients with complete response (blue) or without complete response (red) at the 3-month post-CART19 evaluation demonstrate that FCS and BCS were significantly higher in patients without 3-month complete response.
Patients with CR vs no CR at 3 months had a baseline median FCS of 77 vs 99 (P = .0048; Figure 2B), median BCS of 3 vs 5 (P = .0079; Figure 2C), and median tumor fraction of 1.9% vs 4.7% (P = .013; supplemental Figure 2D). FCS and BCS were also significantly lower in patients with an overall response at 3 months (supplemental Figure 3). As a continuous variable, increasing FCS was associated with shorter PFS (P = .0002; hazard ratio [HR], 1.005; 95% CI, 1.002-1.007) and OS (P = .017; HR, 1.003; 95% CI, 1.001-1.005). We observed that PFS was significantly shorter for patients with FCS values above the cohort median of 88.5 (median PFS = 3.5 months; 95% CI, 2.5-5.0), henceforth referred to as “high FCS,” compared with patients with FCS values below the cohort median (median PFS = 12.7 months; 95% CI, 4.4-NA; log-rank P = .0007; HR, 2.11; 95% CI, 1.36-3.27; Figure 3A), henceforth referred to as “low FCS.” This trend was also significant for 1-year PFS rates, which were 19% (95% CI, 11%-33%) vs 52% (95% CI, 40%-67%) for patients with high FCS compared with low FCS, respectively. OS was also significantly shorter with in patients with high FCS (OS median = 10.2 months; 95% CI, 5.7-15.8) compared with those with low FCS (median OS = 28.9 months; 95% CI, 13.5-NA; log-rank P = .0026; HR, 2.10; 95% CI, 1.28-3.43; Figure 3B) and 1-year OS rates of 44% (95% CI, 33%-59%) vs 69% (95% CI, 58%-83%). When stratified by FCS quartile, PFS (log-rank P = .0045; supplemental Figure 4A) and OS (log-rank P = .01; supplemental Figure 4B) remained significantly different between groups. Three-month CR rate was 28% (17 of 61) for patients with high FCS vs 56% (33 of 59) for patients with low FCS (P = .0029). Three-month overall response rate was 33% (20 of 61) for patients with high FCS vs 59% (35 of 59) for patients with low FCS (P = .0058). BCS above the cohort median of 4.5 was associated with shorter PFS and OS (supplemental Figure 5A-B) and lower 3-month CR rate (31% vs 53%, P = .026), but with a lower degree of statistical significance compared with FCS. Genomic complexity can therefore be measured using minimally invasive lpWGS of cfDNA in patients with rrLBCL at the time of apheresis for CD19 CAR T-cell therapy and is associated with subsequent outcomes within this single-institution cohort.
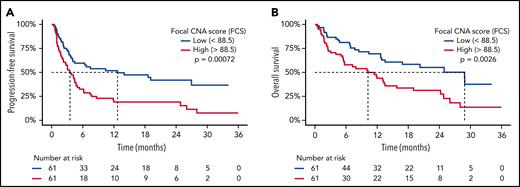
High FCS is associated with poor survival outcomes after CART19. Kaplan-Meier plots of PFS (A) and OS (B) stratified by FCS of 88.5 (median value) demonstrating that survival was significantly shorter in patients with “high” (>88.5) FCS. Median survival times are delineated by dashed lines.
High FCS is associated with poor survival outcomes after CART19. Kaplan-Meier plots of PFS (A) and OS (B) stratified by FCS of 88.5 (median value) demonstrating that survival was significantly shorter in patients with “high” (>88.5) FCS. Median survival times are delineated by dashed lines.
Discrete CNAs associated with outcome after CART19
Specific DNA CNAs may be drivers of resistance to CD19 CAR T cells. We therefore used GISTIC226 to identify peaks of significant DNA copy number gain and loss. This identified 11 peaks of significant DNA copy number gain and 23 peaks of significant DNA copy number loss (supplemental Table 1; Figure 4A), with at least 1 of these alterations being observed in 108 of 122 (89%) patients (supplemental Figure 6). We evaluated the association between significant DNA copy number gain and loss peaks with PFS in patients with ≥1 detectable CNA peak (n = 108) to avoid the potential confounding effect of low tumor purity on CNA calls. Using Cox regression analysis of the 34 GISTIC peaks with a Bonferroni adjustment for false discovery rate, we identified 3 peaks of DNA copy number loss associated with inferior outcome (Figure 4A; supplemental Table 1). Deletion of 10q23.31 was identified in 12 of 108 (11%) patients and was the most significantly associated with inferior PFS in the Cox regression (Figure 4A). In line with this, Kaplan-Meier analysis showed significant associations between deletion 10q23.31 and both inferior PFS (log-rank P < .0001; Figure 4B) and OS (log-rank P = .0024; Figure 4C). By cross-referencing our prior DNA copy number analysis of 1000 DLBCLs,20 we identified the FAS gene as a likely driver of this deletion (supplemental Figure 7), which encodes a death receptor that is important for response to CART19.29,30 Although these observations require functional validation, these results suggest that focal DNA copy number alterations detected by lpWGS of cfDNA may capture important biological drivers of resistance to CART19.
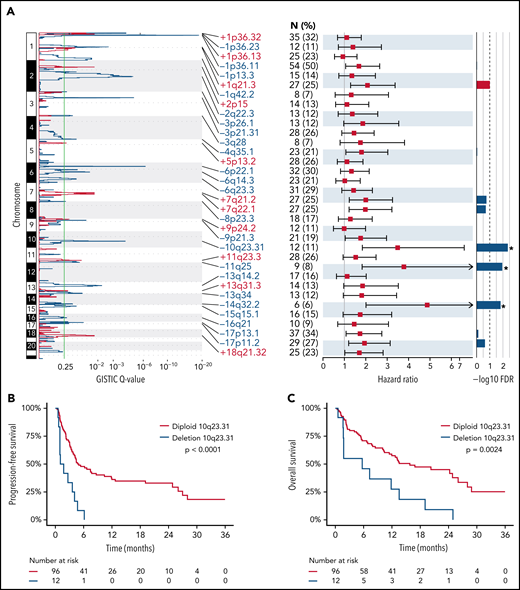
Unique copy number alterations identified from lpWGS are associated with post-CART19 outcomes. (A) GISTIC analysis of copy number alteration profiles of 122 patients identified 11 peaks of DNA copy gain (red) and 23 peaks of DNA copy loss (blue). The green line denotes the significance threshold of q-value = 0.25. The number of patients harboring each lesion from the set of 108 patients included in the outcome analysis is shown. Hazard ratios with 95% confidence intervals from univariate Cox regression analysis of the association are shown for each CNA and PFS for the 108 patients with detected copy number alterations. False discovery rate (FDR) values after Bonferroni correction of Cox regression analysis. The dashed line denotes the significant threshold of FDR = 0.1. The 3 copy number alterations significantly associated with PFS (in order of increasing FDR value) were deletion 10q23.31, deletion 11q25, and deletion 14q32.2. (B-C) Kaplan Meier plots of PFS (B) and OS (C) stratified by presence or absence of deletion 10q23.31 as detected by GISTIC demonstrate that the patients with deletion 10q23.31 (n = 12, 11%) experienced significantly worse PFS and OS compared with those without 10q23.31 deletions (n = 96, 89%).
Unique copy number alterations identified from lpWGS are associated with post-CART19 outcomes. (A) GISTIC analysis of copy number alteration profiles of 122 patients identified 11 peaks of DNA copy gain (red) and 23 peaks of DNA copy loss (blue). The green line denotes the significance threshold of q-value = 0.25. The number of patients harboring each lesion from the set of 108 patients included in the outcome analysis is shown. Hazard ratios with 95% confidence intervals from univariate Cox regression analysis of the association are shown for each CNA and PFS for the 108 patients with detected copy number alterations. False discovery rate (FDR) values after Bonferroni correction of Cox regression analysis. The dashed line denotes the significant threshold of FDR = 0.1. The 3 copy number alterations significantly associated with PFS (in order of increasing FDR value) were deletion 10q23.31, deletion 11q25, and deletion 14q32.2. (B-C) Kaplan Meier plots of PFS (B) and OS (C) stratified by presence or absence of deletion 10q23.31 as detected by GISTIC demonstrate that the patients with deletion 10q23.31 (n = 12, 11%) experienced significantly worse PFS and OS compared with those without 10q23.31 deletions (n = 96, 89%).
Identification of a pretreatment prognostic model for patients with rrLBCL treated with CD19 CAR T cells
We assessed the joint contributions of available baseline clinical characteristics, FCS, and BCS using both L1-penalized Cox proportional hazard regression to model PFS and recursive partitioning to model the 3-month CR outcome. Recursive partitioning analysis for 3-month CR returned several trees performing similarly in cross-validation, with FCS selected as the initial node each time. The clinically prognostic characteristic of >1 extranodal (EN) site was also commonly selected. The algorithm-generated cutoff for FCS occurred at 82.5, close to the median of 88.5 that we used to stratify patients into high and low FCS groups; thus, our original threshold of 88.5 was used to dichotomize patients. After cross-validation, the Cox model for PFS included only 3 covariates: FCS, >1 EN site, and elevated LDH. The association between covariates and PFS by univariate and multivariate analysis is depicted in supplemental Figures 8 and 9.
Most patients received axi-cel (92%) with a minority receiving tisa-cel (8%) as their CART19 product. There was a slight association with inferior PFS with receipt of tisa-cel compared with axi-cel (log-rank P = .044; HR = 2.02; 95% CI, 1.01-4.05; supplemental Figure 10). When excluding tisa-cel–treated patients from analysis, high FCS remained associated with PFS by univariate and multivariate analysis (supplemental Figures 11 and 12). Of 7 (6%) patients with PMBL, 2 were lost to follow-up early, and the remaining 5 all achieved CR at 3 months. Median FCS for patients with PMBL was 75, which was not significantly different than the rest of the cohort (90, P = .70).
High FCS was associated with having >1 EN sites of disease (P = .024) but not with other surrogates for disease burden such as elevated LDH (P = .14), advanced stage (P = .36), or bulky lymphadenopathy > 5 cm (P = .15; Figure 5). However, there were patients lacking these negative prognostic markers of tumor burden with high FCS and vice versa for all measures; thus, genomic complexity captured by FCS provides a mutually informative metric within this cohort of patients. Therefore, given the concordance between our CR and PFS models, we built a simple and interpretable risk stratification model incorporating high FCS, elevated LDH, and >1 EN site, assigning 1 point for each negative prognostic marker (based on similarity of regression coefficients in unpenalized Cox regression) and stratifying patients into low (0)-, intermediate (1-2)-, and high (3)-risk groups (Figure 6A). Three-month CR rate was 64%, 49%, and 20% for these groups, respectively, and PFS (log-rank P < .0001; Figure 6B) and OS (log-rank P < .0001; Figure 6C) were significantly different between groups. The 35 patients (29%) in the high-risk group had extremely poor outcomes with 1-year PFS and OS rates of 4% (95% CI, 1%-25%) and 16% (95% CI, 7%-37%), respectively. These observations require validation in an independent series but suggest that FCS measured by lpWGS of cfDNA can be combined with clinical characteristics (LDH and >1 EN site) to identify a high-risk group of patients with poor outcomes after CART19.
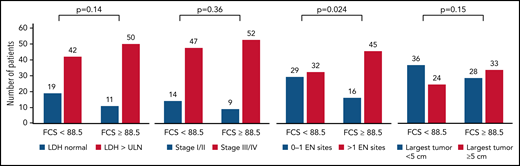
Association between FCS and markers of increased tumor burden. Bar plots depicting the association between elevated FCS (using cutoff of 88.5, median) with markers of elevated tumor burden including elevated LDH, advanced disease stage, >1 EN site of disease, and bulky disease by radiography (at least 5 cm or greater in diameter). P values depicted are from Fisher’s exact test. High FCS was only statistically associated with higher prevalence of >1 EN sites of disease.
Association between FCS and markers of increased tumor burden. Bar plots depicting the association between elevated FCS (using cutoff of 88.5, median) with markers of elevated tumor burden including elevated LDH, advanced disease stage, >1 EN site of disease, and bulky disease by radiography (at least 5 cm or greater in diameter). P values depicted are from Fisher’s exact test. High FCS was only statistically associated with higher prevalence of >1 EN sites of disease.
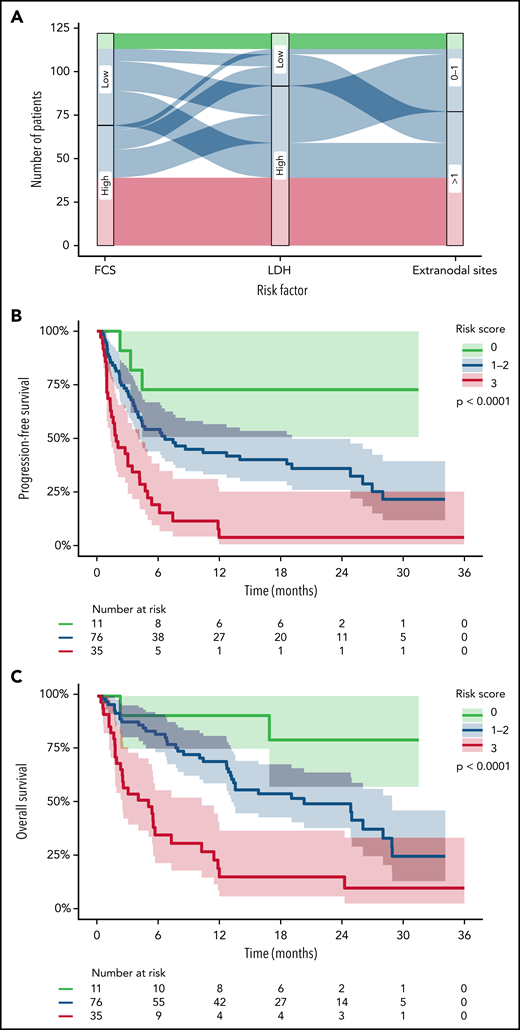
Simple risk model incorporating FCS from lpWGS. (A) Sankey plot depicting the distribution of low-risk (green), intermediate-risk (blue), and high-risk (red) patients by the 3 variables of the risk model (FCS, LDH, and EN sites). (B-C) Kaplain-Meier plots of PFS (B) and OS (C) of patients divided into the 3 risk groups. Median PFS was not reached, 6.7 months, and 1.9 months with 1-year progression free survival rates of 73%, 43%, and 4% for low- to high-risk patients, respectively. Median OS was not reached, 20.3 months, and 5.0 months with 1-year overall survival rates of 80%, 70%, and 16% for low- to high-risk patients, respectively.
Simple risk model incorporating FCS from lpWGS. (A) Sankey plot depicting the distribution of low-risk (green), intermediate-risk (blue), and high-risk (red) patients by the 3 variables of the risk model (FCS, LDH, and EN sites). (B-C) Kaplain-Meier plots of PFS (B) and OS (C) of patients divided into the 3 risk groups. Median PFS was not reached, 6.7 months, and 1.9 months with 1-year progression free survival rates of 73%, 43%, and 4% for low- to high-risk patients, respectively. Median OS was not reached, 20.3 months, and 5.0 months with 1-year overall survival rates of 80%, 70%, and 16% for low- to high-risk patients, respectively.
Discussion
In this study of a cohort of patients with rrLBCL, we assessed cfDNA lpWGS at the time of leukapheresis as a minimally invasive pretreatment assay to assess tumor genomic complexity and predict outcome after CART19. Although CART19 has significantly improved the outcomes of patients with rrLBCL, most patients will progress. Several studies are underway evaluating strategies to improve the outcomes of patients with rrLBCL by combining CART19 with targeted therapies or immunomodulatory agents.31-35 However, these strategies also carry an added risk of treatment-associated toxicities. Furthermore, recent studies have identified therapeutic strategies that are effective in rrLBCL36-40 and may represent alternatives for patients that are unlikely to respond to CART19. We therefore suggest that a pretreatment assay for predicting outcome of patients being considered for CART19 may be informative for selection of high-risk patients for enrollment in CART19 combination studies or to identify patients that would benefit from alternative treatment strategies. With this potentially broad utility in mind, we strived to define an approach for risk stratification of patients undergoing CART19 that is minimally invasive, could be performed before CART19 infusion, and avoids complex hybrid-capture protocols and proprietary bioinformatics pipelines so that it may be simple enough that it could be easily adopted by molecular diagnostics laboratories at most major centers. However, the cost and turnaround time of this assay requires formal prospective evaluation in a clinical setting.
Mutations and deletions of TP53 have been shown to be associated with outcomes after CART19.13 In our cohort, TP53 deletions (17p13.3) were not significantly associated with inferior PFS after FDR correction, and TP53 mutation status was not assessed. It is possible that incorporating mutation status for TP53 or other genes may potentially add prognostic information and improve our model. However, this step would add a further layer of complexity and cost to this assay because of the need for hybrid capture and deep sequencing of the capture targets, which we aimed to avoid to increase the accessibility and utility of the assay. Furthermore, TP53 mutations and deletions were only associated with OS but not PFS in the prior study13 and may therefore be a general biomarker for poor outcome rather than a direct driver of CART19 resistance. In contrast, we hypothesize that DNA CNAs observed by cfDNA lpWGS at the time of apheresis may capture alterations that function directly in escape from CART19. Specifically, we observed deletions of the FAS gene, encoding an important death receptor and effector of T cell–mediated killing, to be associated with particularly poor PFS after CART19. Impaired death receptor signaling has been previously identified in genome-wide screens as driving escape from CART19 killing,29 FAS signaling has been implicated in tumor cell killing by “bystander” T cells during CART19 therapy,30 and tumoral FAS expression was found to predict the outcome of patients in the pivotal ZUMA-1 study of axi-cel.30 Although our observations require validation in an independent cohort, we posit that lpWGS of cfDNA captures biologically meaningful DNA CNAs such as FAS deletion that may function in CART19 resistance. We chose, however, not to include individual copy number alterations into our prognostic model to maintain the simplicity of the approach and to avoid overfitting.
Within our cohort, FCS calculated from lpWGS of cfDNA described patients independently of tumor burden and was strongly associated with 3-month response, PFS, and OS. FCS is a biomarker reflective of overall focal CNA burden and was found to be independent from other surrogate measures of disease burden. In combination with elevated LDH and >1 EN site, FCS creates a simple risk model that could reliably stratify patients and identify a group at high-risk of poor outcomes after standard-of-care CART19. Although other cfDNA sequencing methods have been able to estimate tumor burden by measuring circulating tumor DNA concentration,18 FCS is the first broadly applicable biomarker from cfDNA to our knowledge that reflects underlying tumor genomics for CART19 recipients. Limitations of our study stem from its single-institution nature and retrospective outcomes analysis. Our cohort was made up predominantly of patients who received axi-cel and contained a higher proportion with primary refractory disease compared with other real-world studies.9 The prognostic value of lpWGS of cfDNA in this setting requires validation in independent cohorts including more patients treated with CD3/4-1BB CART19 products. However, within our study cohort, we observed strong associations between FCS and outcomes after CART19, and the combination of FCS, the number of EN sites, and LDH allowed the identification of a high-risk group of patients with only 4% PFS at 12 months after CART. These patients may benefit from enrollment on studies using novel agents in combination with CART19 or be prioritized for novel treatment strategies instead of CART19. This prognostic model therefore warrants prospective validation.
Acknowledgments
This research was generously supported by the Schweitzer Family Fund, a Cancer Prevention & Research Institute of Texas grant (RP200385), and the Anderson National Institutes of Health/National Cancer Institute Cancer Support Grant under award P30 CA016672. M.R.G. is supported by a scholar award from the Leukemia and Lymphoma Society. H.Y. is supported by a fellow award from the Leukemia and Lymphoma Society. P.S. is supported by a Lymphoma Research Foundation Career Development award.
Authorship
Contribution: H.-J.J.C., R.I., C.C.L., H.Y., Q.D., and M.R.G. performed experiments; B.S. and H.Y. performed bioinformatics analysis under the supervision of M.R.G.; R. Sun performed biostatistical analysis; H.-J.J.C., S.A., and P.S. performed clinical data collection and analysis; L.F., N.F., S.P., S.A., R. Steiner, F.H., R.N., H.J.L., M.R., F.S., S.P.I., C.R.F., L.J.N., S.S.N., P.S., and J.W. contributed to clinical patient management and sample collection; M.R.G. conceived the study; J.W. and M.R.G. supervised the study; and H.-J.J.C., R. Sun, and M.R.G. wrote the manuscript. All authors reviewed and approved the manuscript.
Conflicts-of-interest disclosure: R. Sun reports consulting work with Boehringer Ingelheim. N.F. reports employment at and stock ownership in BostonGene and research funding from and advisory board membership for BMS, Roche, TG Therapeutics, and Novartis. S.R. reports equity ownership as a scientific founder of Cellenkos Inc. R. Steiner reports research funding from BMS, Seagen, GlaxoSmithKline, and Rafael Pharmaceuticals. F.S. reports advisory board membership for Imbrium and research funding from Arog. C.R.F. reports consulting work with AbbVie, Bayer, BeiGene, Celgene, Denovo Biopharma, Epizyme/Incyte, Genentech/Roche, Genmab, Gilead, Karyopharm, MEI Pharmaceuticals, MorphoSys AG, Pharmacyclics/Janssen, SeaGen, Spectrum, and research funding from 4D, AbbVie, Acerta, Adaptimmune, Allogene, Amgen, Bayer, Celgene, Cellectis, EMD, Gilead, Genentech/Roche, Guardant, Iovance, Janssen Pharmaceutical, Kite, Morphosys, Nektar, Novartis, Pfizer, Pharmacyclics, Sanofi, Takeda, TG Therapeutics, Xencor, Ziopharm, Burroughs Welcome Fund, Eastern Cooperative Oncology Group, National Cancer Institute, V Foundation, and Cancer Prevention and Research Institute of Texas: CPRIT Scholar in Cancer Research. L.J.N. reports research funding from BMS/Celgene, Caribou Biosciences, Epizyme, Genentech, Gilead/Kite, IGM Biosciences, Janssen, Novartis, Takeda, TG Therapeutics and honoraria from ADC Therapeutics, Bayer, BMS/Celgene, Epizyme, Genentech, Gilead/Kite, Janssen, Morphosys, Novartis, Takeda, and TG Therapeutics. S.S.N. received consulting fees or honorarium from Kite, a Gilead Company, Merck, Bristol Myers Squibb, Novartis, Celgene, Pfizer, Allogene Therapeutics, Cell Medica/Kuur, Incyte, Precision Biosciences, Legend Biotech, Adicet Bio, Calibr, Unum Therapeutics, Sellas Life Sciences, Sana Biotechnology, Bluebird Bio, Medscape, Aptitude Health, Bio Ascend, and MJH Life Sciences; research funding from Kite, a Gilead Company, Bristol Myers Squibb, Merck, Poseida, Cellectis, Celgene, Karus Therapeutics, Unum Therapeutics (Cogent Biosciences), Allogene, Precision BioSciences, Acerta and Adicet Bio and royalty income from Takeda Pharmaceuticals. S.A. reports research funding from SeaGen, Tessa Therapeutics, Chimagen, Merck, Xencor; served on advisory boards for SeaGen; and received honoraria from Novartis, Sanofi, SeaGen. P.S. reports research funding from AstraZeneca/Acerta and ALX Oncology; is a consultant for Roche/Genentech; and served on advisory boards for Hutchinson/MediPharma, TG Therapeutics and ADC Therapeutics. M.R.G. reports research funding from AbbVie, Sanofi, Allogene and Kite/Gilead, honoraria from Tessa Therapeutics, Daiichi Sankyo and Monte Rosa Therapeutics and has stock ownership interest in KDAc Therapeutics. J.R.W. reports research funding from Kite/Gilead, BMS, Novartis, ADC Therapeutics, Genentech, Morphosys, AstraZeneca, Janssen, and Precision Biosciences and consulting work with Kite/Gilead, BMS, Novartis, ADC Therapeutics, Genentech, Morphosys, AstraZeneca, Janssen, Iksuda, Umoja, and MonteRosa Therapeutics. All remaining authors declare no competing financial interests.
Correspondence: Michael R. Green, Department of Lymphoma & Myeloma, The University of Texas MD Anderson Cancer Center, 1515 Holcombe Blvd, Unit 903, Houston, TX 77030; e-mail: mgreen5@mdanderson.org; and Jason Westin, Department of Lymphoma & Myeloma, The University of Texas MD Anderson Cancer Center, 1515 Holcombe Blvd, Unit 429, Houston, TX 77030; e-mail: jwestin@mdanderson.org.
Presented in abstract form at the 63rd annual meeting of the American Society of Hematology, Atlanta, GA, 11 December 2021.
Raw data are available through the European Genome-Phenome Archive (EGA), accession EGAS00001006308.
The online version of this article contains a data supplement.
There is a Blood Commentary on this article in this issue.
The publication costs of this article were defrayed in part by page charge payment. Therefore, and solely to indicate this fact, this article is hereby marked “advertisement” in accordance with 18 USC section 1734.

This feature is available to Subscribers Only
Sign In or Create an Account Close Modal