TO THE EDITOR:
CD19-directed CAR T-cell therapy (CAR-T) has emerged as a promising treatment modality for multiple B-cell malignancies.1 However, its utility is hampered by a unique toxicity profile that classically includes cytokine release syndrome (CRS) and neurotoxicity. Hematological toxicity represents a vexing and common side effect.2-5 Cytopenia can occur long after lymphodepleting chemotherapy and resolution of CRS and is often prolonged and biphasic. Severe bone marrow (BM) failure has been described, which can predispose to severe infections and high non-relapse mortality.6-8 Overall, the underlying pathomechanisms of CAR T-cell–related hematotoxicity remain poorly understood.
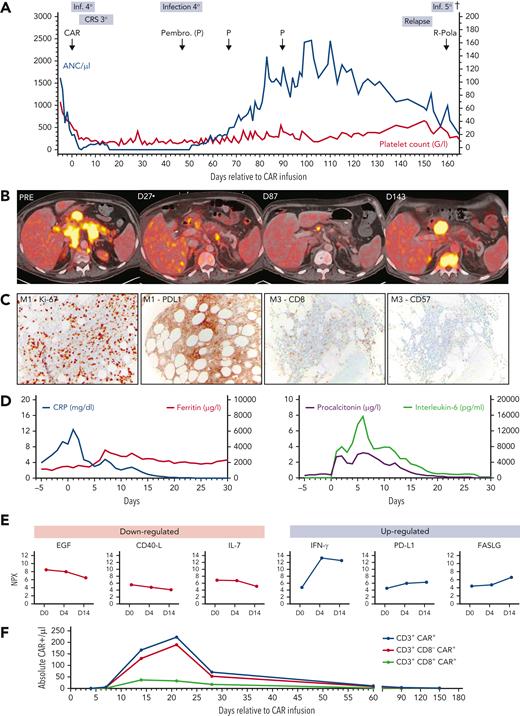
We present the case of a 57-year-old patient who received tisagenlecleucel for diffuse large B-cell lymphoma (DLBCL) transformed from chronic lymphocytic leukemia (CLL; Richter’s Syndrome). Disease manifestations included multilevel lymphadenopathy and extranodal disease of the duodenum, pleurae, and BM (70% infiltration). A combination of venetoclax, cyclophosphamide, and dexamethasone was applied as bridging therapy. The clinical course was notable for severe CRS (grade 3) and several episodes of infection (Figure 1A). Strikingly, the patient developed profound and prolonged neutropenia and transfusion dependency (Figure 1A), despite the application of growth factor (eg, granulocyte colony-stimulating factor), thrombopoietin agonists (eg, eltrombopag), and anti-cytokine therapy (eg, tocilizumab and anakinra). On 18fluorodeoxyglucose positron emission tomographic/computed tomographic imaging, a partial response was noted according to Lugano criteria (Figure 1B).9 Anti-lymphoma therapy was escalated with pembrolizumab, deepening the radiographic response (supplemental Figure 3, available on the Blood Web site). Eventually, neutrophil count recovery occurred around day 50, coinciding with decreased BM infiltration of the underlying LBCL (supplemental Figure 1). However, the patient ultimately relapsed and died of pneuomogenic sepsis on day 165. We performed further studies to understand the nature of CAR T-cell–related BM failure.
Clinical course of protracted cytopenia after CD19 CAR-T therapy. (A) Timeline of the absolute neutrophil count (per microliter; left y-axis) and platelet count (×109/L; right y-axis) from start of lymphodepletion (day −5) until the day of death (day 165). Significant clinical events are superimposed above the graph. (B) Radiographic evidence of partial response and eventual relapse in 18fluorodeoxyglucose positron emission tomographic/computed tomographic imaging across 4 time points. Abdominal lymphoma masses are depicted on transverse cross-sections. (C) BM biopsy findings 1 month after CAR infusion with immunohistochemical (IHC) staining for Ki-67 proliferation index and PD-L1 (left) and 3 months after CAR infusion (right, IHC for CD8+ and CD57+ T cells). Magnification of microscopy is 10×. (D) Dynamics of serum inflammatory markers from day 5 until day 30 after CAR T-cell infusion. CRP (blue) and ferritin (red) are depicted (left). Procalcitonin (purple) and interleukin-6 (green) are depicted on the right. (E) Overview of downregulated (left, red) and upregulated (right, blue) serum inflammatory markers. Protein levels are expressed in normalized protein expression (NPX) units, derived from Ct values. As NPX is expressed in a log2 scale, a 1-NPX difference translates into a doubling of protein concentration. (F) Flow cytometric analysis depicting the absolute number of CAR+ T cells (CD3+, CD3+/CD8-, CD3+/CD8+) over time.
Clinical course of protracted cytopenia after CD19 CAR-T therapy. (A) Timeline of the absolute neutrophil count (per microliter; left y-axis) and platelet count (×109/L; right y-axis) from start of lymphodepletion (day −5) until the day of death (day 165). Significant clinical events are superimposed above the graph. (B) Radiographic evidence of partial response and eventual relapse in 18fluorodeoxyglucose positron emission tomographic/computed tomographic imaging across 4 time points. Abdominal lymphoma masses are depicted on transverse cross-sections. (C) BM biopsy findings 1 month after CAR infusion with immunohistochemical (IHC) staining for Ki-67 proliferation index and PD-L1 (left) and 3 months after CAR infusion (right, IHC for CD8+ and CD57+ T cells). Magnification of microscopy is 10×. (D) Dynamics of serum inflammatory markers from day 5 until day 30 after CAR T-cell infusion. CRP (blue) and ferritin (red) are depicted (left). Procalcitonin (purple) and interleukin-6 (green) are depicted on the right. (E) Overview of downregulated (left, red) and upregulated (right, blue) serum inflammatory markers. Protein levels are expressed in normalized protein expression (NPX) units, derived from Ct values. As NPX is expressed in a log2 scale, a 1-NPX difference translates into a doubling of protein concentration. (F) Flow cytometric analysis depicting the absolute number of CAR+ T cells (CD3+, CD3+/CD8-, CD3+/CD8+) over time.
We performed sequential CAR T-cell immunoprofiling using a 2-step staining method with a biotinylated CD19 protein.10 We performed flow cytometry utilizing a panel of surface markers to profile peripheral blood mononuclear cells (PBMCs) in pre-CAR T- (day −8) and post-CAR T-cell (day +31) therapy samples, BM samples (days +27 and +47), and in a healthy donor (HD) control. For serum cytokine profiling, samples were collected serially across 3 time points (days 0, 4, and 14) and explored using a 92-protein multiplex proximity extension assay (Immuno-Oncology Panel; Olink Bioscience). We performed coupled single-cell RNA sequencing (scRNA-seq) and single-cell T-cell receptor sequencing (scTCR-seq) on pretreatment and posttreatment PBMC samples (days −8 and +31) and a HD control. Barcoding was performed using TotalSeq C hash-tag oligonucleotides (Biolegend). Stained cells were analyzed with the Chromium Single-Cell V(D)J Reagent Kit (10x Genomics). Pooled scRNA-seq libraries were sequenced (Illumina Novaseq), analyzed with the Seurat alignment algorithm, and visualized in t-distributed stochastic neighbor embedding plots (supplemental Materials). Gene Set Enrichment Analysis (GSEA) and Genomatix were used to interpret involved pathways and functions of differentially expressed genes.
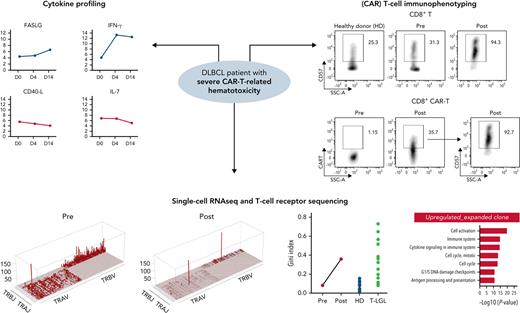
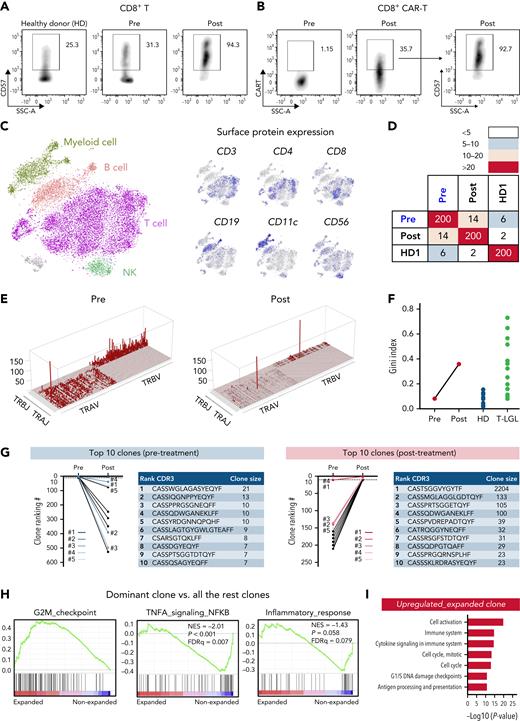
On BM biopsy, we observed persistent DLBCL infiltration with new upregulation of PD-L1 and a lymphocytic infiltrate consisting of CD8+CD57+ T cells (Figure 1C; supplemental Figure 1). Furthermore, we noted migration of CAR T-cells to the BM (supplemental Figure 2). Reflecting cytokine storm and coincident sepsis, the patient displayed high serum levels of C-reactive protein, procalcitonin, and interleukin-6 during the first 2 weeks after CAR T-cell infusion (Figure 1D). The observed cytokine signature was consistent with acquired aplastic anemia, including downregulation of EGF and CD40-L (Figure 1E).11 Notably, we observed a four-fold downregulation of the hematopoietic growth factor interleukin-7,12 whereas soluble interferon-γ, PD-L1, and FAS ligand were upregulated.13 Peak CAR T-cell expansion was detected on day 21 (Figure 1F). Flow cytometry showed a shift from central memory (CM; 28% to 2.6%) to effector memory (EM; 72% to 88%) CD4+ T-cells after CAR T-cell infusion (supplemental Figure 4). In contrast, the CD8+ T-cell population displayed lower EM, but increased terminal effector (TEF) cells, suggesting EM-to-TEF differentiation. The exhaustion marker PD-1 was markedly increased after treatment, especially in CD8+ T cells (supplemental Figure 5). CD57 expression, usually a marker of T-cell activation and clonal expansion in aplastic anemia14 and T-cell large granular lymphocytic leukemia (T-LGLL),15 was increased in both CD4+ and CD8+ T cells after treatment, particularly in CD8+ T cells (Figure 2A; supplemental Figure 6). CD57 expression was similar between both CAR and non-CAR–bearing CD4+ and CD8+ T cells, suggesting equivalent clonal expansion in both populations (Figure 2B; supplemental Figure 6).
Oligoclonal T-cell expansion in a CAR T-cell–treated patient with acquired BM deficiency. (A) Expression of CD57 in CD8+ T cells in pretreatment and posttreatment samples and in an HD control. (B) Expression of the CAR construct in CD8+ T cells in pretreatment and posttreatment samples (left), and expression of CD57 in CD8+ CAR T cells (right). (C) t-SNE plot of single-cell gene expression in PBMCs of pretreatment and posttreatment samples. Cells formed graph-based clusters based on transcriptome similarity and cell types were assigned to cell clusters (left). Expression of well-established surface markers (CD3, CD4, CD8, CD19, CD11c, and CD56) in top 20% cells were highlighted on the same t-SNE plot (right). (D) A heat map plot showing the number of shared CDR3 sequences among top 200 TCR clones of pretreatment and posttreatment samples. On both x-axes and y-axes, samples of the patient and HD are depicted; paired samples (pretreatment and posttreatment) are adjacent. Numbers indicate counts of identical T-cell receptor (TCR) clones shared among samples. The color scheme (red to light blue) indicates the number of shared TCR CDR3 sequences from high to low. (E) Skyscraper plots showing for Vβ/Vα and matching Jβ/Jα in pretreatment and posttreatment samples. (F) Gini index of TCR clone size distribution was compared in pretreatment and posttreatment samples and with reported HDs and patients with T-LGLL.17 (G) Ranking of the top 10 TCR clonotypes from pretreatment and posttreatment samples. Blue lines indicate the top 5 clones before treatment; red lines indicate the top 5 clones after treatment. CDR3 sequences and clone sizes (cell count) of top 10 clones in pretreatment and posttreatment samples are depicted to the right of the graph, respectively. (H) GSEA plots of differentially expressed genes of the dominant clone vs all the other clones in posttreatment samples. (I) Bar plot showing top upregulated pathways in the dominant clone of the posttreatment sample as analyzed by Genomatix using top differentially expressed genes. t-SNE, t-distributed stochastic neighbor embedding.
Oligoclonal T-cell expansion in a CAR T-cell–treated patient with acquired BM deficiency. (A) Expression of CD57 in CD8+ T cells in pretreatment and posttreatment samples and in an HD control. (B) Expression of the CAR construct in CD8+ T cells in pretreatment and posttreatment samples (left), and expression of CD57 in CD8+ CAR T cells (right). (C) t-SNE plot of single-cell gene expression in PBMCs of pretreatment and posttreatment samples. Cells formed graph-based clusters based on transcriptome similarity and cell types were assigned to cell clusters (left). Expression of well-established surface markers (CD3, CD4, CD8, CD19, CD11c, and CD56) in top 20% cells were highlighted on the same t-SNE plot (right). (D) A heat map plot showing the number of shared CDR3 sequences among top 200 TCR clones of pretreatment and posttreatment samples. On both x-axes and y-axes, samples of the patient and HD are depicted; paired samples (pretreatment and posttreatment) are adjacent. Numbers indicate counts of identical T-cell receptor (TCR) clones shared among samples. The color scheme (red to light blue) indicates the number of shared TCR CDR3 sequences from high to low. (E) Skyscraper plots showing for Vβ/Vα and matching Jβ/Jα in pretreatment and posttreatment samples. (F) Gini index of TCR clone size distribution was compared in pretreatment and posttreatment samples and with reported HDs and patients with T-LGLL.17 (G) Ranking of the top 10 TCR clonotypes from pretreatment and posttreatment samples. Blue lines indicate the top 5 clones before treatment; red lines indicate the top 5 clones after treatment. CDR3 sequences and clone sizes (cell count) of top 10 clones in pretreatment and posttreatment samples are depicted to the right of the graph, respectively. (H) GSEA plots of differentially expressed genes of the dominant clone vs all the other clones in posttreatment samples. (I) Bar plot showing top upregulated pathways in the dominant clone of the posttreatment sample as analyzed by Genomatix using top differentially expressed genes. t-SNE, t-distributed stochastic neighbor embedding.
After computational assignment of single cells,16 consistency was observed between gene expression–defined cell types and established surface protein expression profiles (Figure 2C). GSEA revealed upregulation of genes related to immune- and cell-cycling pathways in T cells (supplemental Figure 7A). In myeloid cells, immune response and inflammation-related pathways were upregulated, whereas genes related to antigen processing and presentation were downregulated (supplemental Figure 7B). Pathway analysis of top differentially expressed genes mirrored these findings (supplemental Figure 8). Although the pretreatment sample displayed multiclonal TCR usage, the posttreatment sample was oligoclonal, with a large, dominating T-cell clone (Figure 2E). Concomitantly, the Gini index of T-cell clone size distribution dramatically increased after CAR T-cell infusion, reaching a higher level than HD controls and similar to patients with T-LGLL with obvious T-cell clonal expansion (Figure 2F).17 Among the top 200 clones, only 14 were shared between pretreatment and posttreatment samples, indicating post–CAR T-cell clonal drift (Figure 2D). Most of the top 10 pretreatment clones declined in size, and only 1 post–CAR T-cell clone originated from the top 10 clones of the paired pretreatment sample (clone 4; Figure 2G). Of note, the dominant post–CAR T-cell clone originated from a pretreatment clone ranking of 11, with the relative clone size dramatically increasing from 1.3% to 76%. Both CAR and non–CAR-bearing T cells constituted the dominant clone. To understand the mechanism of dynamic clonal dominance, we compared gene expression profiles of the dominant clone versus all the other T-cell clones. In the dominant clone, we found elevated cell-cycle–related gene expression, and lower expression of genes involved in cell apoptosis, immune response, and inflammation (Figure 2H-I). Among the 500 T cells with highest CAR expression, we found decreased expression of genes involved in STAT signaling (P < .001) and inflammatory response (P = .03; supplemental Figure 9).
Our case illustrates the multifactorial nature of CAR T-cell–related hyporegenerative BM failure. First, the patient presented with underlying BM infiltration, affecting hematopoietic stem and progenitor cell function at baseline5 and predisposing for local inflammatory processes within the BM niche.4,18 Indeed, lymphocytic infiltrates including both CAR and non-CAR T cells were detected in the BM, perhaps a manifestation of “innocent bystander” killing.19,20 Concomitantly, neutropenia resolved after effective lymphoma treatment with pembrolizumab, which corresponded with decreasing BM infiltration. Second, the patient developed severe CRS and the associated cytokine patterns have been implicated in CAR-T–related hematotoxicity.2,4 Finally, we describe oligoclonal T-cell expansion, with clonality levels rivalling those of a reference T-LGLL population.17 Among the similarities to acquired aplastic anemia were effector memory CD8+CD57+ T-cell expansion and T-cell receptor oligoclonality.14,21 These findings were mirrored on a single-cell level, revealing dominant clones both in CAR and non–CAR-bearing T-cell populations. Predisposed subclones appear to have been present before product manufacture. Although the stimulus for clonal (CAR) T-cell expansion ultimately remains unclear, high-grade CRS and an inflammatory micromilieu due to BM infiltration represent potential culprits. Patients with underlying CLL may be at particular risk for clonal expansion phenomena,22,23 and the disease carries its own risk of autoimmune neutropenia.24 B-cell–depleting therapies such as rituximab have also been linked to clonal expansion and neutropenia, most likely related to T-cell imbalances facilitated by diminished T-cell/B-cell interactions.13,25 Importantly, the unique constellation of clinical features in our patient (eg, history of CLL, marrow involvement, high-grade CRS) makes it difficult to broadly extrapolate our findings to the majority of patients presenting with prolonged cytopenia after CAR T-cell infusion. Still, these hypothesis-generating findings introduce oligoclonal T-cell expansion as a potential contributing pathomechanism of CAR-T–related hematotoxicity, inviting future study.
This study was performed with institutional review board approval (LMU Project 19-817) in accordance with the 1964 Declaration of Helsinki and its later amendments. The patient provided informed, written consent.
Acknowledgments
The authors thank the patient and his family. We further thank Michael Winkelmann (Department of Radiology, LMU Munich), and Franziska Dekorsy (Department of Nuclear Medicine, LMU Munich) for their support with the imaging studies; Niklas Müller (formerly Department of Medicine III, LMU Munich) and Agnese Petrera (Helmholtz Center Munich) for assistance with the Olink panel experiments.
Authorship
Contribution: K.R., N.S.Y., and M.S. conceived the study; K.R., Z.W., V.B., W.G.K., S.M., S.K., S.G., V.L.B., L.F., C.S., M.v.B.-B., X.F., N.S.Y., and M.S. performed the investigation; K.R., Z.W., and S.G. performed the formal analysis and visualization; K.R., Z.W., S.G., and X.F. developed the methodology; K.R., Z.W., X.F., N.Y., and M.S. wrote the original draft of the manuscript; K.R., Z.W., V.B., W.G.K., S.M., S.K., S.G., V.L.B., C.S., M.v.B.-B., X.F., N.S.Y., and M.S. reviewed and edited the manuscript; and all authors read and approved the final version.
Conflict-of-interest disclosure: K.R. received research funding and travel support from Kite/Gilead: and honoraria from Novartis. V.B. has received honoraria and research funding from Novartis; has been a consultant to and received honoraria and research funding from Gilead; and has received research funding from Celgene and Janssen. V.L.B. has received honoraria from Amgen, Pfizer, Novartis, and Kite/Gilead and research funding from Celgene and Kite/Gilead. C.S. has been a consultant to and received honoraria from Celgene, Kite/Gilead, and Novartis. M.v.B.-B. has been a consultant to and received research funding and honoraria from MSD Sharp & Dohme, Novartis, Roche, Kite/Gilead, Bristol-Myers Squibb, Astellas, Mologen, and Miltenyi. N.S.Y. has a collaborative research and development agreement between the National Institutes of Health and Novartis for laboratory funding. M.S. has received research funding from Morphosys; has been a consultant to and received research funding from Novartis; has been a consultant to Janssen; has received research funding from Seattle Genetics; has a consultancy with and has received honoraria, and research funding from Amgen; has been a consultant to and received honoraria from Celgene, Kite/Gilead, and Roche AG; and has received research funding from Kite/Gilead. The remaining authors declare no competing financial interests. None of the mentioned conflicts of interest were related to financing of the content of this manuscript.
Correspondence: Marion Subklewe, Laboratory for Translational Cancer Immunology, LMU Gene Center, Feodor-Lynen-Sraße 35, 81377 Munich, Germany; e-mail: marion.subklewe@med.uni-muenchen.de; and Neal S. Young, Hematology Branch, National Heart, Lung, and Blood Institute, Bldg 10-CRC, Room 3E-5140, 10 Center Dr, Bethesda, MD 20892-1202; e-mail: youngns@mail.nih.gov.
References
Author notes
∗K.R. and Z.W. contributed equally to this study.
†N.S.Y. and M.S. contributed equally to this study.
The online version of this article contains a data supplement.


This feature is available to Subscribers Only
Sign In or Create an Account Close Modal