

Key Points
N-glycosylation is essential for mutant CALR-driven oncogenic transformation.
CALR-mutant cells are preferentially sensitive to pharmacological inhibition of N-glycosylation.

Abstract
Calreticulin (CALR) mutations are frequent, disease-initiating events in myeloproliferative neoplasms (MPNs). Although the biological mechanism by which CALR mutations cause MPNs has been elucidated, there currently are no clonally selective therapies for CALR-mutant MPNs. To identify unique genetic dependencies in CALR-mutant MPNs, we performed a whole-genome clustered regularly interspaced short palindromic repeats (CRISPR) knockout depletion screen in mutant CALR-transformed hematopoietic cells. We found that genes in the N-glycosylation pathway (among others) were differentially depleted in mutant CALR-transformed cells as compared with control cells. Using a focused pharmacological in vitro screen targeting unique vulnerabilities uncovered in the CRISPR screen, we found that chemical inhibition of N-glycosylation impaired the growth of mutant CALR-transformed cells, through a reduction in MPL cell surface expression. We treated Calr-mutant knockin mice with the N-glycosylation inhibitor 2-deoxy-glucose (2-DG) and found a preferential sensitivity of Calr-mutant cells to 2-DG as compared with wild-type cells and normalization of key MPNs disease features. To validate our findings in primary human cells, we performed megakaryocyte colony-forming unit (CFU-MK) assays. We found that N-glycosylation inhibition significantly reduced CFU-MK formation in patient-derived CALR-mutant bone marrow as compared with bone marrow derived from healthy donors. In aggregate, our findings advance the development of clonally selective treatments for CALR-mutant MPNs.
Introduction
The identification of novel therapeutic vulnerabilities in calreticulin (CALR)-mutant myeloproliferative neoplasms (MPNs) has the potential to be transformative in the treatment of this challenging disease. This assertion is based on the facts that CALR mutations are disease-initiating events in MPNs, that CALR mutations alone are sufficient to cause MPNs, and that CALR mutations occur frequently in ∼20% to 25% of all MPNs cases.1,2 Despite the common occurrence of CALR mutations in MPNs, there are currently no treatment strategies to preferentially target CALR-mutant cells over normal cells.3
CALR mutations found in MPNs typically consist of insertions or deletions in exon 9 resulting in a +1 bp frameshift and the generation of a novel, mutant-specific C-terminus. CALR mutations are almost exclusively found to be heterozygous, and 2 mutations account for ∼80% of all CALR mutations. A 52 bp deletion (CALRΔ52) is present in ∼50% of patients, and a 5 bp insertion is present in ∼30% of patients.1,2,4 We have previously shown that transformation of hematopoietic cells to cytokine independence in the context of CALRΔ52 expression depends on the binding of CALRΔ52 to the thrombopoietin receptor MPL and its subsequent activation.5 Importantly, this interaction is dependent on N-glycosylation sites in the extracellular domain of MPL and lectin-binding sites of mutant CALR.6 Moreover, MPL cell surface expression is dependent on MPL N-glycosylation.7 A CalrΔ52 mutant knockin mouse model mirrors the phenotype seen in CALR-mutant MPNs patients, demonstrating a marked increase in platelet count, megakaryocyte hyperplasia, and progression to myelofibrosis in aged mice.8
Although the mechanism of mutant CALR-induced MPNs is known to involve pathogenic binding between mutant CALR and MPL,5,7,9-11 this insight has not yet been exploited therapeutically. Although patients with myelofibrosis harboring mutations in CALR demonstrate clinical responses to the JAK2 inhibitor ruxolitinib, the mutant CALR variant allele fraction does not decline with ruxolitinib treatment.12 More recently, similar findings have been reported for CALR-mutant MPNs treated with pegylated interferon (ie, clinical responses in the absence of reducing mutant CALR variant allele fractions).13 Indeed, a major deficiency in the treatment of MPNs is the lack of clonally selective therapeutic agents with curative potential. Hence, we set out to discover and validate unique genetic dependencies for mutant CALR-driven oncogenesis.
Using unbiased approaches, we have (1) identified differential genetic vulnerabilities of mutant CALR-transformed hematopoietic cells; (2) validated that transformation by mutant CALR is dependent on Dpm2, a key gene in the N-glycan biosynthesis pathway; and (3) shown that inhibition of N-glycosylation normalizes key features of MPNs and preferentially targets Calr-mutant cells in vivo.
Methods
Patients
Human platelet RNA sequencing (RNA-seq)
All MPNs peripheral blood samples were obtained under written informed patient consent and were fully anonymized. Study approval was provided by the Stanford University Institutional Review Board.
Bone marrow samples for megakaryocyte colony-forming unit assays
Patients and controls gave written informed consent and bone marrow samples were acquired using institutional review board–approved protocols at Dana-Farber Cancer Institute/Brigham and Women’s Hospital and Boston Children’s Hospital, respectively.
CRISPR depletion screens
Clustered regularly interspaced short palindromic repeats (CRISPR) screens were performed in collaboration with the Genetic Perturbation Platform at the Broad Institute. For the whole-genome screen, we used 2 biological replicates of BA/F3-MPL-pMSCV-IRES-GFP-EV and pMSCV-IRES-GFP-CALRΔ52 cells. For the secondary CRISPR pooled screen, we used 4 different biological replicates each. These lines were cultured in the presence of interleukin-3 (IL3) and 130 million cells (whole-genome screen) or 4 million cells (pooled screen) were infected with the lentivirus (pBrie library) on subsequent days at multiplicity of infection of 0.3, with 4 μg/mL polybrene. Twenty-four hours postinfection, cells were selected with 1 μg/mL puromycin for a total of 3 days. On day 7, the cells were split and 80 million cells (whole genome) or 16 million cells (pooled screen) per genotype cultured either in the presence or absence of IL3. Genomic DNA was isolated another 14 days later using the NucleoSpin Blood XL-Maxi kit (Clontech Cat. #740950) with RNase A (Clontech Cat, #740505) treatment. DNA concentration was measured with the Quant-iT PicoGreen dsDNA Assay Kit (ThermoFisher Scientific, #P11496). DNA was submitted to the Broad Institute’s Genetic Perturbation Platform for next-generation sequencing (NGS) (Illumina HiSeq2000).
Experimental details of generation of BA/F3 cell lines, BA/F3 cell proliferation assays, chemical screen, CRISPR/CRISPR-associated protein 9 (Cas9) gene editing, NGS of CRISPR-targeted regions, Dpm2 single-guide RNA (sgRNA) rescue experiment, MPL N-glycan analysis, intracellular phosphoprotein flow cytometry analysis, competitive bone marrow transplant, in vivo pharmacological studies, complete blood cell count analysis, stem and progenitor cell analysis, additional immunophenotypic analyses, tissue N-glycan analyses, colony assays of megakaryocyte progenitors, and patient studies, as well as bioinformatic and statistical analyses, are described in supplemental Methods (available on the Blood Web site).
Results
Unbiased whole-genome CRISPR depletion screen identifies pathways essential for oncogenic transformation by CALRΔ52
To identify genes and pathways that are differentially required for the cytokine-independent growth of CALRΔ52 cells, we performed a whole-genome CRISPR/Cas9 knockout depletion screen in CALRΔ52 MPL-expressing hematopoietic cells. We aimed to identify genes that were differentially required for the growth of CALRΔ52-transformed cells as compared with empty vector-transduced control cells. To do so, we ectopically expressed the human thrombopoietin receptor MPL in parental BA/F3 (Figure 1A). BA/F3-MPL–expressing cells were then transduced either with an empty vector control (EV) or human CALRΔ52. Two independent biological replicates were produced and subjected to transduction with a whole-genome Cas9 sgRNA library containing 4 sgRNAs per gene (Figure 1A). Cas9-sgRNA–transduced cells were selected with puromycin. On day 7, cell lines were split into cultures grown either in the presence or absence of IL3, the cytokine required for the growth of parental BA/F3-MPL cells. Two weeks later, DNA from these cells was harvested and subjected to NGS (Figure 1A; supplemental Figure 1). As expected, BA/F3-MPL-EV cells were cytokine dependent, whereas BA/F3-MPL-CALRΔ52 grew well in both the presence and absence of cytokine (Figure 1B). We found 669 genes to be significantly depleted in CALRΔ52-transformed cells as compared with EV cells grown in the presence of IL3, with a log2 fold change > 1 (supplemental Table 1). Strikingly, among the top 10 most differentially depleted genes in CALRΔ52 cells, 7 are involved in protein glycosylation (Figure 1C-D). Conversely, the most significantly differentially depleted gene in the EV control was IL3 receptor α (ll3ra) (supplemental Figure 1D). Of note, the whole-genome library did not contain sgRNAs directed against human MPL or human mutant CALR. However, the sgRNAs directed against mouse Calr each contained only 0 to 2 mismatches with human mutant CALR, which explains how murine Calr was significantly differentially depleted in CALRΔ52-transformed cells (Figure 1C). Using gene set enrichment analyses (GSEA), we identified the N-glycan biosynthesis, the protein secretion pathway, and the unfolded protein response (UPR) to be among the most significantly differentially depleted pathways (false discovery rate q values < 0.001, 0.025, and 0.014, respectively) in transformed CALRΔ52 cells (Figure 2A-C). This was true, both in the comparison of CALRΔ52 −IL3 vs EV control and CALRΔ52−IL3 vs CALRΔ52+IL3 (Figure 2A-C). Our CRISPR screen reveals pathways required for MPL-dependent transformation as prosurvival signaling and cell growth in the absence of IL3 can only occur through MPL in CALRΔ52-transformed cells.
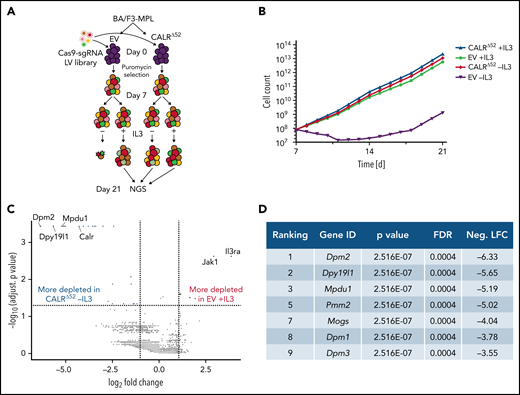
Whole-genome CRISPR knock-out depletion screen identifies genes differentially required for the growth of mutant CALR-transformed BA/F3-MPL cells. (A) Experimental setup of the whole-genome CRISPR depletion screen on BA/F3 cells. n = 2 independent biological replicates each. (B) Growth curve of BA/F3-MPL cells after splitting into 2 culturing conditions at day 7 (+IL3/−IL3). (C) Volcano plot depicting significance and fold change of depleted genes, separated by the conditions stated, highlighting the most significant depleted genes for each condition. Log2 fold change threshold = ±1. FDR adjusted P < .05. (D) Genes involved in protein glycosylation among the 10 most significantly depleted genes comparing CALRΔ52 −IL3 vs EV +IL3 are shown, ranked by log2 fold change. FDR, false discovery rate; neg. LFC, negative log2 fold change; LV, lentivirus.
Whole-genome CRISPR knock-out depletion screen identifies genes differentially required for the growth of mutant CALR-transformed BA/F3-MPL cells. (A) Experimental setup of the whole-genome CRISPR depletion screen on BA/F3 cells. n = 2 independent biological replicates each. (B) Growth curve of BA/F3-MPL cells after splitting into 2 culturing conditions at day 7 (+IL3/−IL3). (C) Volcano plot depicting significance and fold change of depleted genes, separated by the conditions stated, highlighting the most significant depleted genes for each condition. Log2 fold change threshold = ±1. FDR adjusted P < .05. (D) Genes involved in protein glycosylation among the 10 most significantly depleted genes comparing CALRΔ52 −IL3 vs EV +IL3 are shown, ranked by log2 fold change. FDR, false discovery rate; neg. LFC, negative log2 fold change; LV, lentivirus.
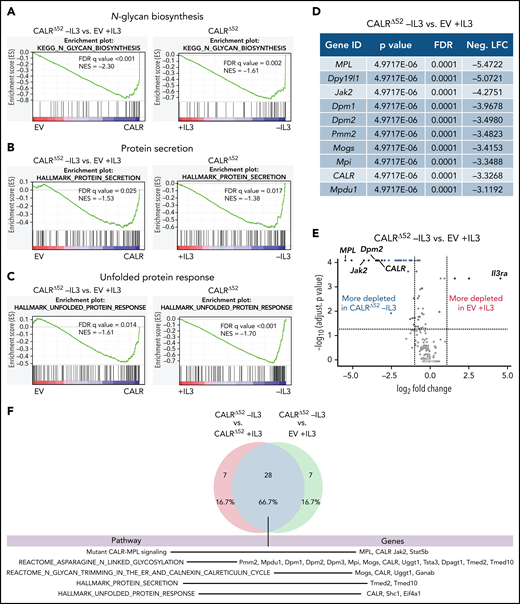
Whole-genome CRISPR depletion screen identifies pathways differentially required for the growth of mutant CALR-transformed BA/F3-MPL cells, validated in a secondary CRISPR pooled screen. GSEA on the whole-genome CRISPR screen showing that genes in the N-glycan biosynthesis pathway (A), the protein secretion pathway (B), as well as the UPR pathway (C) are differentially depleted in CALRΔ52 −IL3 cells as compared with EV plus IL3 cells. GSEA ranking for the pathways indicated was performed with the genes rank-ordered based on fold change. Genes that are more depleted in EV +IL3 condition are represented on the left and genes that are more depleted in CALRΔ52 −IL3 condition are represented on the right. The comparison for CALRΔ52 −IL3 vs CALRΔ52 +IL3 is shown on the right side of each panel. (D-F) Results of the CRISPR pooled screen for validation of the whole-genome CRISPR screen. (D) Gene ranking, comparing CALRΔ52 −IL3 with empty vector +IL3. The 10 most differentially depleted genes for CALRΔ52 (as compared with EV +IL3 cells) are shown, ranked by corrected P values. Genes involved in protein glycosylation are highlighted in dark blue. (E) Volcano plot depicting significance and fold change of depleted genes, separated by the conditions stated, highlighting Dpm2 and important control genes. Log2 fold change threshold = ±1. FDR adjusted P threshold = .05. (F) Venn diagram depicting the significantly depleted genes, comparing overlapping hits in the comparisons stated. FDR, false discovery rate; neg. LFC, negative log2 fold change; NES, normalized enrichment score.
Whole-genome CRISPR depletion screen identifies pathways differentially required for the growth of mutant CALR-transformed BA/F3-MPL cells, validated in a secondary CRISPR pooled screen. GSEA on the whole-genome CRISPR screen showing that genes in the N-glycan biosynthesis pathway (A), the protein secretion pathway (B), as well as the UPR pathway (C) are differentially depleted in CALRΔ52 −IL3 cells as compared with EV plus IL3 cells. GSEA ranking for the pathways indicated was performed with the genes rank-ordered based on fold change. Genes that are more depleted in EV +IL3 condition are represented on the left and genes that are more depleted in CALRΔ52 −IL3 condition are represented on the right. The comparison for CALRΔ52 −IL3 vs CALRΔ52 +IL3 is shown on the right side of each panel. (D-F) Results of the CRISPR pooled screen for validation of the whole-genome CRISPR screen. (D) Gene ranking, comparing CALRΔ52 −IL3 with empty vector +IL3. The 10 most differentially depleted genes for CALRΔ52 (as compared with EV +IL3 cells) are shown, ranked by corrected P values. Genes involved in protein glycosylation are highlighted in dark blue. (E) Volcano plot depicting significance and fold change of depleted genes, separated by the conditions stated, highlighting Dpm2 and important control genes. Log2 fold change threshold = ±1. FDR adjusted P threshold = .05. (F) Venn diagram depicting the significantly depleted genes, comparing overlapping hits in the comparisons stated. FDR, false discovery rate; neg. LFC, negative log2 fold change; NES, normalized enrichment score.
A CRISPR pooled screen confirms unique CALRΔ52 pathway dependencies
We next performed a secondary CRISPR pooled screen focused on differentially depleted pathways in CALRΔ52-transformed cells identified in the whole-genome screen (supplemental Figure 2). In addition to 8 sgRNAs per gene against ∼250 selected murine genes and 5% intronic and 5% nontargeting (NTG) controls, we included sgRNAs against human mutant CALR and human MPL (supplemental Table 2). As expected, MPL, CALR, and Jak2 were among the top 10 most differentially depleted genes in transformed CALRΔ52 vs EV control cells (Figure 2D-E; supplemental Table 3). The remaining most depleted genes are involved in protein glycosylation (Figure 2D). When comparing “hits” between CALRΔ52−IL3 vs EV +IL3 controls and CALRΔ52 −IL3 vs CALRΔ52+IL3, we identified 28 overlapping genes (Figure 2F), including important control genes in the screen (eg, CALR, MPL, Jak2, and Stat5b). Importantly, we found that the majority of overlapping genes are involved in protein glycosylation (eg, Dpm1-3), protein secretion (eg, Tmed2 and Tmed10), or UPR (Eif4a1) (Figure 2F), validating these as key pathways for mutant CALR-driven cellular transformation. Four significantly depleted genes in transformed CALRΔ52−IL3 cells encode proteins involved in the enzymatic activity of dolichol-phosphate mannose synthase (DPM1, DPM2, DPM3, and MPDU1). This enzyme complex synthesizes dolichol d-mannosyl phosphate, an essential substrate for protein glycosylation.14,15 Importantly, these findings from an unbiased genome-wide screen align with prior mechanistic studies demonstrating that the N-glycosylation sites on MPL are required for MPL cell surface expression and the oncogenic interaction between MPL and mutant CALR.6,7,10,16-18
The requirement for Dpm2 for CALRΔ52-driven cellular transformation is MPL dependent
Dpm2, which was the most depleted gene in the genome-wide screen and was validated in the secondary pooled screen, is essential for protein N-glycosylation.14,15 Hence, we next performed single-gene CRISPR/Cas9 knockout validation studies targeting Dpm2. We transduced 4 independent BA/F3-MPL-EV and -CALRΔ52–expressing cell lines with Cas9-expressing virus, followed by transduction with 2 separate NTG or Dpm2-targeting sgRNAs (Figure 3A). Pools of BA/F3-MPL-EV/CALRΔ52-Cas9-NTG or -ΔDpm2 cells were then subjected to proliferation assays and functional downstream analyses (Figure 3B-F; supplemental Figure 3A). We found that Dpm2 is required for CALRΔ52-mediated transformation, as demonstrated by increased cell death, decreased MPL cell-surface levels, and reduced phosphorylated STAT5 upon Dpm2 knockout compared with NTG controls (Figure 3B-D). Importantly, cells cultured in cytokine-rich medium were unaffected by Dpm2 loss (Figure 3B). Loss of MPL surface expression forces BA/F3 cells to signal through their endogenous ILR3A, rendering them cytokine-dependent. Of note, Dpm2 knockout escapees upon 96 hours of IL3 withdrawal showed MPL cell-surface expression comparable to NTG controls (Figure 3C). Furthermore, upon cytokine withdrawal, a subclone of nonedited Dpm2wildtype (WT) CALRΔ52 cells grew out and dominated the culture after 96 hours, further demonstrating the requirement for Dpm2 for the survival of CALRΔ52-transformed cells (Figure 3E). Because MPL N-glycosylation is essential for mutant CALR-mediated transformation, we performed N-glycan profiling after immunoprecipitation of MPL in BA/F3-MPL-EV-NTG and BA/F3-MPL-EV-ΔDpm2 cells. As expected, Dpm2 knockout reduced MPL N-glycosylation by ∼75% (Figure 3F), similar to the percentage of cells with deleterious Dpm2 mutations (Figure 3E). To confirm that the observed growth effects are due to on-target inactivation of Dpm2, we performed a rescue experiment, reexpressing either WT Dpm2 or sgRNA-resistant Dpm2 into BA/F3-MPL-EV/CALRΔ52-Cas9-ΔDpm2 cells. sgRNA-resistant Dpm2 overexpression fully rescued the phenotype by restoring cytokine independence (Figure 3G). Although expression of WT Dpm2 resulted in a growth delay, a pool of cells picked up growth after 48 hours, consistence with the emergence of Dpm2 escapees as depicted in Figure 3B. Additionally, we observed a >50% reduction in ex vivo myeloid colony formation of murine CalrΔ52Dpm2 knockout bone marrow (BM) compared with CRISPR-Cas9 NTG controls, with nonsignificant effects on Calr+/+ BM cells (Figure 3H). To determine if the dependence on Dpm2 was mutant CALR-specific, we performed the single-gene Dpm2 knockout experiments in BA/F3-MPL-Jak2V617F–transformed cells. Jak2V617F-transformed Dpm2 knockout BA/F3-MPL cells showed the same growth disadvantage as CALRΔ52-transformed cells, as well as decreased MPL surface expression, reduced pSTAT5 levels, and an outgrowth of nonedited Jak2WT cells (supplemental Figure 3B-E). In aggregate, these findings indicate that the requirement for Dpm2 for mutant CALR-driven cellular transformation is MPL-dependent and suggest that Dpm2 loss impairs MPL cell-surface expression as a consequence of diminished MPL N-glycosylation.
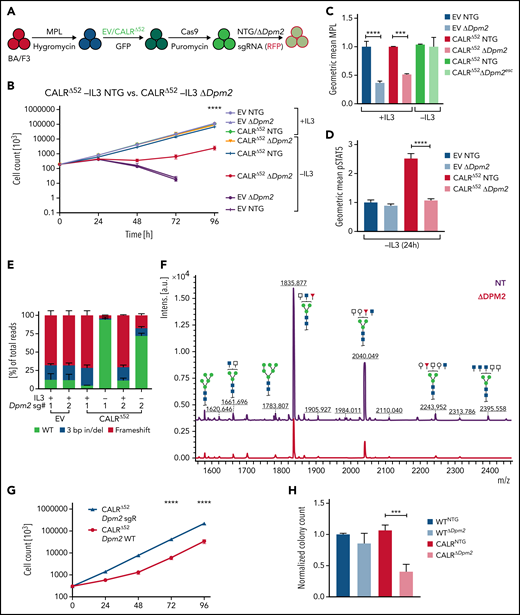
In-depth validation of the N-glycan biosynthesis pathway as an essential pathway for growth of mutant CALR-expressing hematopoietic cells. (A) Experimental setup: parental BA/F3 cells were infected with MPL-expressing virus, selected for 21 days with hygromycin, and infected with either EV- or CALRΔ52-expressing virus carrying GFP. GFP+ cells were subsequently sorted and transduced with Cas9-carrying virus. Following 7 days of puromycin selection (1 mg/mL), cells were then infected with RFP-expressing viruses containing either 1 of 2 NT sgRNAs (NTG) or 1 of 2 sgRNAs directed against Dpm2. RFP+ cells were sorted and subsequently subjected to functional assays. N = 2 independent biological replicates for BA/F3-MPL-EV and -CALRΔ52-Cas9. Two NTGs and 2 targeting sgRNAs per biological replicate with a total of n = 4 biological replicates per genotype. (B) Growth curves of independent biological replicates and the 2 different sgRNAs were combined in the analysis. Cells were assayed either in the presence or absence of IL3 (+IL3/−IL3) for up to 96 hours. The assay was performed n = 3 for all 4 biological replicates of both genotypes. Statistical significance was determined by 2-way analysis of variance (ANOVA). Mean plus and minus standard error of the mean (SEM). ****P < .00001. The most important statistical analysis is highlighted. (C) Cell surface expression for MPL of the cells used in (B), determined by flow cytometry. (D) phosphorylated STAT5 levels 24 hours upon withdrawal of IL3 of indicated cell lines. (C-D) Statistical significance was determined by 1-way ANOVA. Mean plus SEM. **P < .01; ****P < .0001. (E) NGS results of the CRISPR-targeted regions in the Dpm2 gene in the cell lines depicted. In the CALRΔ52Dpm2-targeted −IL3 condition (96 hours post IL3 withdrawal), there is a strong enrichment for Dpm2 WT subclones as compared with the CALRΔ52Dpm2-targeted +IL3 condition, indicating that Dpm2 is required for the growth of CALRΔ52-transformed cells. Mean plus SEM. (F) N-glycan profile of immunoprecipitated MPL from BA/F3-MPL-EVΔ52-Cas9-NTG and BA/F3-MPL-EVΔ52-Cas9-ΔDpm2 cells. (G) Growth curve of BA/F3-MPL-CALRΔ52-Cas9-ΔDpm2-WT and -Dpm2-sgRNA-resistant (sgR) cells grown for 96 hours upon IL3 withdrawal. N = 3 in duplicate. Statistical significance was determined by 1-way ANOVA. ****P < .0001. Mean plus or minus SEM. (H) Colony-forming assays on RFP-sorted CALRΔ52 VaviCre Cas9 BM transduced with NTG or Dpm2-targeting (ΔDpm2) RFP virus. N = 4 to 5 in technical duplicates. Statistical significance was determined by 1-way ANOVA. Mean plus SEM. ***P < .001. a.u., arbitrary units; esc, escapee: these are cells that survived IL3 withdrawal for 96 hours.
In-depth validation of the N-glycan biosynthesis pathway as an essential pathway for growth of mutant CALR-expressing hematopoietic cells. (A) Experimental setup: parental BA/F3 cells were infected with MPL-expressing virus, selected for 21 days with hygromycin, and infected with either EV- or CALRΔ52-expressing virus carrying GFP. GFP+ cells were subsequently sorted and transduced with Cas9-carrying virus. Following 7 days of puromycin selection (1 mg/mL), cells were then infected with RFP-expressing viruses containing either 1 of 2 NT sgRNAs (NTG) or 1 of 2 sgRNAs directed against Dpm2. RFP+ cells were sorted and subsequently subjected to functional assays. N = 2 independent biological replicates for BA/F3-MPL-EV and -CALRΔ52-Cas9. Two NTGs and 2 targeting sgRNAs per biological replicate with a total of n = 4 biological replicates per genotype. (B) Growth curves of independent biological replicates and the 2 different sgRNAs were combined in the analysis. Cells were assayed either in the presence or absence of IL3 (+IL3/−IL3) for up to 96 hours. The assay was performed n = 3 for all 4 biological replicates of both genotypes. Statistical significance was determined by 2-way analysis of variance (ANOVA). Mean plus and minus standard error of the mean (SEM). ****P < .00001. The most important statistical analysis is highlighted. (C) Cell surface expression for MPL of the cells used in (B), determined by flow cytometry. (D) phosphorylated STAT5 levels 24 hours upon withdrawal of IL3 of indicated cell lines. (C-D) Statistical significance was determined by 1-way ANOVA. Mean plus SEM. **P < .01; ****P < .0001. (E) NGS results of the CRISPR-targeted regions in the Dpm2 gene in the cell lines depicted. In the CALRΔ52Dpm2-targeted −IL3 condition (96 hours post IL3 withdrawal), there is a strong enrichment for Dpm2 WT subclones as compared with the CALRΔ52Dpm2-targeted +IL3 condition, indicating that Dpm2 is required for the growth of CALRΔ52-transformed cells. Mean plus SEM. (F) N-glycan profile of immunoprecipitated MPL from BA/F3-MPL-EVΔ52-Cas9-NTG and BA/F3-MPL-EVΔ52-Cas9-ΔDpm2 cells. (G) Growth curve of BA/F3-MPL-CALRΔ52-Cas9-ΔDpm2-WT and -Dpm2-sgRNA-resistant (sgR) cells grown for 96 hours upon IL3 withdrawal. N = 3 in duplicate. Statistical significance was determined by 1-way ANOVA. ****P < .0001. Mean plus or minus SEM. (H) Colony-forming assays on RFP-sorted CALRΔ52 VaviCre Cas9 BM transduced with NTG or Dpm2-targeting (ΔDpm2) RFP virus. N = 4 to 5 in technical duplicates. Statistical significance was determined by 1-way ANOVA. Mean plus SEM. ***P < .001. a.u., arbitrary units; esc, escapee: these are cells that survived IL3 withdrawal for 96 hours.
Pharmacological inhibition of N-glycosylation inhibits CALR-mutant cell growth in vitro
To enable clinical translation, we performed a focused pharmacological screen targeting differentially depleted pathways, including the N-glycosylation, protein secretion, UPR, and RNA splicing pathways (supplemental Figure 4; supplemental Table 4). We hand selected 64 compounds previously described to target these pathways or other genes identified in the whole-genome CRISPR screen (supplemental Table 3). BA/F3-MPL–expressing cells expressing either EV, CALRΔ52, or Jak2V617F were incubated in either dimethyl sulfoxide (DMSO) control or active drug, and the live cell count was determined 72 hours after drug administration by high-throughput flow cytometry (supplemental Figure 4A). During this drug screen, BA/F3-MPL-CALRΔ52 and BA/F3-MPL-Jak2V617F cells were grown in the absence of IL3 to induce MPL-mediated cellular transformation, whereas BA/F3-MPL-EV cells were grown in the presence of IL3. Of the 64 drugs screened, 32 displayed preferential growth inhibition of CALRΔ52 and Jak2V617F over EV-transduced cells. Almost all drugs inhibited growth of both CALRΔ52 and Jak2V617F cells to a similar extent, suggesting a common mechanism of action. The largest differential growth inhibition in CALRΔ52-transformed cells as compared with EV control cells was seen in response to chemicals targeting N-glycosylation (supplemental Figure 4B-F), protein secretion (supplemental Figure 4G-H), and the UPR (supplemental Figure 4I). Of these, the only pathway in which all compounds screened (ie, 5 of 5) showed differential growth inhibition in transformed CALRΔ52 cells as compared with EV control cells was the N-glycosylation pathway.
N-glycosylation inhibitors reduce MPL surface expression and intracellular pSTAT5 signaling in CALRΔ52-transformed cells
To validate our drug screen and test more specific N-glycosylation inhibitors (Figure 4A), we treated BA/F3-MPL-EV and BA/F3-MPL-CALRΔ52 cells with 2-DG (Figure 4A-C; supplemental Figure 5A) and 3 N-glycosylation inhibitors that were not used in the drug screen: tunicamycin (Figure 4D-E; supplemental Figure 5B), NGI1 (Figure 4F-G; supplemental Figure 5C), and castanospermine (Figure 4H-I; supplemental Figure 5D). Tunicamycin has previously been shown to decrease pSTAT5 levels in CALR mutant-transformed 32D cells.19 All compounds demonstrated differential growth inhibition of CALRΔ52-transformed cells compared with EV+IL3 control cells in a dose- and time-dependent manner and reduced MPL surface expression and downstream pSTAT5 signaling. Cell growth, MPL surface expression, and pSTAT5 signaling were also reduced in Jak2V617F-transformed BA/F3-MPL cells following the same treatment (Figure 4C,E,G,I; supplemental Figure 5A-H). Moreover, tunicamycin reduced colony formation in primary mouse CalrΔ52/+ and CalrΔ52/Δ52 cells, whereas colony formation of control Calr+/+ cells was unperturbed (supplemental Figure 5I). Because 2-DG has been used successfully in in vivo mouse models20 and tested in human clinical trials (#NCT00096707, clinicaltrials.gov; CTRI/2020/06/025664),21,22 we selected 2-DG for further studies.
![N-glycosylation inhibitors preferentially reduce growth of mutant CALR-transformed cells and reduce MPL surface expression. (A) Overview of N-glycosylation biosynthesis and endoplasmic reticulum (ER)-resident trimming proteins (labeled in black) differentially required for growth of CALRΔ52-transformed cells (compared with EV or CALRΔ52 cells grown in the presence of IL3) as determined by scoring as a “hit” in either of our 2 CRISPR screens (negative log2 fold change > 1). After biosynthesis of the N-glycan tree (dolichol-P-P-GlcNAc2Man9Glc3), it is transferred to a newly synthesized glycoprotein such as MPL (red line) by the OST complex. OST complex members that scored in our screens include OST4, OSTC, STT3A, RPN1, RPN2, and DAD1. CALR then binds and folds the glycoprotein. The graph also depicts the mode of action of N-glycosylation inhibitors (labeled in red) used in B-I. (B) Growth curves of BA/F3-MPL-EV or -CALRΔ52–expressing cells in the presence or absence of IL3, respectively. Cells were treated with DMSO, 10 μM or 50 μM 2-deoxyglucose (2-DG). Data were normalized to DMSO control for each cell line. (C) Normalized geometric mean MPL (CD110) cell surface expression of BA/F3-MPL-EV, -CALRΔ52, or –Jak2V617F–expressing cells following 2-DG treatment for 24 hours. EV control cells were grown in the presence of IL3, CALRΔ52, and Jak2V617F cells in the absence of IL3. (D-I) Growth curves and MPL surface expression as described in panels B-C. DMSO, 1 μM tunicamycin (D-E), DMSO, 1 μM or 10 μM ML414, 5-[(Dimethylamino)sulfonyl]-N-(5-methyl-2-thiazolyl)-2-(1-pyrrolidinyl)-benzamide (NGI1) (F-G), and DMSO, 20, or 50 μM castanospermine (H-I). Statistical significance in panels B, D, F, and H was calculated using 2-sided Student t tests at the 72-hour time point. Growth curves were performed in duplicate 2 to 4 times. Statistical significance in panels C, E, G, and I was determined using 1-way analysis of variance. MPL measurements were performed in duplicate 2 to 3 times. The most important statistical analyses are highlighted. Mean plus or minus standard error of the mean. *P < .05; **P < .01; ***P < .001; ****P < .0001. Fruc, fructose; Glc, glucose; Man, Mannose; mRNA, messenger RNA; P, phosphate.](https://ash.silverchair-cdn.com/ash/content_public/journal/blood/140/11/10.1182_blood.2022015629/9/m_bloodbld2022015629f4a.png?Expires=1769371402&Signature=2cMBzp5~Gn2pe8PQB4JUAjRyUUMXrAKV9k15tVDB9UD8MWRKlc7miUdH~rsMIfar3YeQKcv6TeRtThno0t9w4-Aj9dNmEilVTlp6HH4JeL~3DYqCYMfr6TO-qXVOoDeDNDz5C8--LFHXI4XyBXbcCWpRufMmosjlJT5kYUB57m7FLRo4lkzP9Xwzq4pGxz8rWuWVp8J9lvY8W9Eez-ZjKQaiEFZEjKGXLxf5SpVqStie0mVeiXbkeq5598lXFJSq3Kdt6EqA6EkFjCxplCeR~TvcPwT5LIgL44seSbTZCR88SHB6NGe83rfs9aqFzvHDK9DgkDIyN4VtDnbYdmNHvw__&Key-Pair-Id=APKAIE5G5CRDK6RD3PGA)
![N-glycosylation inhibitors preferentially reduce growth of mutant CALR-transformed cells and reduce MPL surface expression. (A) Overview of N-glycosylation biosynthesis and endoplasmic reticulum (ER)-resident trimming proteins (labeled in black) differentially required for growth of CALRΔ52-transformed cells (compared with EV or CALRΔ52 cells grown in the presence of IL3) as determined by scoring as a “hit” in either of our 2 CRISPR screens (negative log2 fold change > 1). After biosynthesis of the N-glycan tree (dolichol-P-P-GlcNAc2Man9Glc3), it is transferred to a newly synthesized glycoprotein such as MPL (red line) by the OST complex. OST complex members that scored in our screens include OST4, OSTC, STT3A, RPN1, RPN2, and DAD1. CALR then binds and folds the glycoprotein. The graph also depicts the mode of action of N-glycosylation inhibitors (labeled in red) used in B-I. (B) Growth curves of BA/F3-MPL-EV or -CALRΔ52–expressing cells in the presence or absence of IL3, respectively. Cells were treated with DMSO, 10 μM or 50 μM 2-deoxyglucose (2-DG). Data were normalized to DMSO control for each cell line. (C) Normalized geometric mean MPL (CD110) cell surface expression of BA/F3-MPL-EV, -CALRΔ52, or –Jak2V617F–expressing cells following 2-DG treatment for 24 hours. EV control cells were grown in the presence of IL3, CALRΔ52, and Jak2V617F cells in the absence of IL3. (D-I) Growth curves and MPL surface expression as described in panels B-C. DMSO, 1 μM tunicamycin (D-E), DMSO, 1 μM or 10 μM ML414, 5-[(Dimethylamino)sulfonyl]-N-(5-methyl-2-thiazolyl)-2-(1-pyrrolidinyl)-benzamide (NGI1) (F-G), and DMSO, 20, or 50 μM castanospermine (H-I). Statistical significance in panels B, D, F, and H was calculated using 2-sided Student t tests at the 72-hour time point. Growth curves were performed in duplicate 2 to 4 times. Statistical significance in panels C, E, G, and I was determined using 1-way analysis of variance. MPL measurements were performed in duplicate 2 to 3 times. The most important statistical analyses are highlighted. Mean plus or minus standard error of the mean. *P < .05; **P < .01; ***P < .001; ****P < .0001. Fruc, fructose; Glc, glucose; Man, Mannose; mRNA, messenger RNA; P, phosphate.](https://ash.silverchair-cdn.com/ash/content_public/journal/blood/140/11/10.1182_blood.2022015629/9/m_bloodbld2022015629f4b.png?Expires=1769371402&Signature=OMBPNcMZvEwYQU6mWKpZhXyep8W1Glg70Un9-CEF7Ybw94zlHXxnn5T564CO4if9dm1HxYTMjWMkchGDDLf8Vpo6pfzUzXiDHVuhA6Ma~kIT4sJnEdKBf6x5LNkaiaVtiNAswfVRMfB5ga9bW8tg4y4FRQ80qdEF-t5f8EqfxIMlQGlUUB6ZkDmWx1RqCJyUdcWS~S9ewD5CVVX1veoGxyfGRb87t713sYqx1Qs9GmOmxMA539ZaUwuW2riPa80tzlGv3y66pSuilxwo3raGavqXqkdFrM1Vsb45pGxp6KaxzNzdbxYqsiskKXWXo-OwtjZSsKCFi2zstPX1Pi0ZmQ__&Key-Pair-Id=APKAIE5G5CRDK6RD3PGA)
N-glycosylation inhibitors preferentially reduce growth of mutant CALR-transformed cells and reduce MPL surface expression. (A) Overview of N-glycosylation biosynthesis and endoplasmic reticulum (ER)-resident trimming proteins (labeled in black) differentially required for growth of CALRΔ52-transformed cells (compared with EV or CALRΔ52 cells grown in the presence of IL3) as determined by scoring as a “hit” in either of our 2 CRISPR screens (negative log2 fold change > 1). After biosynthesis of the N-glycan tree (dolichol-P-P-GlcNAc2Man9Glc3), it is transferred to a newly synthesized glycoprotein such as MPL (red line) by the OST complex. OST complex members that scored in our screens include OST4, OSTC, STT3A, RPN1, RPN2, and DAD1. CALR then binds and folds the glycoprotein. The graph also depicts the mode of action of N-glycosylation inhibitors (labeled in red) used in B-I. (B) Growth curves of BA/F3-MPL-EV or -CALRΔ52–expressing cells in the presence or absence of IL3, respectively. Cells were treated with DMSO, 10 μM or 50 μM 2-deoxyglucose (2-DG). Data were normalized to DMSO control for each cell line. (C) Normalized geometric mean MPL (CD110) cell surface expression of BA/F3-MPL-EV, -CALRΔ52, or –Jak2V617F–expressing cells following 2-DG treatment for 24 hours. EV control cells were grown in the presence of IL3, CALRΔ52, and Jak2V617F cells in the absence of IL3. (D-I) Growth curves and MPL surface expression as described in panels B-C. DMSO, 1 μM tunicamycin (D-E), DMSO, 1 μM or 10 μM ML414, 5-[(Dimethylamino)sulfonyl]-N-(5-methyl-2-thiazolyl)-2-(1-pyrrolidinyl)-benzamide (NGI1) (F-G), and DMSO, 20, or 50 μM castanospermine (H-I). Statistical significance in panels B, D, F, and H was calculated using 2-sided Student t tests at the 72-hour time point. Growth curves were performed in duplicate 2 to 4 times. Statistical significance in panels C, E, G, and I was determined using 1-way analysis of variance. MPL measurements were performed in duplicate 2 to 3 times. The most important statistical analyses are highlighted. Mean plus or minus standard error of the mean. *P < .05; **P < .01; ***P < .001; ****P < .0001. Fruc, fructose; Glc, glucose; Man, Mannose; mRNA, messenger RNA; P, phosphate.
N-glycosylation inhibitors preferentially reduce growth of mutant CALR-transformed cells and reduce MPL surface expression. (A) Overview of N-glycosylation biosynthesis and endoplasmic reticulum (ER)-resident trimming proteins (labeled in black) differentially required for growth of CALRΔ52-transformed cells (compared with EV or CALRΔ52 cells grown in the presence of IL3) as determined by scoring as a “hit” in either of our 2 CRISPR screens (negative log2 fold change > 1). After biosynthesis of the N-glycan tree (dolichol-P-P-GlcNAc2Man9Glc3), it is transferred to a newly synthesized glycoprotein such as MPL (red line) by the OST complex. OST complex members that scored in our screens include OST4, OSTC, STT3A, RPN1, RPN2, and DAD1. CALR then binds and folds the glycoprotein. The graph also depicts the mode of action of N-glycosylation inhibitors (labeled in red) used in B-I. (B) Growth curves of BA/F3-MPL-EV or -CALRΔ52–expressing cells in the presence or absence of IL3, respectively. Cells were treated with DMSO, 10 μM or 50 μM 2-deoxyglucose (2-DG). Data were normalized to DMSO control for each cell line. (C) Normalized geometric mean MPL (CD110) cell surface expression of BA/F3-MPL-EV, -CALRΔ52, or –Jak2V617F–expressing cells following 2-DG treatment for 24 hours. EV control cells were grown in the presence of IL3, CALRΔ52, and Jak2V617F cells in the absence of IL3. (D-I) Growth curves and MPL surface expression as described in panels B-C. DMSO, 1 μM tunicamycin (D-E), DMSO, 1 μM or 10 μM ML414, 5-[(Dimethylamino)sulfonyl]-N-(5-methyl-2-thiazolyl)-2-(1-pyrrolidinyl)-benzamide (NGI1) (F-G), and DMSO, 20, or 50 μM castanospermine (H-I). Statistical significance in panels B, D, F, and H was calculated using 2-sided Student t tests at the 72-hour time point. Growth curves were performed in duplicate 2 to 4 times. Statistical significance in panels C, E, G, and I was determined using 1-way analysis of variance. MPL measurements were performed in duplicate 2 to 3 times. The most important statistical analyses are highlighted. Mean plus or minus standard error of the mean. *P < .05; **P < .01; ***P < .001; ****P < .0001. Fruc, fructose; Glc, glucose; Man, Mannose; mRNA, messenger RNA; P, phosphate.
2-Deoxyglucose normalizes platelet counts in CalrΔ52/+ mice and upregulates apoptosis in CalrΔ52/+ megakaryocyte erythrocyte progenitors
We next studied the sensitivity of Calr-mutant cells to N-glycosylation inhibition by 2-DG in vivo. CalrΔ52 knockin mice carrying the human CALRΔ52 C-terminus8 were crossed with Mx-Cre mice to generate polyinosinic:polycytidylic acid (pI:pC) inducible knockin mice (Mx-Cre CalrΔ52/+). Two weeks after pI:pC injection, mice were injected intraperitoneally daily with either 750 mg/kg 2-DG or vehicle control for 18 days (Figure 5A). As a pharmacodynamic marker of on-target inhibition of glycosylation, we determined the surface expression of CD59a on erythrocytes. The rationale for this is that patients with congenital disorders of glycosylation due to mutations in DPM complex genes have reduced CD59 expression.23,24 We confirmed that CD59a was significantly reduced in 2-DG–treated CalrΔ52/+ mice (supplemental Figure 6A). Additionally, to confirm on-target inhibition of N-glycosylation by 2-DG, we performed tissue N-glycan analyses on spleens from vehicle and 2-DG–treated Mx-Cre CalrΔ52/+ mice. N-glycans were enzymatically cleaved from paraffin-embedded spleens followed by glycan mass spectrometry. The top 10 most abundant N-glycans, as well as immature high-mannose N-glycans, were reduced by ∼20% in 2-DG compared with vehicle-treated mice (Figure 5B-C; supplemental Figure 6B; supplemental Tables 5 and 6), indicating that 2-DG treatment reduces N-glycan biosynthesis. Complete blood counts showed significantly increased platelet counts in Mx-Cre CalrΔ52/+ mice compared with Mx-Cre Calr+/+ controls, a hallmark of CALR-mutant MPNs. Importantly, platelet counts were significantly reduced only in CalrΔ52/+ mice upon treatment with 2-DG (Figure 5D). White blood cell count (WBC) and hematocrit values were not significantly altered (supplemental Figure 6C-D). In line with these data, BM analyses showed a reduced frequency of MEPs in 2-DG- vs vehicle-treated Mx-Cre CalrΔ52/+ mice (Figure 5E), with no significant reduction in 2-DG–treated Calr+/+ mice. We next performed flow cytometry analysis on megakaryocyte progenitors (MkPs) to assess whether 2-DG decreases MPL surface expression as a result of N-glycosylation inhibition. 2-DG treatment significantly reduced MPL on Calr mutant but not on WT MkPs (Figure 5F). We next performed RNA-seq on MEPs flourescence-activated cell sorted from vehicle and 2-DG-treated mice followed by GSEA. We found an enrichment of the Hallmark apoptosis pathway and upregulation of proapoptotic genes in MEPs isolated from Mx-Cre CalrΔ52/+ mice treated with 2-DG compared with vehicle (Figure 5G-H; supplemental Figure 6E). This was not the case in control Mx-Cre Calr+/+ mice, suggesting preferential targeting of CalrΔ52/+ over WT cells following 2-DG treatment in vivo. Of note, primary Mx-Cre Jak2V617F/+ mice treated with 2-DG had significantly decreased platelet counts (Figure 5I), and MPL cell surface expression was also reduced on Mx-Cre Jak2V617F/+ MkPs (Figure 5J), showing that the activity of 2-DG is not restricted to Calr-mutant MPNs.
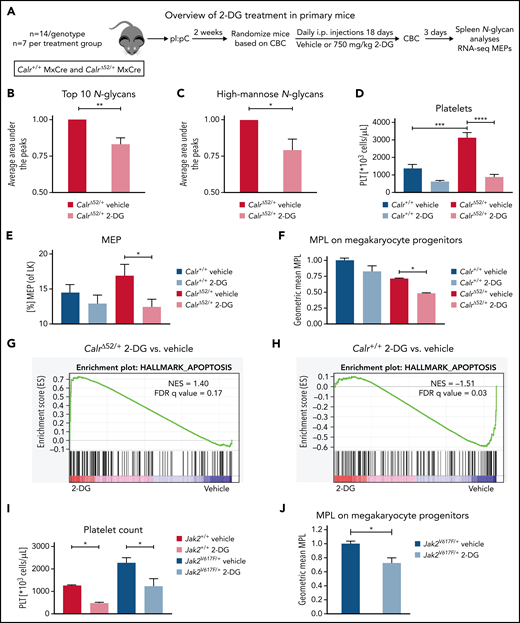
2-Deoxyglucose normalizes key MPN features in mice. (A) Schematic overview of 2-DG treatment in primary mice. (B-C) Spleen N-glycan analyses in vehicle- or 2-DG–treated CalrΔ52/+ mice upon 18 days of treatment, showing the top 10 most abundant N-glycans (B) and the immature high-mannose N-glycans (C). Statistical analysis performed using 1-way analysis of variance (ANOVA). Mean plus standard error of the mean (SEM). *P < .05; **P < .01. (D) Peripheral blood platelet count of vehicle- or 2-DG–treated Calr+/+ and CalrΔ52/+ mice 18 days after treatment start. Statistical analysis performed using 1-way ANOVA. Mean plus SEM. ***P < .001; ****P < .0001. (E) Megakaryocyte-erythroid progenitor (MEP) frequency. N = 7 per genotype and condition. Statistical analysis performed using 1-way ANOVA. Mean plus SEM. *P < .05. (F) MPL surface expression (normalized geometric mean) on megakaryocyte progenitors of vehicle- or 2-DG–treated Calr+/+ and CalrΔ52/+ mice. N = 3. Statistical analysis performed using 1-way ANOVA. Mean plus SEM. *P < .05. (G-H) GSEA on RNA-seq data of MEPs isolated from Calr+/+ MxCre and CalrΔ52/+ MxCre mice treated with vehicle or 2-DG. (G) GSEA showing enrichment of the Hallmark apoptosis pathway in CalrΔ52/+ MxCre MEPs from mice treated with 2-DG as compared with vehicle, whereas the opposite was found for Calr+/+ MxCre mice treated with 2-DG as compared with vehicle, shown in (H). (I) Platelet (PLT) values of Jak2V617F/+ MxCre and Jak2+/+ MxCre mice treated with 2-DG for 14 days. N = 3. Statistical analysis performed using 1-way ANOVA. *P < .05. (J) MPL surface expression (normalized geometric mean) on megakaryocyte progenitors of vehicle- or 2-DG–treated Jak2V617F/+ MxCre and Jak2+/+ MxCre mice. N = 3. Mean plus SEM. Statistical analysis performed unpaired Student t test. *P < .05. CBC, complete blood cell count; FDR, false discovery rate; NES, normalized enrichment score.
2-Deoxyglucose normalizes key MPN features in mice. (A) Schematic overview of 2-DG treatment in primary mice. (B-C) Spleen N-glycan analyses in vehicle- or 2-DG–treated CalrΔ52/+ mice upon 18 days of treatment, showing the top 10 most abundant N-glycans (B) and the immature high-mannose N-glycans (C). Statistical analysis performed using 1-way analysis of variance (ANOVA). Mean plus standard error of the mean (SEM). *P < .05; **P < .01. (D) Peripheral blood platelet count of vehicle- or 2-DG–treated Calr+/+ and CalrΔ52/+ mice 18 days after treatment start. Statistical analysis performed using 1-way ANOVA. Mean plus SEM. ***P < .001; ****P < .0001. (E) Megakaryocyte-erythroid progenitor (MEP) frequency. N = 7 per genotype and condition. Statistical analysis performed using 1-way ANOVA. Mean plus SEM. *P < .05. (F) MPL surface expression (normalized geometric mean) on megakaryocyte progenitors of vehicle- or 2-DG–treated Calr+/+ and CalrΔ52/+ mice. N = 3. Statistical analysis performed using 1-way ANOVA. Mean plus SEM. *P < .05. (G-H) GSEA on RNA-seq data of MEPs isolated from Calr+/+ MxCre and CalrΔ52/+ MxCre mice treated with vehicle or 2-DG. (G) GSEA showing enrichment of the Hallmark apoptosis pathway in CalrΔ52/+ MxCre MEPs from mice treated with 2-DG as compared with vehicle, whereas the opposite was found for Calr+/+ MxCre mice treated with 2-DG as compared with vehicle, shown in (H). (I) Platelet (PLT) values of Jak2V617F/+ MxCre and Jak2+/+ MxCre mice treated with 2-DG for 14 days. N = 3. Statistical analysis performed using 1-way ANOVA. *P < .05. (J) MPL surface expression (normalized geometric mean) on megakaryocyte progenitors of vehicle- or 2-DG–treated Jak2V617F/+ MxCre and Jak2+/+ MxCre mice. N = 3. Mean plus SEM. Statistical analysis performed unpaired Student t test. *P < .05. CBC, complete blood cell count; FDR, false discovery rate; NES, normalized enrichment score.
2-Deoxyglucose treatment preferentially decreases CalrΔ52/+ long-term hematopoietic stem cells and platelets over Calr WT cells in vivo
Next, we aimed to determine whether the preferential effects of 2-DG on CalrΔ52/+ cells holds true in a chimeric transplant mouse model. To do so, we crossed CD45.2 Mx-Cre CalrΔ52/+ mice with UBC-GFP mice. UBC-GFP mice express GFP in all cells including platelets, allowing assessment of platelet chimerism. Unfractionated Mx-Cre CalrΔ52/+ UBC-GFP BM was mixed in a 1:1 ratio with CD45.1 competitor cells and transplanted into lethally irradiated CD45.1 recipients25 (Figure 6A). Four weeks posttransplantation, recombination of Calr was induced with pI:pC injections. Daily intraperitoneal injections with vehicle or 750 mg/kg 2-DG were started 2 weeks later. Platelet counts were reduced after 14 days of treatment (Figure 6B), with gradually reducing WBCs and platelet chimerism, reaching statistical significance after 6 weeks of treatment (Figure 6C-D). Hematocrit values were reduced in 2-DG- vs vehicle-treated mice after 14 days of treatment but did not further decrease over time (supplemental Figure 7A), whereas body weights remained stable (supplemental Figure 7B). BM analyses showed reduced GFP+Calr-mutant chimerism in long-term hematopoietic stem cells (Figure 6E) but not in other progenitor compartments (supplemental Figure 7C). In line with these data and with the strong megakaryocyte-lineage bias of Calr-mutant stem cells,26 myeloid and erythroid chimerism in the peripheral blood did not change over time (supplemental Figure 7D-E). Together, our data indicate that inhibition of N-glycosylation preferentially targets CalrΔ52/+ over WT cells, including the disease-initiating long-term hematopoietic stem cell population.
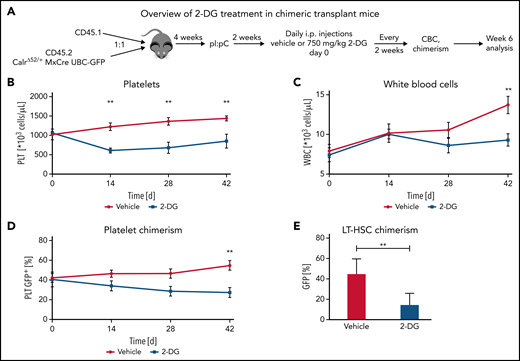
2-Deoxyglucose preferentially targets Calr mutant cells in a preclinical MPN mouse model. (A) Schematic overview of chimeric transplantation experiment. CD45.1+ competitor BM cells were mixed in a 1:1 ratio with CD45.2+CalrΔ52/+ MxCre UBC-GFP BM and transplanted into lethally irradiated CD45.1+ recipient animals. N = 5 to 7 mice per group. (B-D) Peripheral blood values of engrafted and pI:pC-induced vehicle or 2-DG–treated chimeric mice as described in (A). (B) Platelet (PLT) count over time. (C) WBC over time. (D) GFP chimerism in peripheral blood platelets over time. (E) CalrΔ52/+ mutant chimerism (percentage of GFP+ cells) in long-term hematopoietic stem and progenitor cells in the bone marrow following 6 weeks of treatment. Statistical significance was determined using Skidak’s multiple comparisons tests (B-D) or 2-sided Student t tests (E). Mean plus or minus standard error of the mean. **P < .01. CBC, complete blood cell count; LT-HSC, long-term hematopoietic stem cell.
2-Deoxyglucose preferentially targets Calr mutant cells in a preclinical MPN mouse model. (A) Schematic overview of chimeric transplantation experiment. CD45.1+ competitor BM cells were mixed in a 1:1 ratio with CD45.2+CalrΔ52/+ MxCre UBC-GFP BM and transplanted into lethally irradiated CD45.1+ recipient animals. N = 5 to 7 mice per group. (B-D) Peripheral blood values of engrafted and pI:pC-induced vehicle or 2-DG–treated chimeric mice as described in (A). (B) Platelet (PLT) count over time. (C) WBC over time. (D) GFP chimerism in peripheral blood platelets over time. (E) CalrΔ52/+ mutant chimerism (percentage of GFP+ cells) in long-term hematopoietic stem and progenitor cells in the bone marrow following 6 weeks of treatment. Statistical significance was determined using Skidak’s multiple comparisons tests (B-D) or 2-sided Student t tests (E). Mean plus or minus standard error of the mean. **P < .01. CBC, complete blood cell count; LT-HSC, long-term hematopoietic stem cell.
N-glycosylation–related pathways are upregulated in the transcriptome of primary MPNs platelets as compared with healthy control platelets
To determine the importance of N-glycosylation in human MPNs, we first interrogated bulk RNA-seq data from platelets from CALR-mutated patients and healthy controls (HC). GSEA showed that many metabolism-related pathways, including the “KEGG fructose and mannose metabolism” and “Reactome N-glycan trimming in the ER and calnexin/calreticulin cycle” pathways, are significantly enriched in the transcriptome of platelets from CALR-mutated patients (n = 13) as compared with HC (n = 21) platelets (Figure 7A-C; supplemental Figure 8A). In line with the genetic dependencies identified in our CRISPR screens, the “Reactome UPR” and “Reactome IRE1α activates chaperones pathways” were also significantly enriched in platelets from CALR-mutated patients vs HC platelets (supplemental Figure 8B-C). We found a similar enrichment of these pathways in platelets from JAK2-mutant essential thrombocythemia and myelofibrosis patients (n = 41 total) as compared with HC platelets (n = 21) (supplemental Figure 8D-G). To explore potential therapeutic relevance in humans, we subjected BM from patients with a CALR mutation and healthy controls (supplemental Table 7) to colony assays of megakaryocyte progenitors. 2-DG treatment significantly reduced megakaryocyte colony formation of patient-derived BM cells, whereas BM cells from healthy controls were not affected by 2-DG (Figure 7D). We confirmed a preferential reduction in colony formation of patient-derived BM using NGI1, a more specific inhibitor of N-glycosylation (Figure 7E). In aggregate, these findings highlight the relevance of our findings to human MPNs.
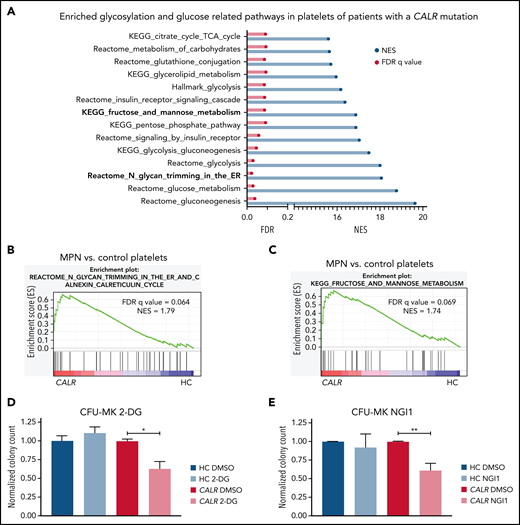
N-glycosylation–related pathways are enriched in platelets of CALR-mutant human MPN as compared with human healthy control platelets. (A) Significantly enriched glucose and glycosylation-related pathways in platelets of CALR-mutant essential thrombocythemia and myelofibrosis patients (n = 13 samples) vs healthy controls (n = 21 samples) as determined by GSEA on platelet RNA-seq data. (B) GSEA of the Reactome N-glycan trimming in the ER and calnexin calreticulin cycle pathway in platelets of CALR-mutant vs control platelets. (C) GSEA of the KEGG fructose and mannose metabolism pathway in platelets of CALR-mutant vs control platelets. (D-E) CFU-MK of HC BM and BM from patients with a CALR mutation. N = 3 in duplicate. Mean plus or minus standard error of the mean. Statistical analysis performed using Student t tests. *P < .05; **P < .01. (D) Normalized colony count of BM grown in the presence of either DMSO or 2-DG (20 µM). (E) Normalized colony count of BM grown in the presence of either DMSO or NGI1 (1 µM). Mean plus standard error of the mean. CFU-MK, megakaryocyte colony-forming unit; FDR, false discovery rate; NES, normalized enrichment score.
N-glycosylation–related pathways are enriched in platelets of CALR-mutant human MPN as compared with human healthy control platelets. (A) Significantly enriched glucose and glycosylation-related pathways in platelets of CALR-mutant essential thrombocythemia and myelofibrosis patients (n = 13 samples) vs healthy controls (n = 21 samples) as determined by GSEA on platelet RNA-seq data. (B) GSEA of the Reactome N-glycan trimming in the ER and calnexin calreticulin cycle pathway in platelets of CALR-mutant vs control platelets. (C) GSEA of the KEGG fructose and mannose metabolism pathway in platelets of CALR-mutant vs control platelets. (D-E) CFU-MK of HC BM and BM from patients with a CALR mutation. N = 3 in duplicate. Mean plus or minus standard error of the mean. Statistical analysis performed using Student t tests. *P < .05; **P < .01. (D) Normalized colony count of BM grown in the presence of either DMSO or 2-DG (20 µM). (E) Normalized colony count of BM grown in the presence of either DMSO or NGI1 (1 µM). Mean plus standard error of the mean. CFU-MK, megakaryocyte colony-forming unit; FDR, false discovery rate; NES, normalized enrichment score.
Discussion
The identification of CALR as a key gene involved in the pathogenesis of MPNs was unexpected but transformative in terms of advancing insights into MPNs biology and in making a definitive diagnosis of MPNs in patients.1,2 In 2016, we and others elucidated the basic mechanism by which CALR mutations cause MPNs, demonstrating that a pathogenic binding interaction between mutant CALR and MPL is central to oncogenic transformation.5,9-11 Despite these mechanistic insights, there are currently no clonally selective drug therapies for CALR-mutant MPNs. This represents a major unmet clinical need, particularly in an era where we can detect MPNs in the preclinical phase27 but currently lack any effective strategies to intervene and preferentially target CALR-mutant clones.
Exploiting advances in genome-wide libraries for CRISPR screening,28 we applied whole-genome CRISPR knockout screening to study CALR-mutant MPNs. We first performed a whole-genome CRISPR knockout depletion screen in mutant CALR-MPL–transformed hematopoietic cells and followed this with a secondary pooled validation CRISPR screen. Strikingly, the results from our CRISPR screens converged on a differential dependency for mutant CALR transformed cells on protein N-glycosylation–related genes. Concordant with these findings, WT CALR is an ER-resident chaperone protein that interacts with glycoproteins by binding to Glc1Man9GlcNAc2 oligosaccharides. Importantly, N-glycosylation has been shown to be essential for MPL cell surface expression.7 Moreover, we and others have previously reported that the interaction of mutant CALR with MPL is dependent on the lectin residues of mutant CALR and the N-glycosylation residues in the extracellular domain of MPL.6,10,17,18 Pathways related to protein secretion were also differentially required for the growth of mutant CALR-transformed cells. Aligning with these results, it has been shown that mutant CALR entry into the ER secretory pathway is required for binding to MPL and that subsequently, the mutant CALR-MPL complex is shuttled through the Golgi apparatus to the cell membrane.16,17 Finally, we found a differential requirement for UPR-related genes in mutant CALR-transformed cells, which is consistent with earlier studies showing transcriptional upregulation of UPR pathways in primary CALR-mutant megakaryocyte-lineage cells.29,30 In aggregate, our findings are compatible with the known biological underpinnings of CALR-mutant MPNs and uncover several distinct genetic vulnerabilities with therapeutic potential.
With these results from our CRISPR screens in hand, we next performed a focused pharmacological screen targeting the aforementioned pathways, among others. In line with the genetic dependency data, inhibitors of N-glycosylation consistently inhibited the growth of mutant CALR-transformed cells in vitro. Therefore, we focused on testing N-glycosylation inhibition in vivo, using a previously published mutant CALRΔ52 knockin mouse model.8 With the goal of translating our findings to the clinic, we treated CALRΔ52 mice with 2-DG, an N-glycosylation inhibitor that has been used to treat patients with advanced solid tumors in a phase 1 study.22 2-DG was well tolerated by the mice in our experiments and reduced immature, newly formed N-glycan forms and the top 10 most abundant N-glycan forms. In studies with either primary CalrΔ52 mice or chimeric CalrΔ52 transplant mice, we found that CalrΔ52/+ hematopoietic cells were preferentially sensitive to 2-DG treatment as compared with WT cells. In accordance with this, we found that N-glycosylation–related pathways were significantly upregulated in the transcriptome of primary CALR-mutant human platelets as compared with platelets obtained from healthy controls. Moreover, inhibition of N-glycosylation reduced megakaryocyte colony formation in CALR-mutant BM but not that of healthy controls.
To determine the specificity of our findings to mutant CALR-driven MPNs, we treated Jak2V617F-transformed BA/F3-MPL cells and primary Jak2V617F mice and found they were similarly sensitive to N-glycosylation inhibition. This finding, in combination with our data indicating that MPL surface expression is reduced upon Dpm2 knockout or pharmacological inhibition of N-glycosylation, indicates a likely underlying mechanism of impaired MPL trafficking to the cell surface as a consequence of decreased N-glycosylation. Consistent with this, acute myeloid leukemias driven by mutations in cell-surface receptors such as FLT3 and c-KIT have been shown to be sensitive to treatment with 2-DG through N-glycosylation inhibition.20 As noted, we used 2-DG for our in vivo studies in CalrΔ52 mice because it has been demonstrated that 2-DG can safely be administered to humans, although 2-DG–related adverse effects were reported in this clinical trial, including abnormalities in blood glucose levels.22 Furthermore, the effects of 2-DG are pleiotropic, including inhibition of glycolysis.31 In our in vitro studies, we tested additional N-glycosylation inhibitors with a narrower and more clearly defined mechanism of action (eg, NGI1 and castanospermine) and found these also had activity. With recent advances in targeting glycans therapeutically,32 we anticipate the development of more specific N-glycosylation inhibitors targeting distinct enzymes in the N-glycan biosynthesis pathway for clinical use. Our studies provide a “proof of concept” that the N-glycan biosynthesis pathway represents a genetic and therapeutic vulnerability in CALR-mutant MPNs.
In summary, using unbiased genetic and focused pharmacological screens, we identified the N-glycosylation pathway as essential for mutant CALR-driven oncogenesis. Using a preclinical MPNs model, we found that in vivo inhibition of N-glycosylation normalizes key features of MPNs and preferentially targets CALRΔ52 cells over WT cells. These findings have therapeutic implications for CALR-mutant MPNs, and potentially MPNs more broadly through inhibiting N-glycosylation, to advance the development of clonally selective therapies and ultimately alter the natural history of these chronic blood cancers.
Acknowledgments
The authors thank Tony Green (University of Cambridge, UK) for generously sharing mutant Calr knockin mice. They thank Anand Mehta, Richard Drake, and Peggi Angel (Medical University of South Carolina) for tissue N-glycan analyses and Christopher Ashwood and Richard Cummings (Beth Israel Deaconess Medical Center [BIDMC]/Harvard Medical School) for MPL N-glycan analyses. The Sysmex veterinary hematology analyzer instrument is a generous loan from Sysmex. They thank Martha Sola-Visner and her laboratory members Emily Nolton and Patricia Davenport (Boston Children’s Hospital) for kindly sharing Sysmex equipment for complete blood counts. The authors appreciate the technical support by the BCH Flowlab, namely by Mahnaz Paktinat and Ronald Mathieu, as well as by the Brigham and Women's Hospital (BWH), Center for Comparative Medicine (CCM) veterinary staff, and by Zachary Herbert and Maura Berkeley from the Dana Farber Cancer Institute (DFCI) Molecular Biology Core Facilities for RNA-sequencing services. The authors further value the technical and intellectual input given by Andy Lane, Peter van Galen, Mikolaj Slabicki, Mark Goldberg, and Carolyn Bertozzi. Further, the authors are grateful for technical support from the staff of the Institute of Chemistry and Cell Biology (ICCB)-Longwood screening facility.
The authors acknowledge the following funding sources: A.M. acknowledges funding from the National Heart, Lung, and Blood Institute (NHLBI), National Institutes of Health (NIH) (R01HL131835), and the Gabrielle’s Angel Foundation for Cancer Research. A.M. is a Scholar of the Leukemia & Lymphoma Society. J.S.J. acknowledges funding from the German Research Foundation (DFG, JU 3104/2-1). J.S.J. is a Special Fellow of The Leukemia & Lymphoma Society (3415-22). A.E.M. receives funding from the US Department of Defense (Horizon Award W81XWH-20-1-0904). J.G. and A.K. acknowledge funding from the NIH (National Human Genome Research Institute [1K08HG010061-01A1], National Center for Advancing Translational Sciences [3UL1TR001085-04S1]). M.C. acknowledges funding by the Novartis Foundation (INC424XT1349549) and the Associazione Italiana Ricerca Contro Cancro (AIRC) (23976). J.W.D. acknowledges funding by the NIH (T32GM132055).
Authorship
Contribution: J.S.J. and A.E.M. designed research, performed research, analyzed data, and wrote the paper; M.C. and A.G.-M. designed research, performed research, and analyzed data; M.J.J.-S. analyzed data and contributed vital analytical tools; A.K., J.W.D., H.L., and S.E. performed research and analyzed data; R.H., P.L., and E.R. performed research; J.G.D. designed research and contributed vital new reagents and analytical tools; J.G., A.K., and F.A.-S. analyzed data and contributed vital analytical tools; and A.M. designed research, supervised research, analyzed data, and wrote the paper.
Conflict-of-interest disclosure: A.M. receives research funding from Relay Therapeutics; has consulted for Janssen, PharmaEssentia, Actuate Therapeutics, Constellation, Aclaris Therapeutics, and Cellarity; and has received research funding from Janssen and Actuate Therapeutics. M.C. received salary support from Novartis. The remaining authors declare no competing financial interests.
Correspondence: Ann Mullally, Harvard Institutes of Medicine Building, Room 738, 77 Ave Louis Pasteur, Boston, MA 02115; e-mail: ann_mullally@dfci.harvard.edu.
Platelet RNA sequencing data from this work have been deposited to the National Institutes of Health (NIH) genomic data repository dbGAP under public accession number PHS-0021-21. v1.P1. The whole-genome CRISPR screening data, pooled CRISPR screening data, and MEP RNA sequencing data have been deposited to the NIH genomic data repository under accession numbers GSE203456, GSE203455, and GSE203457, respectively.
The online version of this article contains a data supplement.
There is a Blood Commentary on this article in this issue.
The publication costs of this article were defrayed in part by page charge payment. Therefore, and solely to indicate this fact, this article is hereby marked “advertisement” in accordance with 18 USC section 1734.

This feature is available to Subscribers Only
Sign In or Create an Account Close Modal