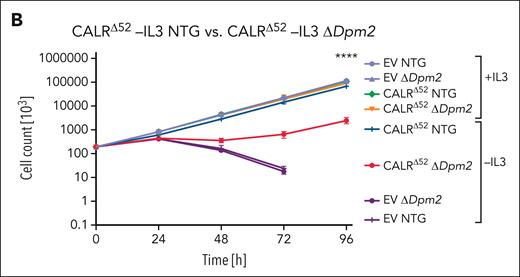
In-depth validation of the N-glycan biosynthesis pathway as an essential pathway for growth of mutant CALR-expressing hematopoietic cells. (B) Growth curves of independent biological replicates and the 2 different sgRNAs were combined in the analysis. Cells were assayed either in the presence or absence of IL3 (+IL3/−IL3) for up to 96 hours. The assay was performed n = 3 for all 4 biological replicates of both genotypes. Statistical significance was determined by 2-way analysis of variance (ANOVA). Mean plus and minus standard error of the mean (SEM). ∗∗∗∗P < .00001. The most important statistical analysis is highlighted.

In-depth validation of the N-glycan biosynthesis pathway as an essential pathway for growth of mutant CALR-expressing hematopoietic cells. (B) Growth curves of independent biological replicates and the 2 different sgRNAs were combined in the analysis. Cells were assayed either in the presence or absence of IL3 (+IL3/−IL3) for up to 96 hours. The assay was performed n = 3 for all 4 biological replicates of both genotypes. Statistical significance was determined by 2-way analysis of variance (ANOVA). Mean plus and minus standard error of the mean (SEM). ∗∗∗∗P < .00001. The most important statistical analysis is highlighted.

This feature is available to Subscribers Only
Sign In or Create an Account Close Modal