

Key Points
Continuous exposure to a CD19xCD3 bispecific molecule induces T-cell exhaustion.
Treatment-free intervals transcriptionally reprogram and functionally reinvigorate T cells.

Abstract
T-cell–recruiting bispecific molecule therapy has yielded promising results in patients with hematologic malignancies; however, resistance and subsequent relapse remains a major challenge. T-cell exhaustion induced by persistent antigen stimulation or tonic receptor signaling has been reported to compromise outcomes of T-cell–based immunotherapies. The impact of continuous exposure to bispecifics on T-cell function, however, remains poorly understood. In relapsed/refractory B-cell precursor acute lymphoblastic leukemia patients, 28-day continuous infusion with the CD19xCD3 bispecific molecule blinatumomab led to declining T-cell function. In an in vitro model system, mimicking 28-day continuous infusion with the half-life–extended CD19xCD3 bispecific AMG 562, we identified hallmark features of exhaustion arising over time. Continuous AMG 562 exposure induced progressive loss of T-cell function (day 7 vs day 28 mean specific lysis: 88.4% vs 8.6%; n = 6; P = .0003). Treatment-free intervals (TFIs), achieved by AMG 562 withdrawal, were identified as a powerful strategy for counteracting exhaustion. TFIs induced strong functional reinvigoration of T cells (continuous vs TFI-specific lysis on day 14: 34.9% vs 93.4%; n = 6; P < .0001) and transcriptional reprogramming. Furthermore, use of a TFI led to improved T-cell expansion and tumor control in vivo. Our data demonstrate the relevance of T-cell exhaustion in bispecific antibody therapy and highlight that T cells can be functionally and transcriptionally rejuvenated with TFIs. In view of the growing number of bispecific molecules being evaluated in clinical trials, our findings emphasize the need to consider and evaluate TFIs in application schedules to improve clinical outcomes.
Introduction
T-cell–recruiting bispecific antibodies comprise a novel immunotherapeutic platform for the treatment of hematological malignancies and are currently being investigated in clinical trials.1 The CD20xCD3 bispecifics glofitamab2,3 and mosunetuzumab4 have shown encouraging results in phase-I trials in patients with indolent or aggressive lymphomas. In patients with acute myeloid leukemia (AML), the CD123xCD3 molecule flotetuzumab demonstrated promising response rates.5 To date, the only FDA-approved bispecific molecule is the CD19xCD3 molecule blinatumomab for treatment of relapsed/refractory (r/r) and minimal residual disease-positive (MRD+) B-cell precursor acute lymphoblastic leukemia (BCP-ALL).6-9
Bispecific antibodies are administered using varying application schedules (continuous to weekly infusions) to achieve serum levels that support efficient T-cell recruitment. Owing to their short circulation half-lives, both flotetuzumab and blinatumomab are administered to eligible patients by 28-day continuous intravenous infusion (c.i.v.) during the first cycle.5,9 Rates of response to blinatumomab in clinical trials were significantly higher compared with standard-of-care chemotherapy, with 43% in r/r and 81% in MRD+ patients.9,10 These results are encouraging; however, they also highlight that a considerable portion of patients remain refractory to therapy. To improve the response to bispecific antibodies, a better understanding of resistance mechanisms is urgently needed.
First clinical evidence that highly functional T cells are required for successful bispecific molecule therapy was provided by a phase-II follow-up analysis of r/r BCP-ALL patients treated with blinatumomab. Response to blinatumomab positively correlated with CD3+ T-cell expansion,11 whereas the frequency of regulatory T cells prior to therapy negatively correlated to response.12 Furthermore, enrichment of exhausted T cells was reported in r/r BCP-ALL patients unresponsive to blinatumomab.13
T-cell exhaustion has been described in chronic viral infection in mice,14,15 humans,16,17 and, more recently, in cancer.18-20 Upon continuous antigen exposure, T cells coexpress inhibitory checkpoint molecules including programmed cell death protein 1 (PD-1), T-cell immunoglobulin and mucin domain 3 (Tim-3), and lymphocyte activation gene 3 (LAG-3). Concomitantly, T cells enter a state of hypo-responsiveness, characterized by gradual loss of functions such as cytokine secretion, proliferation, and cytotoxicity.16,21-23 Translating this concept into the clinical setting of bispecific therapies, we hypothesized that T-cell exhaustion occurs during continuous exposure to bispecific antibodies and contributes to resistance to therapy.
We therefore investigated the relevance of continuous long-term bispecific molecule stimulation on T-cell function and exhaustion in an in vitro model system using a CD19xCD3 half-life–extended bispecific molecule (AMG 562) for proof of concept. We demonstrate that continuous stimulation with bispecifics over 28 days induces T-cell exhaustion and we provide evidence that disruption of this stimulation using treatment-free intervals (TFIs) maintains high T-cell functionality and induces transcriptional reprogramming. Finally, we report improved antileukemic efficacy of TFI-stimulated vs continuously stimulated T cells in a patient-derived xenograft (PDX) ALL mouse model.
Methods
Assessment of ex vivo T-cell function of r/r BCP-ALL patients
28-day stimulation of healthy donor T cells with AMG 562
Healthy donor (HD) T cells were isolated from peripheral blood mononuclear cells using the Human T Cell Isolation Kit (STEMCELL Technologies, Vancouver, Canada) and cocultured with irradiated OCI-Ly1 cells in culture medium (E:T = 1:4) containing 5 ng/mL AMG 562. On day 3, culture medium, target cells, and AMG 562 were replenished. On day 7, T cells were isolated from cultures (stimulation cycle 1) and functionally tested, as detailed below. Remaining T cells were recultured with OCI-Ly1 cells and AMG 562, as described above (stimulation cycle 2). The T cells underwent 4 stimulation cycles. For experiments implementing TFIs, T cells were cocultured with OCI-Ly1 cells in absence of AMG 562 during stimulation cycles 2 (days 7-14) and 4 (days 21-28).
Immunophenotyping of T cells
Quantification of cytokine secretion
Cytokine levels in supernatants were measured using CBA. In some experiments, isolated T cells were restimulated with phorbol myristate acetate (PMA; 20 ng/mL) and ionomycin (750 ng/mL) in the presence of GolgiStop/GolgiPlug solution containing monensin (25 nM) and brefeldin A (10 ng/mL; all Sigma-Aldrich, St. Louis, MO) for 4 hours at 37°C with 5% CO2. Subsequently, cells were stained with AquaLiveDead and antibodies against CD2, CD4, and CD8, then permeabilized and stained intracellularly with antibodies against IFN-γ and TNF-α or corresponding isotype controls.
Proliferation and cytotoxicity assays
Cytotoxicity assays against OCI-Ly1 cells were incubated for 4 hours with GolgiStop/GolgiPlug solution followed by staining with AquaLiveDead and antibodies against CD2, CD4, CD8, and CD19. Then, cells were permeabilized and stained intracellularly for granzyme B or isotype control.
Metabolic stress tests
T cells were stimulated for 48 hours with CD3/CD28 Dynabeads (Thermo Fisher Scientific, Waltham, MA). After bead depletion, 2.5 × 10⁵ T cells/well were plated on a poly-d-lysine-coated 96-well plate. Mitochondrial and glycolysis stress tests were performed on a Seahorse XFe96 Analyzer using corresponding kits (Agilent, Santa Clara, CA). Metabolic rate was normalized to cell count using a Cytation 1 reader (BioTek Instruments, Inc., Winooski, VT).
Bulk RNA sequencing
5 × 10⁵ viable CD3+ T cells were sorted and lysed in Trizol (Sigma-Aldrich). RNA was isolated using the RNA Clean and Concentrator-25 Kit (Zymo Research, Freiburg, Germany). Libraries were prepared using the NEBNext Ultra II Directional RNA Library Prep Kit for Illumina (New England BioLabs, Frankfurt, Germany).
In vivo studies
NOD.Cg-Prkdcscid IL2rgtm1Wjl/SzJ (NSG) mice were engrafted with PDX-ALL-265 cells expressing enhanced firefly luciferase and GFP. On day 28, mice received human T cells stimulated in vitro with AMG 562 for 14 days either continuously or with a TFI from day 7 to 14. Subsequently, mice were treated weekly with AMG 562 or control construct (cBiTE). Leukemia burden was monitored twice weekly by bioluminescence imaging.24,25 The study protocol was reviewed and approved by local government authorities.
Statistical analysis
Prism 8 v.8.4.3. (471) (GraphPad Software, LLC) was used for data visualization and statistical analysis. The Mann-Whitney test, the Kruskal-Wallis and Dunn’s multiple comparisons test, or two-way ANOVA and Sidak’s multiple comparisons test was used for statistical testing, as specified in the respective figure legends. Not significant (ns) P > .05; *P < .05; **P < .01; ***P < .001; ****P ≤ 0.0001.
Results
T cells of r/r ALL patients receiving blinatumomab show signs of dysfunction
We hypothesized that continuous exposure to bispecific molecules leads to T-cell exhaustion in patients. Hence, we tested ex vivo T-cell function of r/r BCP-ALL patients that received blinatumomab c.i.v. over 28 days (Table 1). Patient T cells showed high cytotoxicity and IFN-γ secretion prior to blinatumomab treatment. However, both significantly decreased ex vivo during blinatumomab c.i.v. (Figure 1A, mean specific lysis: prior = 73.1% vs during = 31.5%; P = .0052). Longitudinal analysis of T-cell function during the first blinatumomab cycle revealed a significant decline in ex vivo cytotoxicity and IFN-γ secretion within the first 2 weeks of blinatumomab c.i.v. Interestingly, T-cell function increased upon cessation of blinatumomab therapy (Figure 1B, mean specific lysis: day 0 = 73.1% vs day 14 = 17.4%; P = .0176; day 0 vs post = 48.5%; ns). These observations support the hypothesis that continuous exposure with bispecifics may lead to impaired T-cell function in patients.
Characteristics of r/r BCP-ALL patients prior to blinatumomab therapy
| Patient | Age | Sex | Ph | Interval ID - blinatumomab (mo) | Prior therapies | Cytoreductive therapy prior to blinatumomab | Start of cytoreductive therapy prior to blinatumomab | Prior allo-SCT | Blast % (BM) prior to blinatumomab | Days sampled under blinatumomab |
|---|---|---|---|---|---|---|---|---|---|---|
| R1 | 37 | m | − | 21 | GMALL induction I, II and consolidation I conditioning therapy for allo-SCT: TBI (3 × 6 Gy), cyclophosphamide | Vin/Dex | day −12 | + | 54 | 48 |
| R2 | 35 | m | − | 9 | GMALL induction I, II; HAM, FLAG | Vin | day −17 | − | 30 (PB) | 14/21 |
| R3 | 51 | m | − | 32 | GMALL protocol (<55a, complete) | Cy | day −4 | − | 40 | 0/7/28 |
| R4 | 32 | m | − | 5 | GMALL induction I, II | − | − | − | 52 | 1/8/28 |
| R5 | 30 | f | − | 32 | GMALL protocol (<55a, complete); repeated GMALL induction I | − | − | − | 5 | 1/7/22 |
| R6 | 70 | f | + | 18 | EWALL elderly (complete, including dasatinib) | Cy/Dex | day −9 | − | 88 | −2/12/28 |
| R7 | 68 | f | − | 4 | GMALL elderly (induction I, II) | − | − | − | 24 | 0/7/42 |
| R8 | 32 | f | − | 11 | GMALL induction I, II and consolidation I conditioning therapy for allo-SCT: TBI (3 × 4 Gy), etoposide | − | − | + | 70 | 0/21 |
| R9 | 58 | m | − | 14 | GMALL protocol (<55a, until consolidation IV) | FLAG-Ida | day −10 | − | 60 | −1/7/44 |
| R10 | 34 | m | − | 22 | GMALL induction I, II and consolidation I conditioning therapy for allo-SCT: FLAMSA - TBI (2 × 4 Gy) | − | − | + | 8 | −1/7 |
| R11 | 22 | m | − | 7 | GMALL induction I, II and consolidation I FLAG-Ida | Cy/Dox/Vin | day −8 | − | 2 | 8/28/44 |
| R12 | 20 | m | − | 46 | CoALL protocol (complete); GMALL induction I, II and consolidation I, imatinib | − | − | − | 70 | 0/16/22 |
| R13 | 72 | m | − | 5 | GMALL elderly (induction I, II, and consolidation I, II) | Cy | day −4 | − | 39 | 0/8/15 |
allo-SCT, allogeneic stem cell transplantation; BCP-ALL, B-cell precursor acute lymphoblastic leukemia; BM, bone marrow; Cy, cyclophosphamide; Dex, dexamethasone; Dox, doxorubicin; EWALL, European Working Group on Adult ALL; f, female; FLAG-Ida, fludarabine, Ara-C, G-CSF–idarubicin; FLAMSA, Fludarabin, Ara-C, Amsacrine; GMALL, German Multicenter Study Group For Adult ALL; ID, initial diagnosis; m, male; mo, month; PB, peripheral blood; Ph, Philadelphia chromosome; r/r, relapsed/refractory; TBI, total body irradiation; Vin, vincristine.
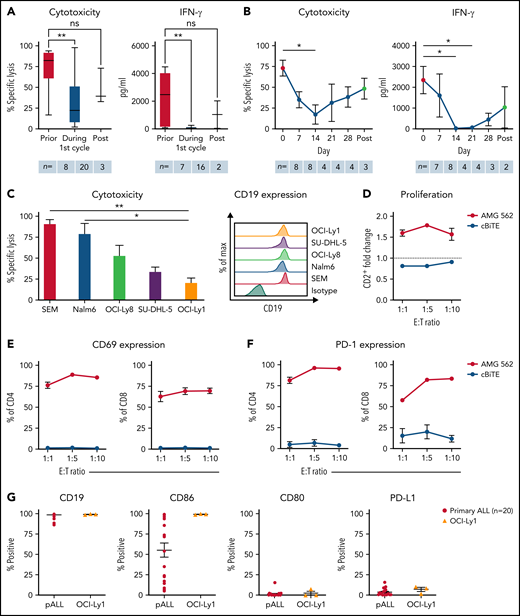
T cells of blinatumomab-treated ALL patients show signs of exhaustion ex vivo. (A) Blinatumomab-mediated cytotoxicity (n = 8–20) on day 3 and IFN-γ secretion (n = 7–16) on day 6 of T cells against REH cells (blinatumomab/control BiTE = 0.5 ng/mL, E:T = 1:3). The T cells were isolated from ALL patients prior to (“pre”), during and after the first cycle of blinatumomab therapy. (B) Blinatumomab-mediated cytotoxicity (n = 3–8) on day 3 and IFN-γ secretion (n = 2–8) on day 6 of T cells against REH cells (blinatumomab/control BiTE = 0.5 ng/mL, E:T = 1:3). The T cells were isolated from ALL patients at different timepoints during the first cycle of blinatumomab therapy. (C) AMG 562-mediated cytotoxicity (n = 3–6) and of HD T cells against ALL (SEM, Nalm6) and diffuse large B cell lymphoma (OCI-Ly8, SU-DHL-5, OCI-Ly1) cell lines (supplemental Table 1) after 4 days (AMG 562/control BiTE = 5 ng/mL, E:T = 1:3). Representative histograms of CD19 expression on ALL and diffuse large B cell lymphoma cell lines are shown. (D) CD2+ fold change (n = 3) of HD T cells and (E-F) percentage of CD69+ and PD-1+ among CD4+ and CD8+ T cells after 3 days of cytotoxicity assay (AMG 562/control BiTE = 5 ng/mL) against OCI-Ly1 cells; n = 3. (G) Percentage of CD19+, CD86+, CD80+, and PD-L1+ primary ALL (n = 20) and OCI-Ly1 cells (n = 3). Boxplot whiskers indicate minima and maxima, and boxes represent the lower quartile, the median, and the upper quartile. All other graphs present mean ± SEM values. Statistical analysis: Kruskal–Wallis and Dunn’s multiple comparison test (A–C); nsP > .05; *P < .05; **P < .01. ALL, acute lymphoblastic leukemia; cBiTE, control BiTE, bispecific control construct; E:T, effector/target ratio; HD, healthy donor; ns, not significant; pALL, primary ALL; ± SEM, standard error of the mean.
T cells of blinatumomab-treated ALL patients show signs of exhaustion ex vivo. (A) Blinatumomab-mediated cytotoxicity (n = 8–20) on day 3 and IFN-γ secretion (n = 7–16) on day 6 of T cells against REH cells (blinatumomab/control BiTE = 0.5 ng/mL, E:T = 1:3). The T cells were isolated from ALL patients prior to (“pre”), during and after the first cycle of blinatumomab therapy. (B) Blinatumomab-mediated cytotoxicity (n = 3–8) on day 3 and IFN-γ secretion (n = 2–8) on day 6 of T cells against REH cells (blinatumomab/control BiTE = 0.5 ng/mL, E:T = 1:3). The T cells were isolated from ALL patients at different timepoints during the first cycle of blinatumomab therapy. (C) AMG 562-mediated cytotoxicity (n = 3–6) and of HD T cells against ALL (SEM, Nalm6) and diffuse large B cell lymphoma (OCI-Ly8, SU-DHL-5, OCI-Ly1) cell lines (supplemental Table 1) after 4 days (AMG 562/control BiTE = 5 ng/mL, E:T = 1:3). Representative histograms of CD19 expression on ALL and diffuse large B cell lymphoma cell lines are shown. (D) CD2+ fold change (n = 3) of HD T cells and (E-F) percentage of CD69+ and PD-1+ among CD4+ and CD8+ T cells after 3 days of cytotoxicity assay (AMG 562/control BiTE = 5 ng/mL) against OCI-Ly1 cells; n = 3. (G) Percentage of CD19+, CD86+, CD80+, and PD-L1+ primary ALL (n = 20) and OCI-Ly1 cells (n = 3). Boxplot whiskers indicate minima and maxima, and boxes represent the lower quartile, the median, and the upper quartile. All other graphs present mean ± SEM values. Statistical analysis: Kruskal–Wallis and Dunn’s multiple comparison test (A–C); nsP > .05; *P < .05; **P < .01. ALL, acute lymphoblastic leukemia; cBiTE, control BiTE, bispecific control construct; E:T, effector/target ratio; HD, healthy donor; ns, not significant; pALL, primary ALL; ± SEM, standard error of the mean.
Establishment of a continuous T-cell stimulation system in vitro with the CD19xCD3 bispecific AMG 562
Next, we aimed to translate the clinical setting into a stable, reproducible in vitro model system. We therefore established long-term T-cell stimulation with the CD19xCD3 bispecific molecule AMG 562 over 28 days. The diffuse large B-cell lymphoma cell line OCI-Ly1 was identified as suitable CD19+ target cell line with slow AMG 562-mediated lysis kinetics to ensure the continued presence of the target antigen for at least 3 days (Figure 1C; mean specific lysis: SEM cells = 91.0% vs OCI-Ly1 cells = 20.8%; P = .0073). OCI-Ly1 cells express high levels of CD19, and HD T cells in coculture with OCI-Ly1 showed robust AMG 562-mediated activation and proliferation after 72 hours (Figure 1D-F; supplemental Figure 1B-C). Furthermore, costimulatory and coinhibitory molecule expression in OCI-Ly1 was comparable to primary ALL samples (n = 20, Figure 1G). The following data are based on 28-day cocultures with HD T cells and OCI-Ly1 cells in the presence of AMG 562, unless otherwise indicated (Figure 2A).
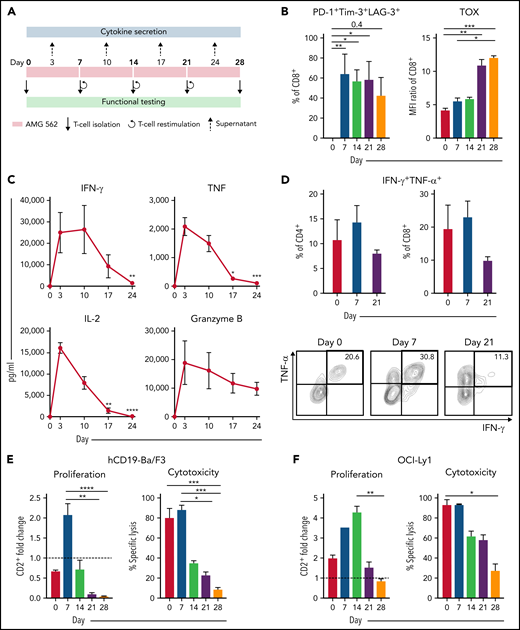
Continuous stimulation with AMG 562 induces T-cell exhaustion. (A) Timeline of continuous T-cell stimulation with AMG 562 and functional testing over 28 days. (B) Percentage of CD8+ T cells coexpressing PD-1, Tim-3, and LAG-3 and the MFI ratio of TOX during continuous AMG 562 stimulation; n = 6. (C) Cytokine and granzyme B levels in coculture supernatants determined by CBA; n = 3–9. Significant differences compared with day 3 are indicated. (D) Percentage of IFN-γ and TNF-α double-positive CD4+ and CD8+ T cells after PMA/ionomycin restimulation. Representative examples of CD8+ T cells from 1 donor are shown; n = 3. (E-F) AMG 562-mediated CD2+ fold change (n = 3) and cytotoxicity against hCD19-Ba/F3 cells (E) or OCI-Ly1 cells (F) after 3 days (AMG 562/cBiTE = 5 ng/mL, E:T = 1:1); n = 6. Data are mean ± SEM values. Statistical analysis: Kruskal–Wallis and Dunn’s multiple comparison test (B,C,E,F); *P < .05; **P < .01; *** P < .001; ****P < .0001. CBA, cytometric bead array; E:T, effector/target ratio; LAG-3, lymphocyte activation gene 3; MFI, median fluorescence intensity; PD-1, programmed cell death protein 1; PMA, phorbol myristate acetate;± SEM, standard error of the mean.
Continuous stimulation with AMG 562 induces T-cell exhaustion. (A) Timeline of continuous T-cell stimulation with AMG 562 and functional testing over 28 days. (B) Percentage of CD8+ T cells coexpressing PD-1, Tim-3, and LAG-3 and the MFI ratio of TOX during continuous AMG 562 stimulation; n = 6. (C) Cytokine and granzyme B levels in coculture supernatants determined by CBA; n = 3–9. Significant differences compared with day 3 are indicated. (D) Percentage of IFN-γ and TNF-α double-positive CD4+ and CD8+ T cells after PMA/ionomycin restimulation. Representative examples of CD8+ T cells from 1 donor are shown; n = 3. (E-F) AMG 562-mediated CD2+ fold change (n = 3) and cytotoxicity against hCD19-Ba/F3 cells (E) or OCI-Ly1 cells (F) after 3 days (AMG 562/cBiTE = 5 ng/mL, E:T = 1:1); n = 6. Data are mean ± SEM values. Statistical analysis: Kruskal–Wallis and Dunn’s multiple comparison test (B,C,E,F); *P < .05; **P < .01; *** P < .001; ****P < .0001. CBA, cytometric bead array; E:T, effector/target ratio; LAG-3, lymphocyte activation gene 3; MFI, median fluorescence intensity; PD-1, programmed cell death protein 1; PMA, phorbol myristate acetate;± SEM, standard error of the mean.
Continuous T-cell stimulation with AMG 562 over 28 days induces T-cell exhaustion in vitro
Immunophenotyping during AMG 562 stimulation showed that only a minor fraction of T cells coexpressed the inhibitory receptors (IRs) PD-1, Tim-3, and LAG-3 at baseline. However, after 7 days of AMG 562 stimulation, more than 60% of CD4+ and CD8+ T cells coexpressed 3 IRs. Coexpression was maintained until day 28 of continuous stimulation (Figure 2B; supplemental Figure 2A-B; mean % CD8+ T cells: day 0 = 0.05% vs day 7 = 64.0%; P = .004; day 0 vs day 28 = 42.7%). Coexpression of IRs was accompanied by gradual upregulation of the transcription factor TOX (Figure 2B; supplemental Figure 2A-B; mean MFI ratio of CD8+ T cells: day 0 = 4.2 vs day 28 = 12; P = .0001). Importantly, TOX upregulation was accompanied by progressive T-cell dysfunction. Comprehensive functional analysis revealed T-cell dysfunction starting approximately 2 weeks after AMG 562 stimulation commenced. Cytokine secretion into culture supernatants decreased significantly over the course of AMG 562 stimulation (Figure 2C; supplemental Figure 2E, mean IL-2 secretion: day 3 = 16 000 pg/mL vs day 24 = 75 pg/mL; P < .0001). We also observed that coexpression of IFN-γ and TNF-α by CD4+ and CD8+ T cells upon restimulation with PMA/ionomycin declined over time (Figure 2D, IFN-γ+TNF-α+ mean of CD8+: day 0 = 19.6%, day 7 = 23.1%, day 21 = 9.9%). Furthermore, AMG 562-mediated T-cell proliferation and cytotoxicity against hCD19-Ba/F3 cells were highest with T cells extracted from the coculture on day 7, but significantly decreased with further AMG 562 stimulation (Figure 2E; CD2+ fold change after 3 days of assay: day 7 = 2.1 vs day 28 = 0.05; P < .0001; mean specific lysis: day 7 = 88.4% vs day 28 = 8.6%; P = .0003). Similar results were observed in cytotoxicity assays against OCI-Ly1 cells (Figure 2F; supplemental Figure S2C). Importantly, T-cell exhaustion occurred upon continuous BsAb stimulation using different target cell lines and BsAbs (supplemental Figure 2F-G). Together, we found that continuous stimulation with AMG 562 for up to 28 days induced T-cell exhaustion.
TFIs reinvigorate T-cell function in vitro
We then hypothesized that disruption of continuous antigen exposure might allow the functional recovery of T cells and to ameliorate exhaustion. We therefore implemented resting periods (the aforementioned TFIs) between days 7-14 and days 21-28 by removing AMG 562 from cocultures and compared the function of T cells that had undergone TFIs with cells continuously (CONT) stimulated with AMG 562 (Figure 3A). During TFIs, a significantly smaller fraction of CD4+ and CD8+ T cells coexpressed PD-1, Tim-3, and LAG-3 (Figure 3B; supplemental Figure 3A, mean % of CD8+ T cells at day 14: CONT = 57% vs TFI = 21.8%; P = .013). This effect was transient and coexpression was reestablished upon restimulation with AMG 562 (Figure 3B; supplemental Figure 3A, mean % of CD8+ T cells at day 21: CONT = 58.7% vs TFI = 57.8%; P > .99). Despite the reexpression of IRs, secretion of cytokines on day 17 of the long-term culture was significantly higher in TFI-stimulated T cells (Figure 3C, mean IL-2 secretion: CONT = 1889 pg/mL vs TFI = 17 724 pg/mL; P < .0001). In concordance, TFIs increased the percentage of IFN-γ+TNF-α+ T cells upon PMA/ionomycin restimulation as compared with continuously stimulated T cells on day 28 of culture (Figure 3D, mean % of CD8+ T cells: CONT = 20.6% vs TFI = 38.2%). Also, TFIs markedly reinvigorated AMG 562-mediated T-cell proliferation on days 14 and 28 of long-term culture (Figure 3E, mean CD2+ fold change after 3 days of assay; day 14: CONT = 1.1 vs TFI = 4.1; P = .002; day 28: CONT = 0.06 vs TFI = 2.8; P = .09). This was accompanied by significantly increased cytotoxicity (mean specific lysis; day 14: CONT = 34.9% vs TFI = 93.4%; P < .0001; day 28: CONT = 8.6% vs TFI = 58.7%; P < .0001) and granzyme B production (mean MFI ratio of CD8+ T cells; day 14: CONT = 144.5 vs TFI = 451.8; P < .0001; day 28: CONT = 45.5 vs TFI = 196.1; P = .0038). Importantly, T-cell exhaustion and reinvigoration by a TFI could be reproduced by using the AML cell line Molm-13 and a CD33xCD3 half-life extended bispecific molecule for continuous or TFI-stimulation (supplemental Figure 3G). We also observed that T cells upregulated TCRαβ during TFIs (Figure 3F, mean MFI ratio of CD2+; day 14: CONT = 74.3 vs TFI = 299.6; P = .016), pointing toward a possible mechanism behind the enhanced function in TFI-stimulated T cells. Notably, inhibition of TCR signaling by intermittent addition of the Src kinase inhibitor dasatinib26,27 during continuous AMG 562 stimulation led to similar results (Figure 3G-I; supplemental Figure 4).
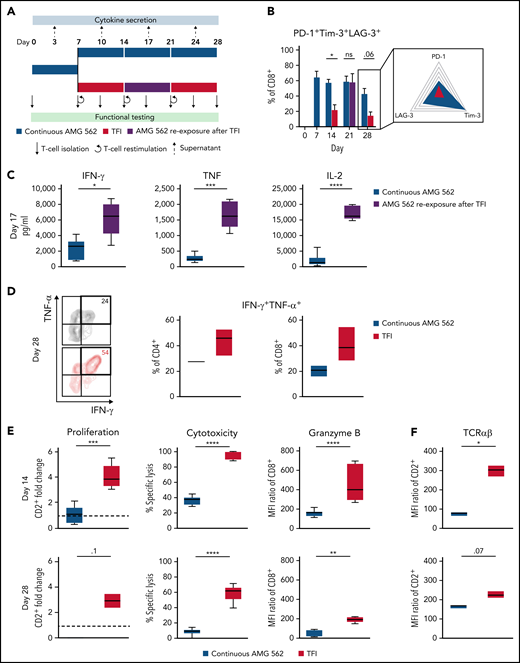
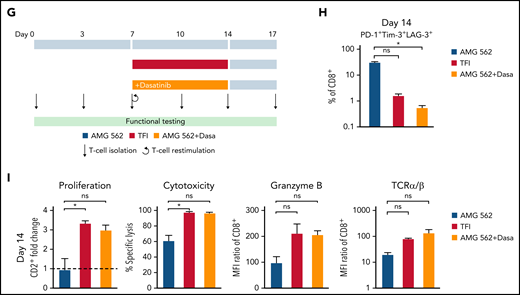
TFIs reinvigorate T-cell function. (A) Timeline of continuous vs TFI T-cell stimulation with AMG 562 over 28 days. (B) Percentage of CD8+ T cells coexpressing PD-1, Tim-3, and LAG-3; n = 6. The spider plot (right) indicates coexpression on day 28 in continuously stimulated vs rested T cells from 1 representative donor. (C) Cytokine levels determined by CBA in coculture supernatants on day 17; n = 6. (D) Percentage of IFN-γ and TNF-α double-positive CD4+ and CD8+ T cells after PMA/ionomycin restimulation on day 28 of coculture; n = 3. Representative plots of CD8+ T cells from 1 donor are shown. (E) AMG 562-mediated CD2+ fold change (n = 3), cytotoxic capacity against hCD19-Ba/F3 cells (n = 6) and granzyme B expression (n = 6) of isolated T cells after 14 or 28 days of coculture. (F) TCR expression of T cells (n = 3) quantified by immunophenotyping during coculture. (G) Timeline of AMG 562+dasatinib-mediated T-cell stimulation in comparison with continuous or TFI stimulation over 17 days. Dasatinib = 100 nM. (H) Percentage of CD8+ T cells coexpressing PD-1, Tim-3, and LAG-3; n = 3. (I) T-cell proliferation, cytotoxicity, Granzyme B, and TCR expression; n = 3. Boxplot whiskers indicate minima and maxima, and boxes represent the lower quartile, the median, and the upper quartile. Bar graphs present mean ± SEM values. Statistical analysis: 2-way ANOVA and Sidak’s multiple comparison test (B,C,E-F,H–I); nsP > .05; *P < .05; **P < .01; ***P < .001; ****P < .0001. CBA, cytometric bead array; LAG-3, lymphocyte activation gene 3; ns, not significant; PD-1, programmed cell death protein 1; PMA, phorbol myristate acetate; ± SEM, standard error of the mean; TCR, T-cell receptor; TFI(s), treatment-free interval(s).
TFIs reinvigorate T-cell function. (A) Timeline of continuous vs TFI T-cell stimulation with AMG 562 over 28 days. (B) Percentage of CD8+ T cells coexpressing PD-1, Tim-3, and LAG-3; n = 6. The spider plot (right) indicates coexpression on day 28 in continuously stimulated vs rested T cells from 1 representative donor. (C) Cytokine levels determined by CBA in coculture supernatants on day 17; n = 6. (D) Percentage of IFN-γ and TNF-α double-positive CD4+ and CD8+ T cells after PMA/ionomycin restimulation on day 28 of coculture; n = 3. Representative plots of CD8+ T cells from 1 donor are shown. (E) AMG 562-mediated CD2+ fold change (n = 3), cytotoxic capacity against hCD19-Ba/F3 cells (n = 6) and granzyme B expression (n = 6) of isolated T cells after 14 or 28 days of coculture. (F) TCR expression of T cells (n = 3) quantified by immunophenotyping during coculture. (G) Timeline of AMG 562+dasatinib-mediated T-cell stimulation in comparison with continuous or TFI stimulation over 17 days. Dasatinib = 100 nM. (H) Percentage of CD8+ T cells coexpressing PD-1, Tim-3, and LAG-3; n = 3. (I) T-cell proliferation, cytotoxicity, Granzyme B, and TCR expression; n = 3. Boxplot whiskers indicate minima and maxima, and boxes represent the lower quartile, the median, and the upper quartile. Bar graphs present mean ± SEM values. Statistical analysis: 2-way ANOVA and Sidak’s multiple comparison test (B,C,E-F,H–I); nsP > .05; *P < .05; **P < .01; ***P < .001; ****P < .0001. CBA, cytometric bead array; LAG-3, lymphocyte activation gene 3; ns, not significant; PD-1, programmed cell death protein 1; PMA, phorbol myristate acetate; ± SEM, standard error of the mean; TCR, T-cell receptor; TFI(s), treatment-free interval(s).
TFIs maintain high metabolic fitness of T cells
Highly functional T cells have significant energy demands, and T-cell exhaustion confers changes in the T cell’s metabolic program.28 We therefore hypothesized that exhausted and TFI-stimulated T cells possess distinct metabolic phenotypes and compared the metabolic profiles of continuously AMG 562-stimulated with TFI-stimulated T cells. Indeed, loss of effector function in continuously stimulated T cells (Figure 2) was accompanied by mitochondrial impairment (Figure 4A, oxygen consumption rate [OCR], in pmol/min/1000 cells; mean maximal OCR: day 0 = 3.3 vs day 14 = 1.0; P = .0169). Strikingly, on day 14, TFI-stimulated T cells showed significantly higher basal and maximal mitochondrial respiration and spare respiratory capacity (SRC; Figure 4B, OCR in pmol/min/1000 cells; mean maximal OCR: CONT = 3.9 vs TFI = 13.5; P = .0079; SRC: CONT = 2.2 vs TFI = 8.5; P = .0317). Furthermore, TFI-stimulated T cells maintained higher glycolytic capacity and glycolytic reserve (Figure 4C, mean glycolytic reserve in mpH/min/1000 cells: CONT = 0.2 vs TFI = 0.6; P = .0397). Similar effects were observed even after 28 days of continuous vs TFI AMG 562 stimulation (supplemental Figure 3E-F). Overall, these data indicate that continuously AMG 562-stimulated T cells are metabolically impaired, whereas a TFI maintains high metabolic fitness.
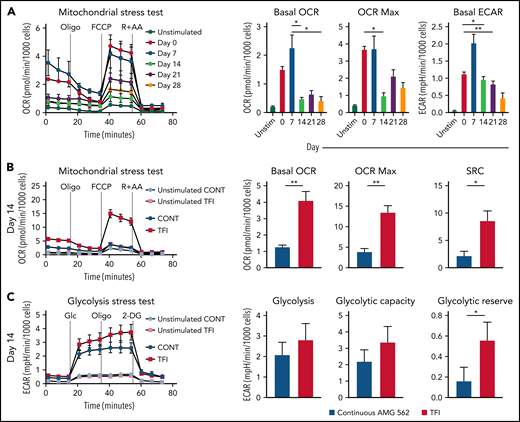
TFIs maintain high T-cell metabolic fitness. (A) Kinetic plot and corresponding bar graphs of normalized OCR obtained during mitochondrial stress test of T cells continuously stimulated with AMG 562; n = 3. (B) Kinetic plot and corresponding bar graphs of normalized OCR obtained during mitochondrial stress test of T cells after 14 days of continuous vs TFI AMG 562 stimulation; n = 5. (C) Kinetic plot and corresponding bar graphs of normalized ECAR obtained during glycolysis stress test of T cells after 14 days of continuous vs TFI AMG 562 stimulation; n = 5. All graphs present mean ± SEM values. Statistical analysis: Kruskal–Wallis and Dunn’s multiple comparison test (A); 2-way ANOVA and Sidak’s multiple comparison test (B-C); *P < .05; **P < .01. ECAR, extracellular acidification rate; OCR, oxygen consumption rate; ±SEM, standard error of the mean; TFI(s), treatment-free interval(s).
TFIs maintain high T-cell metabolic fitness. (A) Kinetic plot and corresponding bar graphs of normalized OCR obtained during mitochondrial stress test of T cells continuously stimulated with AMG 562; n = 3. (B) Kinetic plot and corresponding bar graphs of normalized OCR obtained during mitochondrial stress test of T cells after 14 days of continuous vs TFI AMG 562 stimulation; n = 5. (C) Kinetic plot and corresponding bar graphs of normalized ECAR obtained during glycolysis stress test of T cells after 14 days of continuous vs TFI AMG 562 stimulation; n = 5. All graphs present mean ± SEM values. Statistical analysis: Kruskal–Wallis and Dunn’s multiple comparison test (A); 2-way ANOVA and Sidak’s multiple comparison test (B-C); *P < .05; **P < .01. ECAR, extracellular acidification rate; OCR, oxygen consumption rate; ±SEM, standard error of the mean; TFI(s), treatment-free interval(s).
TFIs induce transcriptional reprogramming of T cells
Next, we performed bulk RNA sequencing of T cells after continuous AMG 562 stimulation or with TFIs to identify transcriptional profiles that drive the profound functional and metabolic differences observed. Samples were processed in 3 batches as shown in supplemental Figure 6I. Unbiased principal component analysis revealed separate clustering of samples according to timepoint and/or treatment (Figure 5A). Differentially expressed gene analysis of day-14 TFI vs CONT T cells identified 1902 significantly upregulated and 2603 downregulated genes (Padj < .05). Unsupervised clustering of the top 100 differentially expressed genes showed striking similarity in gene expression patterns in unstimulated (day 0) and day-14 TFI T cells (Figure 5C), suggesting transcriptional reprogramming. Intriguingly, memory-related genes were highly enriched on day 14 of the TFI stimulation (TCF7, IL7R, and SELL; Figure 5B-D). Genes related to cell cycle (CCNB1 and CDK1) and activation (IL2RA) were downregulated in day-14 TFI vs CONT T cells (Figure 5B-C). In line with functional reinvigoration (Figure 3), genes involved in T-cell exhaustion (NR4A3, IRF4, PDCD1, LAG3) were downregulated in day-14 TFI compared with continuously stimulated T cells (Figure 5B). Pathway analysis of day-14 TFI vs CONT T cells confirmed downregulation of the cell cycle (G2M checkpoint, normalized enrichment score [NES] = −2.47, Padj = 6.3E−10) and metabolism (MTORC1 signaling, NES = −2.27, OXPHOS, NES = −2.03; Padj = 6.3E−10) in line with T-cell quiescence during a TFI (Figure 5E). Gene set enrichment analysis also showed enrichment of memory- compared with effector-related genes identified in a chronic lymphocytic choriomeningitis virus infection model29 in day-14 TFI-stimulated T cells (Figure 5F; GSE9650, NES = −1.95, false-discovery rate q = 0.0). Together, these data suggest that day-14 TFI-stimulated T cells were functionally and transcriptionally rejuvenated during the TFI.
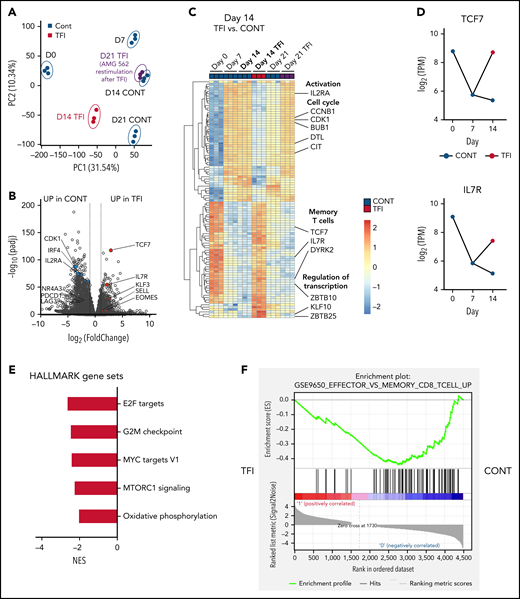
T cells are transcriptionally reprogrammed during TFIs. (A) Principal component analysis. (B) Volcano plot of day 14 TFI vs CONT T cells; Padj < .05. Selected genes are highlighted as significantly downregulated (blue) or significantly upregulated (red) in TFI vs CONT cells. (C) Heatmap with hierarchical clustering of the top 100 differentially expressed genes in day-14 TFI vs CONT T cells; Padj < .05. Selected genes are highlighted. (D) Log2(TPM) expression level of TCF7 and IL7R across timepoints 0, 7, and 14 days in TFI vs CONT T cells. (E) Pathways enriched in day-14 TFI vs CONT T cells; Padj < .05. (F) Gene set enrichment analysis of day-14 TFI vs CONT T cells using MSigDB and the gene set GSE9650_EFFECTOR_VS_MEMORY_CD8_TCELL_UP.29 Line plots present mean ± SEM values. CONT, continuously; NES, normalized enrichment score; ±SEM, standard error of the mean; TFI(s), treatment-free interval(s).
T cells are transcriptionally reprogrammed during TFIs. (A) Principal component analysis. (B) Volcano plot of day 14 TFI vs CONT T cells; Padj < .05. Selected genes are highlighted as significantly downregulated (blue) or significantly upregulated (red) in TFI vs CONT cells. (C) Heatmap with hierarchical clustering of the top 100 differentially expressed genes in day-14 TFI vs CONT T cells; Padj < .05. Selected genes are highlighted. (D) Log2(TPM) expression level of TCF7 and IL7R across timepoints 0, 7, and 14 days in TFI vs CONT T cells. (E) Pathways enriched in day-14 TFI vs CONT T cells; Padj < .05. (F) Gene set enrichment analysis of day-14 TFI vs CONT T cells using MSigDB and the gene set GSE9650_EFFECTOR_VS_MEMORY_CD8_TCELL_UP.29 Line plots present mean ± SEM values. CONT, continuously; NES, normalized enrichment score; ±SEM, standard error of the mean; TFI(s), treatment-free interval(s).
Interestingly, after 7 days of restimulation with AMG 562 (day-21 TFI) T cells reexpressed genes involved in activation, growth (DPP4 and SLC3A2) and cell cycle (CDK1 and PLK1) whereas exhaustion-related genes (LAG-3, BTLA, and NFATC1) were downregulated compared with continuously stimulated cells (supplemental Figure 6A-C). This confirmed the enhanced effector function in day-21 TFI vs continuously stimulated T cells, although the effect was less pronounced compared with day 14 (supplemental Figure 3B-D). Furthermore, we found upregulation of natural killer receptor genes in day-21 CONT vs TFI T cells, which has recently been linked to dysfunctional chimeric antigen receptor (CAR) T-cell states30 (supplemental Figure 6H). Pathway analysis revealed that identical pathways downregulated on day-14 TFI-receiving T cells were enriched by day 21 and effector- rather than memory-related genes were enriched in a gene set enrichment analysis (supplemental Figure 6D-E). These data suggest that day-21 TFI T cells are reactivated upon AMG 562 reexposure and less exhausted than continuously stimulated T cells. However, we observed downregulation of effector-associated genes (GZMK and IL-2) and enrichment of exhaustion-associated genes (TOX and CD244) in day-21 TFI vs day-7 T cells (supplemental Figure 6F-G). These observations underline that upon restimulation with AMG 562 after a TFI T-cell function tends to decrease again (supplemental Figure 3B-F) and support the notion that TFIs have the potential to delay but not to fully prevent exhaustion.
TFIs improve AMG 562-mediated leukemia control in vivo
Lastly, we aimed to confirm the in vivo relevance of a TFI for enhanced T-cell function. Thus, HD T cells were stimulated in vitro for 14 days continuously with AMG 562 or with a TFI, and subsequently transplanted into NSG mice bearing PDX-ALL cells (Figure 6A). Strikingly, T cells receiving a TFI, but not those continuously stimulated, were able to clear the leukemia in mice receiving AMG 562 treatment, as quantified by bioluminescence imaging and peripheral blood ) and bone marrow analysis (Figure 6B-C; supplemental Figure 7; mean PDX-ALL cells/μL in bone marrow on day 43 post-ALL engraftment: CONT = 75.0 vs TFI = 6.2). We also observed greater expansion of TFI T cells in peripheral blood 6 days after initial AMG 562 injection in vivo (Figure 6D; mean CD3+ cells/μL: CONT = 3.5 vs TFI = 41.5) and higher levels of human cytokines in murine plasma 1 day after first AMG 562 injection in vivo (Figure 6E; mean concentration of IL-2: CONT = 71.9 pg/mL vs TFI = 108.6 pg/mL). Together, these data confirm that a TFI preserved the high antileukemic activity of T cells in vivo, whereas continuously stimulated T cells failed to control the tumors.
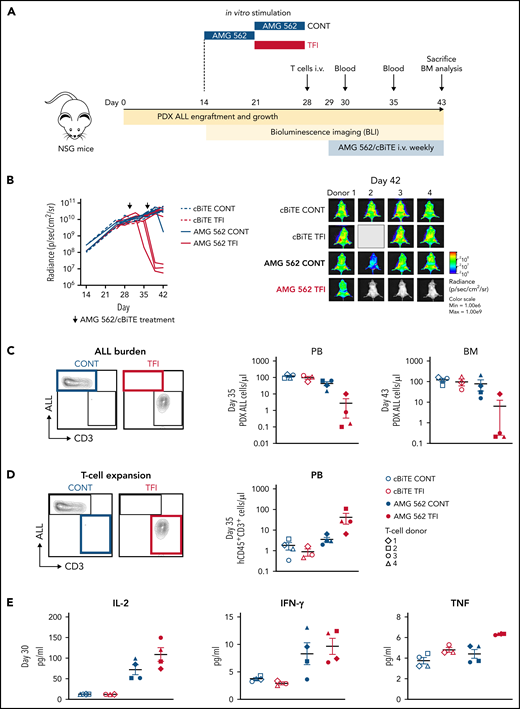
TFIs improve AMG 562-mediated control of ALL in vivo. (A) Timeline of in vivo experiment: PDX-ALL cells were transplanted into NSG mice. T cells (4 donors) were stimulated in vitro for 14 days continuously or with TFI cells (days 7-14) and subsequently injected into NSG mice 28 days post engraftment. Mice were treated with AMG 562/control BiTE = 5 ng/mL on days 1 and 8 post T-cell injection. T-cell function and ALL burden was analyzed via bioluminescence imaging and flow cytometry. (B) Quantification of bioluminescence imaging signals (left panel) and images of mice on day 42 after engraftment (right panel). See supplemental Figure 7B for images of all timepoints. (C) Flow cytometry analysis of PDX-ALL cells detected in PB on day 35 and in BM on day 43. Representative plots from 1 T-cell donor are shown. (D) CD3+ T-cell expansion in PB on day 35. Representative plots from 1 T-cell donor are shown. (E) Human cytokine levels detected in murine plasma on day 30. All graphs present mean ± SEM values. BM, bone marrow; cBiTE, control BiTE, bispecific control construct; CONT, continuously; PB, peripheral blood; PDX-ALL, patient-derived xenograft acute lymphoblastic leukemia; NSG, NOD.Cg-Prkdcscid IL2rgtm1Wjl/SzJ; ±SEM, standard error of the mean; TFI(s), treatment-free interval(s).
TFIs improve AMG 562-mediated control of ALL in vivo. (A) Timeline of in vivo experiment: PDX-ALL cells were transplanted into NSG mice. T cells (4 donors) were stimulated in vitro for 14 days continuously or with TFI cells (days 7-14) and subsequently injected into NSG mice 28 days post engraftment. Mice were treated with AMG 562/control BiTE = 5 ng/mL on days 1 and 8 post T-cell injection. T-cell function and ALL burden was analyzed via bioluminescence imaging and flow cytometry. (B) Quantification of bioluminescence imaging signals (left panel) and images of mice on day 42 after engraftment (right panel). See supplemental Figure 7B for images of all timepoints. (C) Flow cytometry analysis of PDX-ALL cells detected in PB on day 35 and in BM on day 43. Representative plots from 1 T-cell donor are shown. (D) CD3+ T-cell expansion in PB on day 35. Representative plots from 1 T-cell donor are shown. (E) Human cytokine levels detected in murine plasma on day 30. All graphs present mean ± SEM values. BM, bone marrow; cBiTE, control BiTE, bispecific control construct; CONT, continuously; PB, peripheral blood; PDX-ALL, patient-derived xenograft acute lymphoblastic leukemia; NSG, NOD.Cg-Prkdcscid IL2rgtm1Wjl/SzJ; ±SEM, standard error of the mean; TFI(s), treatment-free interval(s).
Discussion
T-cell-recruiting bispecific antibodies have shown promising response rates in patients. However, a considerable portion of patients remain refractory to therapy.9 One contributor to resistance to therapy is preexisting T-cell dysfunction in patients.11,13 Independent of initial T-cell compartment composition, however, continuous antigen stimulation via the TCR,29,31 or tonic CAR signaling,26,32 have been postulated as major causes of T-cell exhaustion. Therefore, to improve patient outcomes, a deeper understanding of the development of T-cell function during therapy with bispecifics is needed. We demonstrate here that ex vivo T-cell function of r/r BCP-ALL patients deteriorated during blinatumomab c.i.v., particularly within the first 14 days of therapy. In a study in pediatric ALL patients, those that showed no response to blinatumomab on day 15 also failed to reach MRD negativity on day 29.33 This hints that response occurs early during treatment and leads to the hypothesis that continuous exposure to bispecifics induces T-cell exhaustion. We are the first to comprehensively analyze T-cell exhaustion in the context of bispecifics using a stable 28-day in vitro model system. We could thereby mimic chronic exposure to a bispecific antibody over a clinically relevant time period and monitor T-cell function in a standardized manner. Using this system, we observed gradual upregulation of TOX and multiple IRs over the course of AMG 562 stimulation, accompanied by progressive decline in cytokine secretion, T-cell proliferation, and cytotoxicity. These findings recapitulate well-known hallmark features of exhaustion identified in chronic viral infection and cancer,16,23,34 underlining the suitability of our model system to study T-cell exhaustion.
Strategies to preserve T-cell function and achieve durable antitumor responses are urgently needed. Using our model system, we show that a powerful strategy to maintain T-cell function is disruption of continuous bispecific stimulation with TFIs. Using this strategy, we report a sustained high level of secretion of effector cytokines, T-cell proliferation, and cytotoxicity over 28 days, with metabolic reinvigoration and transcriptional reprogramming of T cells. In concordance, recent studies demonstrated the functional reinvigoration of a tonically signaling GD2-CAR by invoking resting periods.26 Furthermore, a phase I/II study reported an improved safety profile for r/r AML patients receiving intermittent flotetuzumab treatment in combination with stepwise dosing during week 1, dexamethasone pretreatment, and tocilizumab.5 Another phase I/II study, treating Ph+ ALL patients with dasatinib26,27 in combination with blinatumomab c.i.v., reported an overall survival rate of 95%35 and an increase in peripheral lymphocytes,36 consistent with our observation that T-cell function can be reinvigorated to a similar extent using TFIs or pharmacological inhibition of TCR signaling with dasatinib (Figure 3; supplemental Figure 4). Together, these studies underline the potential of TFIs for reinvigorating T cells and for fine-tuning T-cell responses in patients.
We show improved expansion and tumor control of in vitro TFI-stimulated T cells using an ALL-PDX mouse model. While this model system underlines the relevance of the rested T-cell phenotype in vivo, suitable mouse models need to be developed in future studies to mimic continuous vs intermittent BsAb administration in vivo.
Targeting PD-1/PD-L1 to overcome T-cell exhaustion has shown efficacy in cancer. The combination of a CD33xCD3 BiTE® construct with disruption of PD-1/PD-L1 signaling increased antitumor responses in preclinical AML models.37 Similar findings in CAR T cells38-40 led to the initiation of clinical trials.41 Intriguingly, T-cell reinvigoration through TFIs was much more efficient than continuous AMG 562 + nivolumab (a PD-1 inhibitor) treatment, the latter showing no to modest T-cell reinvigoration (supplemental Figure 5). In concordance, PD-1 blockade alone failed to reverse phenotypic and transcriptomic hallmarks of exhaustion in CAR T cells.26 This highlights the need to deepen our understanding of the molecular networks involved in T-cell exhaustion.
T-cell metabolism is closely associated with effector function.28,42,43. In metabolic stress tests TFIs significantly enhanced T-cell metabolic fitness, along with increased effector function. In line with these observations, enhanced expansion, persistence, and survival of BBζ vs 28ζ CAR T cells have been linked to higher mitochondrial capacity.44 In chronic lymphocytic leukemia patients, high metabolic fitness of CAR T cells prior to infusion correlated with response to therapy,45 underlining the importance of metabolic fitness for successful immunotherapy.
High SRC, observed in TFI-stimulated T cells, is a hallmark feature of memory T cells,28 and is consistent with upregulation of memory-associated genes in day-14 TFI-stimulated T cells. Transcriptional reprogramming of T cells during a TFI recapitulates findings made in transiently rested CAR T cells26 and preclinical models of resolved chronic infection,46 and confirmed the superior function of TFI- compared with continuously AMG 562-stimulated T cells. Intriguingly, we found that reinvigorated function in day-14 TFI-stimulated T cells coincided with sustained expression of TCF7 (encoding TCF-1). TCF-1 is expressed in precursor-exhausted T cells (TPEX) with the potential to self-renew and to give rise to terminally exhausted TCF-1-negative T cells (TEX). Furthermore, TPEX cells retain the ability to be functionally reinvigorated by checkpoint blockade.47-52 Our findings support the notion that TCF7 expression correlates with T-cell function and distinguishes TEX from functional TPEX cells.
In summary, we identified T-cell exhaustion as a potential mechanism contributing to resistance to bispecifics therapy in a preclinical model. The reinvigorating effect of TFIs on T cells suggests the relevance of resting periods between bispecific antibody treatment cycles. Hence, the implementation of TFIs should be considered for the design of administration schedules in the future. In light of the similarities between the exhausted T-cell phenotypes in chronic viral infections and CAR T-cell and bispecific antibody therapy, TFIs might be applicable to other T-cell–based immunotherapies.
Acknowledgments
The authors thank Sabine Sandner-Thiede, Simone Pentz, Elke Habben, Ewelina Zientara, and Bianca Kirschbaum (University Hospital, Ludwig Maximilian University Munich) and Maike Fritschle (Helmholtz Zentrum Munich) for their excellent technical support. The authors also thank O.W. and Andreas Moosmann for their expert advice. Thanks also go to Karsten Spiekermann, who kindly provided the Ba/F3 cell lines. The authors furthermore thank Eslam Katab for preliminary work on this project. They acknowledge the iFlow Core Facility of the University Hospital Munich (INST 409/225-1 FUGG) for assistance with generating the flow cytometry data.
The work was supported by the Bavarian Elite Graduate School “i-target” (to N.P.), the Else-Kröner-Fresenius Forschungskolleg CSP Cancer Immunotherapy (to V.B.), the Wilhelm-Sander Stiftung (to G.H.), the Sonderforschungsbereich SFB 338 (to M. Subklewe), and research funding from Amgen (to M. Subklewe). O.W. is supported by an Else-Kröner Excellence Fellowship from the Else-Kröner-Fresenius Stiftung (Project-ID 2021_EKES.13).
Authorship
Contribution: M. Subklewe, V.B., R.K., and N.P. designed the study and supervised the project; N.P., M.K., V.B., B.V., T.S., and M. Subklewe wrote the manuscript; N.P., A.N., J.W., M. Scheurer, A. Muth, G.H., and M.O. performed experiments and analyzed and/or interpreted the data; M. Subklewe, V.B., R.K., N.P., M.K., D.N., S.M.L., B.B., S.T., I.J., G.H., M. Sponheimer, A. Marcinek, L.R., A.L., and K.R. were involved in research design and data interpretation; O.W. and M.v.B.-B. critically reviewed and discussed the data. M.K. performed the library preparation for bulk RNA-seq and, in collaboration with T.S., conducted the bioinformatic analysis; B.V. and I.J. designed and performed the in vivo experiments.
Conflict-of-interest disclosure: M. Subklewe has received industry research support from Amgen, Gilead, Miltenyi Biotec, Morphosys, Roche, and Seattle Genetics, and has served as a consultant/advisor to Amgen, BMS, Celgene, Gilead, Pfizer, Novartis, and Roche. She sits on the advisory boards of Amgen, Celgene, Gilead, Janssen, Novartis, Pfizer, and Seattle Genetics, and serves on the speakers’ bureau at Amgen, Celgene, Gilead, Janssen, and Pfizer. V.B. has received research funding from Miltenyi Biotec, Novartis, and Pfizer, and has served as a consultant/advisor to Novartis, Amgen, and Gilead. He serves on the speakers’ bureau at Novartis and Pfizer. R.K. is employed at Amgen Research Munich, Germany. S.M.L. receives research funding from Roche. M.v.B.-B. has received research support from and serves on the speakers’ bureau at Gilead, Miltenyi Biotec, MSD Sharpe & Dohme, Roche, Mologen, Novartis, Astellas, and BMS. K.R. received research funding from Gilead and honoraria from Gilead and Novartis. O.W. has received research funding from Roche. He serves on the speakers’ bureau at Janssen and sits on the advisory board of Epizyme. S.T. has served as a consultant/advisor to Amgen, BMS, GSK, Janssen, Pfizer, Sanofi, and Takeda. The remaining authors declare no competing financial interests.
The current affiliation for B.B. is Adivo GmbH, Martinsried, Germany.
Correspondence: Marion Subklewe, Department of Medicine III, University Hospital, Ludwig Maximilian University, Munich, Germany; e-mail: Marion.Subklewe@med.uni-muenchen.de
RNA-seq data discussed in this publication have been deposited in the Gene Expression Omnibus database (accession number GSE196463).
The online version of this article contains a data supplement.
There is a Blood Commentary on this article in this issue.
The publication costs of this article were defrayed in part by page charge payment. Therefore, and solely to indicate this fact, this article is hereby marked “advertisement” in accordance with 18 USC section 1734.

This feature is available to Subscribers Only
Sign In or Create an Account Close Modal