

Key Points
Using a multi-omics approach, we uncover deregulation of PLCG1 signaling by an intergenic regulatory element in AML1-ETO–driven AML.
The AML1-ETO–specific functional dependency on PLCG1 is essential for LSC self-renewal and facilitates therapeutic targeting.

Abstract
In an effort to identify novel drugs targeting fusion-oncogene–induced acute myeloid leukemia (AML), we performed high-resolution proteomic analysis. In AML1-ETO (AE)-driven AML, we uncovered a deregulation of phospholipase C (PLC) signaling. We identified PLCgamma 1 (PLCG1) as a specific target of the AE fusion protein that is induced after AE binding to intergenic regulatory DNA elements. Genetic inactivation of PLCG1 in murine and human AML inhibited AML1-ETO dependent self-renewal programs, leukemic proliferation, and leukemia maintenance in vivo. In contrast, PLCG1 was dispensable for normal hematopoietic stem and progenitor cell function. These findings are extended to and confirmed by pharmacologic perturbation of Ca++-signaling in AML1-ETO AML cells, indicating that the PLCG1 pathway poses an important therapeutic target for AML1-ETO+ leukemic stem cells.
Introduction
C hromosomal translocations found in acute myeloid leukemia (AML) can generate oncogenic fusions with aberrant epigenetic and transcriptional functions. However, direct therapeutic targeting of leukemia fusion proteins has not been accomplished so far. Although high remission rates can be induced in patients diagnosed with AML1-ETO (AE)/t(8;21)+ AML, only 45% to 70% of patients achieve long-term disease-free survival.1 In these patients, the disease-maintaining clone is not eliminated by chemotherapy, an effect that has been attributed to a persistent leukemia stem cell (LSC) pool. In AML, these LSCs share immunophenotypic features with normal hematopoietic stem cells (HSCs), reside in the bone marrow (BM), and may give rise to relapse after discontinuation of chemotherapy. One functional characteristic of LSCs is unlimited self-renewal capacity, and several genes and signaling pathways have been identified to maintain the balance between stem cell self-renewal and differentiation.2 Therefore, targeting the oncogene induced self-renewal capacity of LSCs could eventually eliminate the malignant clone and prevent relapse. In this study, we addressed this issue and present a strategy that identified a therapeutic target directly regulating the maintenance of AE+ LSCs.
Materials and methods
Cell lines
Leukemia cell lines were purchased from DSMZ (Braunschweig, Germany). Kasumi-1_Cas9-EGFP and SKNO-1_Cas9-Blast are subclones of Kasumi-1 and SKNO-1, respectively, and are stably transduced with either lentiCas9-EGFP (Addgene #63592) or lentiCas9-Blast (Addgene #52962).
Primary patient samples
Primary AML patient samples and healthy donor controls were obtained after informed consent and according to the Helsinki declaration within the AML trials of the German-Austrian AMLSG study group and from the Hematology Tumor Bank Jena and Magdeburg, approved by the respective local ethics committees (University Hospitals Jena, Ulm, or Magdeburg, Germany).
Animal studies
Mice were housed under pathogen-free conditions in the Animal Research Facility OvGU, Magdeburg, and University Hospital Jena, Germany. All experiments were conducted after approval by the Landesverwaltungsamt Sachsen-Anhalt (42502-2-1279 UniMD) and Thüringen (02-030/2016). Conditional Plcg1 mice B6(Cg)-Plcg1tm1Flh/J (Plcγ1 flox/flox) were generated by us as published before.3 Retroviral induction of leukemia was performed as published previously.4,5 For in vivo drug treatment, cyclosporin A was diluted in NaCl0.9% and administered by subcutaneous injections (30 mg/kg) once daily. NaCl0.9% was injected as diluent control.
Immunohistochemistry
Spleen, liver, and lung were fixed and embedded according to standard protocols. Slides were automatically processed for hematoxylin and eosin staining (Leica AutoStainer XL, Leica Biosystems, Wetzlar, Germany). Images were acquired at 10× magnification on an AxioImager A.2 (Carl Zeiss Microscopy, Jena, Germany) and processed using the ImageJ software (National Institutes of Health, Bethesda, MD). To analyze cell morphology, 1 × 10⁵ cells were centrifuged onto glass slides and stained with May-Grünwald/Giemsa staining as described before.6
Flow cytometry and antibody staining
Immunophenotyping of normal and leukemic cell compartments and of leukemic peripheral blood and BM was performed as described previously.4,7 Antibodies are provided in supplemental Table 1, available on the Blood Web site. Flow cytometry was performed on a FACS CantoII cytometer (Becton Dickinson, Heidelberg, Germany). Cell-cycle analysis with Ki67/Hoechst and intracellular flow cytometry in human AML cell lines were performed using the Fix & Perm Cell Permeabilization Kit (Life Technologies, Darmstadt, Germany).
Genetic inactivation by RNAi and CRISPR/Cas9
Genetic inactivation by RNA interference (RNAi) was performed as previously described6 unless otherwise stated. For knockdown of AML1-ETO, the SEW vector system with EGFP was used (provided by M. Scherr, Hannover Medical School, Germany8). For CRISPR/Cas9 experiments, guide RNAs targeting PLCG1, ETO, and RPA3 were designed using the Broad GPP tool.9 Single guide RNA (sgRNA) sequences are provided in supplemental Table 2. For cloning of sgRNA sequences, the improved-scaffold-pU6-sgRNA-EF1Alpha-PURO-T2A-RFP (ipUSEPR) vector system,10 with puromycin resistance and RFP selection marker, was used. Genetic inactivation by CRISPR/Cas9 was performed as previously published.11 For knockout of JUN, CREB1, and FOS, Kasumi-1 cells were transduced with the single-vector lentiviral GeCKO system12 containing sgRNAs for the respective genes, or a nontargeting control (Genescript Biotech, Piscataway Township, NJ). Apoptosis was measured by flow cytometry as indicated using Annexin V/SYTOX Blue staining following the manufacturer`s instruction. Primary mouse BM cells (AE/K, MA9), primary human BM cells isolated from AML patients or healthy donors, or human cell lines were seeded in methylcellulose according to standard protocols and as published previously.6,13
Quantitative real-time polymerase chain reaction
Quantitative polymerase chain reaction experiments were performed as previously published.7,11 Analysis of PLCG1 messenger RNA (mRNA) expression was performed in AE-positive human embryonic stem (ES) cells, human ES cells expressing a doxycycline (Dox)-inducible AE-fusion gene.14 Three independent ES cell clones were stimulated with or without Dox (0-10 ng/mL) and total RNA was isolated. Primer sequences are listed in supplemental Table 3.
Protein extraction and immunoblotting
Proteome and transcriptome analyses
Global proteome and transcriptome profiling were performed and analyzed as previously described11 unless otherwise stated. Proteome data from murine leukemia cells were searched against a species-specific (Mus musculus or Homo sapiens) Swissprot database. Relative quantification was performed in Spectronaut for each pairwise comparison using the replicate samples from each condition. Detailed information on gene- and protein-expression analyses is provided in the supplemental Methods.
Statistics and analysis of gene expression data
Kaplan-Meier curves were plotted using GraphPad Prism version 8.00 (GraphPad Software, San Diego, CA) using the log-rank test (Mantel-Cox test). Statistical analyses were performed using a Student t test (normal distribution) or Mann-Whitney U test. A value of P < .05 was considered statistically significant. Affymetrix .cel files and sample annotation from published AML gene expression datasets GSE13204,15 GSE14468,16 and the HOVON AML cohort E-MTAB-3444 were downloaded from Gene Expression Omnibus or EBI ArrayExpress, respectively. mRNA expression of PLC family members in AML was downloaded from BloodSpot database (http://servers.binf.ku.dk/bloodspot/).
Data availability
Raw data files for the RNA-sequencing analysis and the LncRNA Microarray data have been deposited in the NCBI Gene Expression Omnibus under accession number GSE120828 (RNA-Seq) and GSE122062 (LncRNA Microarray). The mass spectrometry data have been deposited to the ProteomeXchange Consortium (http://proteomecentral.proteomexchange.org) via the PRIDE partner repository17,18 with the dataset identifier PXD011251 (patient samples, mouse LSCs) and PXD026374 (SKNO-1).
Results
Phospholipase C signaling is enriched in AML1-ETO LSCs
To identify oncogenic cellular functions with relevance for LSC self-renewal, we performed global proteome profiling. AML was induced by retroviral expression of either AML1-ETO (AE) or MLL-AF9 (MA9) in murine HSPCs (Lineage-Sca1+Kit+, LSK), which were subsequently transplanted into irradiated syngeneic recipients. After onset of AML, LSC-enriched (GFP+Kit+) cells isolated from 4 different primary recipient hosts were analyzed by in-depth quantitative proteomic analysis using high-resolution mass spectrometry (Figure 1A; supplemental Figure 1A-C). More than 3000 proteins were quantified (supplemental Figure 1A) with 868 proteins being differentially expressed between AE and MA9 LSC-enriched populations (supplemental Figure 1C). Gene set enrichment analyses (GSEA) revealed a significant enrichment of calcium-dependent cellular functions in AE− LSCs (Figure 1B) with phospholipase C (PLC)- and calcium-signaling being among the most highly enriched pathways (Figure 1C). To validate a role for the PLC-calcium-axis in primary patient samples, we performed mass spectometry-based proteomics on sorted CD34+ blasts from 4 AE+ vs 4 AE− AML patients (Figure 1D-E; supplemental Figure 1D-F); GSEA confirmed deregulation of calcium-dependent cellular functions in the AE+ samples (Figure 1F). We next sought to analyze the expression of PLCs in published AML gene expression datasets.15,16,19 Of 13 PLC family members, only PLCG1 expression was highly increased in AE-AML in several independent datasets (Figure 1G; supplemental Figure 2A-D), suggesting a functional relevance for AE-driven AML. Likewise, PLCG1 protein expression was increased in human AE+ cell lines Kasumi-1 (supplemental Figure 2E) and SKNO-1 (Figure 1H; supplemental Figure 2F) when compared with non-AE controls. Of note, high PLCG1 expression correlated with inferior relapse-free survival (Figure 1I) and was significantly elevated in patients experiencing relapse (Figure 1J), which indicates its potential relevance for the persistent LSC population.
![Phospholipase C and Ca++ signaling is enriched in AML1-ETO transformed LSCs. (A) Outline of the proteomic workflow. (B) Gene set enrichment analysis (GSEA) on murine MLL-AF9 (MLL9) and AML1-ETO (AE) LSCs (n = 4 per genotype). (C) Ingenuity pathway analysis (IPA) on murine AML1-ETO transformed LSC compared with MLL-AF9 positive controls. (D) Schematic of proteome analysis of primary human AML1-ETO/t(8;21) AML (n = 4 per genotype). (E) Molecular analysis of AML patient samples applied for proteomic analysis. (F) GSEA on human t(8;21) AML compared with non-t(8;21) controls. (G) t-SNE plot displaying the gene expression landscape of 641 AML patients of the HOVON cohort19 with an overlay of different AML subtypes (left) with absolute PLCG1 expression values (right). (H) PLCG1 protein expression in AML1-ETO positive (Kasumi-1, SKNO-1) vs AML1-ETO− human AML cell lines analyzed by intracellular flow cytometry (n = 5 per cell line; 1-way analysis of variance [ANOVA]). (I) Relapse-free survival (RFS, B) in patients with t(8;21) AML according to the expression level of PLCG1. Survival curves were estimated with the Kaplan-Meier method and compared using a log-rank test. (J) Scatterplot depicting PLCG1 expression levels in t(8;21) patients according to their relapse status (no relapse, n = 33; relapse, n = 27; unknown, n = 2).](https://ash.silverchair-cdn.com/ash/content_public/journal/blood/139/7/10.1182_blood.2021012778/5/m_bloodbld2021012778f1a.png?Expires=1769922215&Signature=0PCy015qhrae5AGQ4ymml01ykMFbAoN3VNutlYBCpVULsdlJauNN-xq1nDJWTatBY9WE500UhEnyVE1yQuz-z2AHWvbXNgyY2zsynUldf6LpvjIe904lTRl9jBk7myeVzPgS8YGJKUr0zLRmJ5kQvNn6Doqbkg92oSuz-WgDVo3~ROm-QHnbhqQBA~oH~dB1keZWy2DNj2ClH-j~gXxA~1e9TtIlWoYv7QI0q6MyGnQJgYt2UnWjZI85AlxBJfNWAAPkUKUoNFSGZOsZL3iK9PV3wp-SVM-76fo-a6z1LXg~wAA40pz2l9mbVzdPrIDAbxAn0NO6hwoCP6KKDpx-KQ__&Key-Pair-Id=APKAIE5G5CRDK6RD3PGA)
![Phospholipase C and Ca++ signaling is enriched in AML1-ETO transformed LSCs. (A) Outline of the proteomic workflow. (B) Gene set enrichment analysis (GSEA) on murine MLL-AF9 (MLL9) and AML1-ETO (AE) LSCs (n = 4 per genotype). (C) Ingenuity pathway analysis (IPA) on murine AML1-ETO transformed LSC compared with MLL-AF9 positive controls. (D) Schematic of proteome analysis of primary human AML1-ETO/t(8;21) AML (n = 4 per genotype). (E) Molecular analysis of AML patient samples applied for proteomic analysis. (F) GSEA on human t(8;21) AML compared with non-t(8;21) controls. (G) t-SNE plot displaying the gene expression landscape of 641 AML patients of the HOVON cohort19 with an overlay of different AML subtypes (left) with absolute PLCG1 expression values (right). (H) PLCG1 protein expression in AML1-ETO positive (Kasumi-1, SKNO-1) vs AML1-ETO− human AML cell lines analyzed by intracellular flow cytometry (n = 5 per cell line; 1-way analysis of variance [ANOVA]). (I) Relapse-free survival (RFS, B) in patients with t(8;21) AML according to the expression level of PLCG1. Survival curves were estimated with the Kaplan-Meier method and compared using a log-rank test. (J) Scatterplot depicting PLCG1 expression levels in t(8;21) patients according to their relapse status (no relapse, n = 33; relapse, n = 27; unknown, n = 2).](https://ash.silverchair-cdn.com/ash/content_public/journal/blood/139/7/10.1182_blood.2021012778/5/m_bloodbld2021012778f1b.png?Expires=1769922215&Signature=RdoJUq1y~JPadH-~oD1Xf~i3H9-rtQ-JrwC~jQVvuVX9Jqtuo-WH~pLv7p-kRSv6ph5L7TRUQe6OoK9Jb3m1JTLm93cZv0J-sg3bfKPgatMMDmSyM5qfAQdhTW~RTTUY6YHcUuK03tmF1qqxbZsOG3zH7D~wRN5KBlXD9lN0Q12EOMT1yc4GAuI8SOVG8~OJ06JrRpU7ZTO6CnYYnLL7DXO5uAVBStFd4OfZZgmDRS4JlskG8gPJr5xrXLgALNY8JYBpDvvghpmg8HC7dU8C-FuGU5zDbq~pXcpm59hPej5fZMHe-H3xrxHXsDXzzX82~FLtXZBl-TdX-Dx5N7apxw__&Key-Pair-Id=APKAIE5G5CRDK6RD3PGA)
Phospholipase C and Ca++ signaling is enriched in AML1-ETO transformed LSCs. (A) Outline of the proteomic workflow. (B) Gene set enrichment analysis (GSEA) on murine MLL-AF9 (MLL9) and AML1-ETO (AE) LSCs (n = 4 per genotype). (C) Ingenuity pathway analysis (IPA) on murine AML1-ETO transformed LSC compared with MLL-AF9 positive controls. (D) Schematic of proteome analysis of primary human AML1-ETO/t(8;21) AML (n = 4 per genotype). (E) Molecular analysis of AML patient samples applied for proteomic analysis. (F) GSEA on human t(8;21) AML compared with non-t(8;21) controls. (G) t-SNE plot displaying the gene expression landscape of 641 AML patients of the HOVON cohort19 with an overlay of different AML subtypes (left) with absolute PLCG1 expression values (right). (H) PLCG1 protein expression in AML1-ETO positive (Kasumi-1, SKNO-1) vs AML1-ETO− human AML cell lines analyzed by intracellular flow cytometry (n = 5 per cell line; 1-way analysis of variance [ANOVA]). (I) Relapse-free survival (RFS, B) in patients with t(8;21) AML according to the expression level of PLCG1. Survival curves were estimated with the Kaplan-Meier method and compared using a log-rank test. (J) Scatterplot depicting PLCG1 expression levels in t(8;21) patients according to their relapse status (no relapse, n = 33; relapse, n = 27; unknown, n = 2).
Phospholipase C and Ca++ signaling is enriched in AML1-ETO transformed LSCs. (A) Outline of the proteomic workflow. (B) Gene set enrichment analysis (GSEA) on murine MLL-AF9 (MLL9) and AML1-ETO (AE) LSCs (n = 4 per genotype). (C) Ingenuity pathway analysis (IPA) on murine AML1-ETO transformed LSC compared with MLL-AF9 positive controls. (D) Schematic of proteome analysis of primary human AML1-ETO/t(8;21) AML (n = 4 per genotype). (E) Molecular analysis of AML patient samples applied for proteomic analysis. (F) GSEA on human t(8;21) AML compared with non-t(8;21) controls. (G) t-SNE plot displaying the gene expression landscape of 641 AML patients of the HOVON cohort19 with an overlay of different AML subtypes (left) with absolute PLCG1 expression values (right). (H) PLCG1 protein expression in AML1-ETO positive (Kasumi-1, SKNO-1) vs AML1-ETO− human AML cell lines analyzed by intracellular flow cytometry (n = 5 per cell line; 1-way analysis of variance [ANOVA]). (I) Relapse-free survival (RFS, B) in patients with t(8;21) AML according to the expression level of PLCG1. Survival curves were estimated with the Kaplan-Meier method and compared using a log-rank test. (J) Scatterplot depicting PLCG1 expression levels in t(8;21) patients according to their relapse status (no relapse, n = 33; relapse, n = 27; unknown, n = 2).
PLCG1 is a target of AML1-ETO
To clarify whether high expression of PLCG1 in AE-AML could be induced by AML1-ETO, we analyzed AML1-chromatin immunoprecipitation (ChIP) sequencing data from AE+ SKNO-1 cells, non-AE cell line (K562), and normal human CD34+ cells (https://genome.ucsc.edu). Here, binding of AML1 could exclusively be detected at the PLCG1 promoter region in SKNO-1 cells (Figure 2A). To understand the mechanism of PLCG1 induction, we analyzed DNaseI hypersensitive site (DHS) and promoter-Capture Hi-C (CHi-C) data generated in Kasumi-1 cells, a well characterized and widely used model system for t(8;21) AML,20-23 in the presence (siMM; CTRL) or absence (siAE; shAE) of AML1-ETO and compared them with data generated from patient cells24 (Figure 2B). The CHi-C data identified large numbers of DHSs interacting with the PLCG1 promoter forming an extensive regulatory domain extending far upstream into the neighboring locus and beyond. AE knockdown led to a reduction of PLCG1 expression as measured by RNA-Seq (Figure 2B). Consistent with these findings, inactivation of AE by RNAi in SKNO-1 and Kasumi-1 cells resulted in significant decrease of PLCG1 expression (Figure 2C).
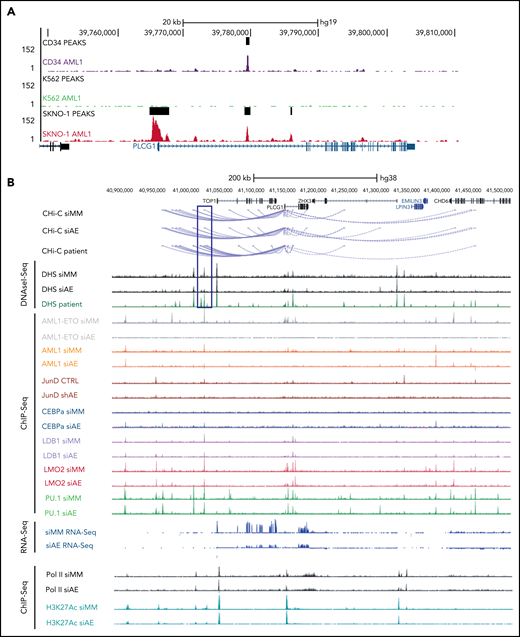
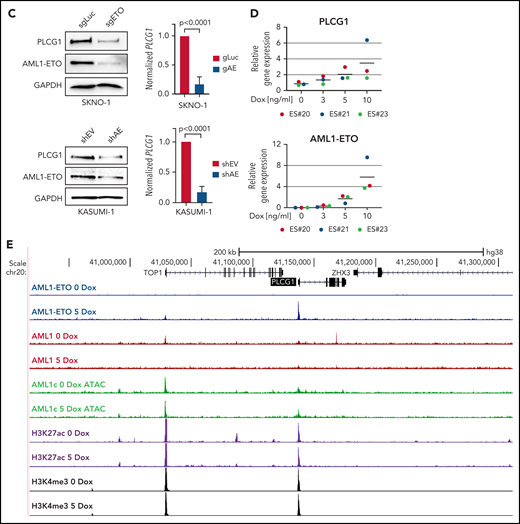
PLCG1 is a target of AML1-ETO. (A) AML1 ChIP-sequencing analysis on normal CD34+ cells, (BCR-ABL+) K562, and (AML1-ETO+) SKNO-1 cells (https://genome.ucsc.edu). (B) Screenshot displaying changes in PLCG1 transcript levels based on RNA-sequencing (RNA-Seq, blue). Binding patterns of AML1-ETO (AE), AML1, JunD, CEBPa, LDB1, LMO2, PU.1, RNA-polymerase II (POLII), H3K27ac, and DHS at the PLCG1 locus in Kasumi-1 or patient-derived cells based on ChIP-sequencing and DNaseI-sequencing as well as conservation at the PLCG1 locus as aligned reads. Upper lines show promoter-Capture Hi-C (CHi-C) data generated in Kasumi-1 or patient-derived cells identifying DHSs interacting with the PLCG1 promoter. All data following inactivation of AML1-ETO (siAE; shAE) compared with nontargeting control (siMM; CTRL).22-25 (C) Western blot analysis (left) and mRNA expression (right) in SKNO-1_Cas9-Blast cells (top) following CRISPR/Cas9 knockout using ETO-specific gRNA or a nontargeting control (sgLuc) and in Kasumi-1 cells (bottom) transduced with shRNA targeting AML1-ETO (AE) or empty vector control (shEV). n = 3 independent experiments; representative blot images are shown. (D) mRNA expression of PLCG1 (top) and AML1-ETO (bottom) in human embryonic stem (ES) cell-derived definitive hematopoietic progenitors expressing a Dox-inducible AML1-ETO fusion (data from 3 independent ES cell clones are shown). (E) Human ES-cell derived definitive hematopoietic progenitors expressing a Dox-inducible AML1-ETO fusion. ChIP-seq analysis displaying AML1-ETO binding at the PLCG1 locus (blue) without Dox (0 Dox) and after Dox treatment (5 ng/mL; 5 Dox) for 24 hours. Chromatin accessibility at the PLCG1 locus (green) after Dox treatment as indicated by ATAC-seq.
PLCG1 is a target of AML1-ETO. (A) AML1 ChIP-sequencing analysis on normal CD34+ cells, (BCR-ABL+) K562, and (AML1-ETO+) SKNO-1 cells (https://genome.ucsc.edu). (B) Screenshot displaying changes in PLCG1 transcript levels based on RNA-sequencing (RNA-Seq, blue). Binding patterns of AML1-ETO (AE), AML1, JunD, CEBPa, LDB1, LMO2, PU.1, RNA-polymerase II (POLII), H3K27ac, and DHS at the PLCG1 locus in Kasumi-1 or patient-derived cells based on ChIP-sequencing and DNaseI-sequencing as well as conservation at the PLCG1 locus as aligned reads. Upper lines show promoter-Capture Hi-C (CHi-C) data generated in Kasumi-1 or patient-derived cells identifying DHSs interacting with the PLCG1 promoter. All data following inactivation of AML1-ETO (siAE; shAE) compared with nontargeting control (siMM; CTRL).22-25 (C) Western blot analysis (left) and mRNA expression (right) in SKNO-1_Cas9-Blast cells (top) following CRISPR/Cas9 knockout using ETO-specific gRNA or a nontargeting control (sgLuc) and in Kasumi-1 cells (bottom) transduced with shRNA targeting AML1-ETO (AE) or empty vector control (shEV). n = 3 independent experiments; representative blot images are shown. (D) mRNA expression of PLCG1 (top) and AML1-ETO (bottom) in human embryonic stem (ES) cell-derived definitive hematopoietic progenitors expressing a Dox-inducible AML1-ETO fusion (data from 3 independent ES cell clones are shown). (E) Human ES-cell derived definitive hematopoietic progenitors expressing a Dox-inducible AML1-ETO fusion. ChIP-seq analysis displaying AML1-ETO binding at the PLCG1 locus (blue) without Dox (0 Dox) and after Dox treatment (5 ng/mL; 5 Dox) for 24 hours. Chromatin accessibility at the PLCG1 locus (green) after Dox treatment as indicated by ATAC-seq.
To examine the transcription factor complexes regulating PLCG1 and its response to AE knockdown, we integrated these data with published ChIP-sequencing data22,24,25 (Figure 2B). For the detection of AE binding, antibodies against the translocation partner ETO of the AML1-ETO fusion protein, which is usually not expressed in Kasumi-1 cells,25 were used. We also examined binding of the transcription factors LMO2 and LDB1, which form a complex with AE and is required for leukemogenesis,26 together with AML1 (RUNX1), the AML1-dependent transcription factors PU.1, C/EBPα, as well as polymerase II and H3K27 acetylation (H3K27ac). We also measured the binding of AP-1 (JUN/FOS) because the binding of this factor is strictly dependent on the presence of AE.23,25 By integrating ChIP-seq with DNaseI-seq and RNA-seq data before (siMM; CTRL) and after (siAE; shAE) AML1-ETO knockdown, we identified several AE-binding sites at the PLCG1 promoter as well as upstream (Figure 2B). Depletion of AE by RNAi resulted in decreased binding of AP-1, LMO2, reduction of polymerase II, and the H3K27 acetylation mark at the promoter and reduced expression of PLCG1 as seen by RNA-seq. C/EBPα was not recruited to the PLCG1 locus before knockdown but bound to an AML1-ETO, AML1, ETS, and AP-1 bound upstream element at −128 kb after depletion of AE (marked by a blue box). A detailed inspection of the enhancer sequence confirmed the presence of binding motifs for these listed factors together with several other motifs (supplemental Figure 3A-C). The response of AML1 binding to AML1-ETO knockdown was cis-element-specific: binding was reduced at the −128 kb DHS and at the promoter but was increased at a DHS upstream of the CHD6 gene that was not part of the PLCG1 regulatory unit (Figure 2B). Taken together, our analysis demonstrates that AML1-ETO cooperates with different transcription factors to sustain high level expression of PLGC1 in leukemic cells. To gain further insight into the role of AML1-ETO and to test whether induction of AML1-ETO was sufficient to activate PLCG1, we used a human ES cell differentiation model harboring a Dox-inducible AML1-ETO.14 Intriguingly, induction of AE expression in multipotent progenitors derived from 3 independent ES cell clones (Figure 2D, bottom) following exposure to Dox resulted in synchronous and gene-dosage dependent expression of PLCG1 (Figure 2D, top). Induction was accompanied by the binding of AML1-ETO to several preexisting nuclease accessible sites at the regulatory upstream element and the promoter (Figure 2E) as determined by ATAC-Seq. Before induction, these sites were also bound by AML1.
An intergenic AML1-ETO binding noncoding element is essential for PLCG1 expression
Our data from CHi-C experiments (Figure 2B) derived from Kasumi-123 and primary t(8;21) AML patient cells,24 identified several genomic regions contacting the PLCG1 promotor. The majority of the contacting genomic regions within a 200-kb range overlapped between Kasumi-1 and t(8;21) patient cells and were therefore considered specific contacts and thus enhancer candidates. To test the role of such elements in AML1-ETO–driven gene regulation, we performed CRISPR/Cas9 genome editing to excise the AE-bound 500-bp intergenic element at –128 kb that also bound p300 in Kasumi-1 and SKNO-1 cells (Figure 3A). Targeting of the defined 500-bp region using 5 different sgRNA pairs effectively reduced PLCG1 mRNA expression as compared with the nontargeting control (Figure 3B) and resulted in reduced colony numbers (Figure 3C) and size (supplemental Figure 4A) in methylcellulose. Bromodomain and extra-terminal (BET) inhibitors are known to disrupt BET proteins to acetylated histones as well as transcription factors27 and thereby prevent recruitment of RNA polymerase II to enhancer regions.28 Treatment of Kasumi-1 and SKNO-1 cells with the BET-inhibitor JQ1 (Figure 3D) or the selective, highly potent, and cell-permeable BET-degrader dBET6 (Figure 3E) resulted in significant reduction of PLCG1 expression. Likewise, pharmacologic p300 inhibition using Lys-CoA29 led to attenuation of PLCG1 expression (Figure 3F). Finally, we aimed to investigate whether high-level PLCG1 expression directly depends on specific transcription factors known to be required for the activation of cell-cycle regulators such as JUN, FOS, and CREB and that are also required for the leukemic activity of t(8;21) cells in vivo.24,25 CRISPR/Cas9-mediated genetic inactivation of JUN, FOS, and CREB resulted in significant reduction of PLCG1 mRNA (Figure 3G; supplemental Figure 4B) and protein expression (supplemental Figure 4C). Consistently, depletion of AML1-ETO resulted in reduced binding of JUN to the PLCG1 promotor in ChIP-seq experiments (Figure 3H). These data identify an AE-bound enhancer that is important for PCLG1 expression and provide conclusive evidence that AML1-ETO together with the signaling responsive factors AP-1 and CREB is required for the upregulation of this gene in AE cells.
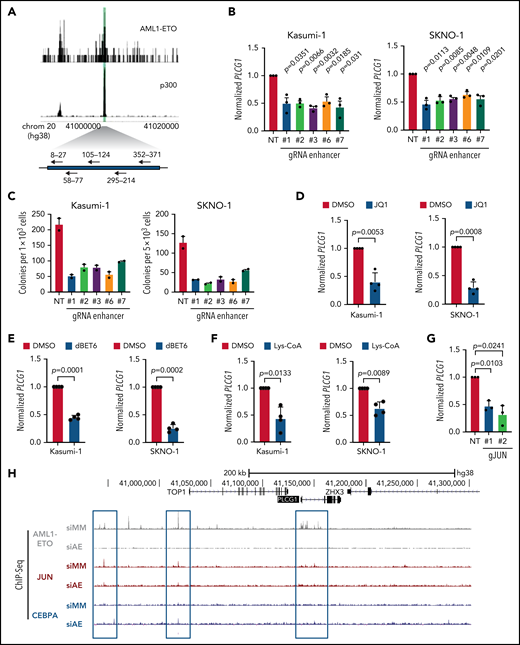
An intergenic AML1-ETO binding non-coding element is essential for PLCG1 expression. (A) Schematic model of the 500-bp intergenic element characterized by p300 and AML1-ETO binding sites (green) in Kasumi-1 cells. sgRNAs targeting this region are shown with arrows. (B) PLCG1 mRNA expression in Kasumi_Cas9-EGFP cells (left) and SKNO-1_Cas9-Blast cells (right) following CRISPR/Cas9-induced knockout of the 500-bp intergenic region using specific gRNAs or a nontargeting control (NT). n = 3 independent experiments, in duplicate; paired Student t test. (C) Colony-forming assay of Kasumi-1_Cas9_EGFP cells (left) and SKNO-1_Cas9-Blast cells (right) (day 14) following genetic inactivation of the 500-bp enhancer region using specific sgRNAs compared with nontargeting control (NT); n = 2 independent experiments. (D-F) mRNA expression of PLCG1 (normalized to Beta2-microglobulin) in Kasumi-1 and SKNO-1 cells after treatment with (D) JQ1 (1 μM, 24 hours), (E) dBET6 (1 μM, 24 hours), and (F) Lys-CoA (1 μM, 24 hours) compared with diluent control (DMSO). n = 4 independent experiments, in duplicate; paired t test. (G) mRNA expression of PLCG1 in Kasumi-1 cells after knockout of JUN using CRISPR/Cas9 (gJUN #1 and #2) or a nontargeting control (NT). n = 3 independent experiments, in triplicate; paired t test. (H) Screenshot displaying binding patterns of AML1-ETO, JUN, and CEBPa at the PLCG1 locus in Kasumi-1 cells based on ChIP-seq. All data following inactivation of AML1-ETO (siAE) compared with nontargeting control (siMM). Relevant peaks are highlighted with boxes.
An intergenic AML1-ETO binding non-coding element is essential for PLCG1 expression. (A) Schematic model of the 500-bp intergenic element characterized by p300 and AML1-ETO binding sites (green) in Kasumi-1 cells. sgRNAs targeting this region are shown with arrows. (B) PLCG1 mRNA expression in Kasumi_Cas9-EGFP cells (left) and SKNO-1_Cas9-Blast cells (right) following CRISPR/Cas9-induced knockout of the 500-bp intergenic region using specific gRNAs or a nontargeting control (NT). n = 3 independent experiments, in duplicate; paired Student t test. (C) Colony-forming assay of Kasumi-1_Cas9_EGFP cells (left) and SKNO-1_Cas9-Blast cells (right) (day 14) following genetic inactivation of the 500-bp enhancer region using specific sgRNAs compared with nontargeting control (NT); n = 2 independent experiments. (D-F) mRNA expression of PLCG1 (normalized to Beta2-microglobulin) in Kasumi-1 and SKNO-1 cells after treatment with (D) JQ1 (1 μM, 24 hours), (E) dBET6 (1 μM, 24 hours), and (F) Lys-CoA (1 μM, 24 hours) compared with diluent control (DMSO). n = 4 independent experiments, in duplicate; paired t test. (G) mRNA expression of PLCG1 in Kasumi-1 cells after knockout of JUN using CRISPR/Cas9 (gJUN #1 and #2) or a nontargeting control (NT). n = 3 independent experiments, in triplicate; paired t test. (H) Screenshot displaying binding patterns of AML1-ETO, JUN, and CEBPa at the PLCG1 locus in Kasumi-1 cells based on ChIP-seq. All data following inactivation of AML1-ETO (siAE) compared with nontargeting control (siMM). Relevant peaks are highlighted with boxes.
AML1-ETO–induced cellular functions depend on PLCG1
To assess the functional importance of PLCG1, we aimed to genetically inactivate PLCG1 in human AE leukemia. CRISPR/Cas9-mediated deletion (SKNO-1; Figure 4A; supplemental Figure 5A) or RNAi-mediated knockdown (Kasumi-1; Figure 4B; supplemental Figure 5B) of PLCG1 impaired their proliferative capacity. Of note, this effect could be attributed to impaired proliferation rather than induction of apoptosis (supplemental Figure 5C-D). Consistently, loss of PLCG1 reduced colony-forming unit capacity in vitro (Figure 4C-D) and PLCG1-deficient Kasumi-1 cells showed impaired leukemia development in vivo (Figure 4E). These results indicate a functional role of PLCG1 in the proliferative capacity of leukemic cells harboring the AE fusion. Moreover, genetic inactivation of PLCG1 resulted in increased expression of myeloid markers such as CD13 and CD14, suggesting induction of differentiation in both AE cell lines (Figure 4F-G). When examining the transcriptome of PLCG1-depleted Kasumi-1 cells, GSEA revealed a strong induction of gene sets related to myeloid differentiation consistent with the differentiation phenotype observed before. In contrast, we observed downregulation of gene sets linked to proliferation, stemness, and c-Myc targets (Figure 4H). Testing the PCLG1-knockdown signature against more than 10 000 gene sets from MSigDB30 revealed a remodeling of tumor cell metabolism with downregulation of gene sets involved in regulating the cell cycle, transcription, and splicing (supplemental Figure 5E). To investigate whether PLCG1 depletion would affect direct target genes of the AML1-ETO fusion gene, we next focused on genes that were directly bound and repressed by AML1-ETO in Kasumi-1 cells.22 Strikingly, these AML1-ETO–repressed genes were strongly upregulated upon PLCG1 knockdown (Figure 4I-J), indicating that PLCG1 loss reversed the gene expression signature imposed by the AML1-ETO fusion gene in human AML cells. Consistently, these findings could be recapitulated by CRISPR-mediated deletion of PLCG1 in SKNO-1 cells (Figure 4K).
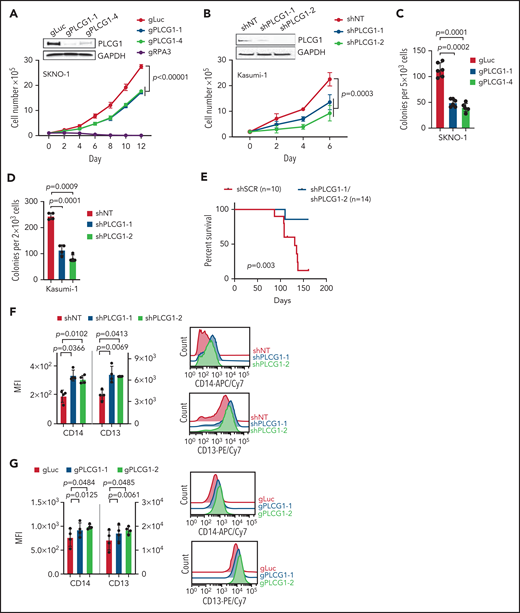
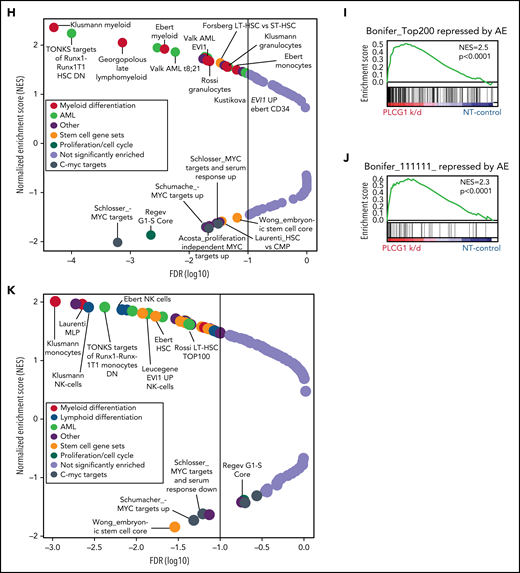
AML1-ETO–induced cellular functions depend on PLCG1. Proliferation assayed by cell counting after trypan blue exclusion for (A) SKNO-1_Cas9-Blast cells transduced with gRNAs targeting PLCG1, RPA3, or a nontargeting control (gLuc) and (B) Kasumi-1 cells transduced with shRNAs targeting PLCG1or a nontargeting control (shSCR). n = 4-5 independent experiments, 1-way ANOVA. Representative western blot images confirming PLCG1 depletion are shown (day 5 or 7 postinfection). Colony-forming unit analysis in (C) SKNO-1_Cas9-Blast and (D) Kasumi-1 cells on day 14. n = 4-6 independent experiments; paired Student t test. (E) Kaplan-Meier survival curves of humanized NSGS recipient mice, n = 14 mice for shPLCG1-1 or shPLCG1-2 vs n = 10 mice for nontargeting control (shSCR); shown are 3 independent cohorts, Mantel-Cox test. (F-G) Quantitative analysis (left) and representative histograms (right) after flow-cytometric evaluation of CD14 and CD13 expression on (F) Kasumi-1 cells transduced with shRNAs targeting PLCG1or a nontargeting control (shSCR) and (G) SKNO-1_Cas9-Blast cells transduced with gRNAs targeting PLCG1 or a nontargeting control (gLuc). n = 4 independent experiments; paired t test. (H) GSEA of expression changes in 160 hematopoiesis and leukemia-associated gene sets in Kasumi-1 cells transduced with a PLCG1 shRNA (sh1-1) against a nontargeting control (n = 4 for each group). Plotted are normalized enrichment scores (NES) against the log10 false discovery rate (FDR). FDR <0.1 is indicated by the vertical line. (I-J) GSEA showing upregulation of genes bound and repressed by the AML1-ETO fusion protein in Kasumi-1 cells transduced with a PLCG1 shRNA against a nontargeting control. (K) GSEA of expression changes in 160 hematopoiesis and leukemia-associated gene sets in SKNO-1_Cas9-Blast cells transduced with a PLCG1 sgRNA against a nontargeting control (n = 4 for each group). Plotted are normalized enrichment scores (NES) against the log10 FDR. FDR <0.1 is indicated by the vertical line.
AML1-ETO–induced cellular functions depend on PLCG1. Proliferation assayed by cell counting after trypan blue exclusion for (A) SKNO-1_Cas9-Blast cells transduced with gRNAs targeting PLCG1, RPA3, or a nontargeting control (gLuc) and (B) Kasumi-1 cells transduced with shRNAs targeting PLCG1or a nontargeting control (shSCR). n = 4-5 independent experiments, 1-way ANOVA. Representative western blot images confirming PLCG1 depletion are shown (day 5 or 7 postinfection). Colony-forming unit analysis in (C) SKNO-1_Cas9-Blast and (D) Kasumi-1 cells on day 14. n = 4-6 independent experiments; paired Student t test. (E) Kaplan-Meier survival curves of humanized NSGS recipient mice, n = 14 mice for shPLCG1-1 or shPLCG1-2 vs n = 10 mice for nontargeting control (shSCR); shown are 3 independent cohorts, Mantel-Cox test. (F-G) Quantitative analysis (left) and representative histograms (right) after flow-cytometric evaluation of CD14 and CD13 expression on (F) Kasumi-1 cells transduced with shRNAs targeting PLCG1or a nontargeting control (shSCR) and (G) SKNO-1_Cas9-Blast cells transduced with gRNAs targeting PLCG1 or a nontargeting control (gLuc). n = 4 independent experiments; paired t test. (H) GSEA of expression changes in 160 hematopoiesis and leukemia-associated gene sets in Kasumi-1 cells transduced with a PLCG1 shRNA (sh1-1) against a nontargeting control (n = 4 for each group). Plotted are normalized enrichment scores (NES) against the log10 false discovery rate (FDR). FDR <0.1 is indicated by the vertical line. (I-J) GSEA showing upregulation of genes bound and repressed by the AML1-ETO fusion protein in Kasumi-1 cells transduced with a PLCG1 shRNA against a nontargeting control. (K) GSEA of expression changes in 160 hematopoiesis and leukemia-associated gene sets in SKNO-1_Cas9-Blast cells transduced with a PLCG1 sgRNA against a nontargeting control (n = 4 for each group). Plotted are normalized enrichment scores (NES) against the log10 FDR. FDR <0.1 is indicated by the vertical line.
AML1-ETO transformed cells depend on PLCG1
To understand the role of PLCG1 signaling in AE-LSCs, we had previously generated a knockout mouse model3 (Figure 5A; supplemental Figure 6A) that allows conditional deletion of Plcg1. We used an oncogenic combination of AML1-ETO9a (AE) and mutated RAS (KRASG12D; K) (thereafter AE/K), which is clinically relevant1 and results in a more aggressive phenotype.31 Genetic deletion of Plcg1 AE/K-LSCs (GFP+ LSK) by retroviral Cre expression (Figure 5B) resulted in reduced colony formation and abrogated the AE-induced unlimited replating capacity in vitro (Figure 5C). Consistently, genetic deletion of Plcg1 in AE/K-LSCs impaired leukemia development in secondary recipient hosts (Figure 5D-E). In contrast, deletion of Plcg1 in MLL-AF9 (MA9) transformed LSKs did not affect colony formation and replating capacity to a major extent (Figure 5F), indicating a specific requirement of Plcg1 in AE-transformed LSC. Genetic deletion of Plcg1 resulted in loss of stemness-associated genes in AML LSCs (eg, HOXA genes, MECOM) and induction of a differentiation-associated signature (Figure 5G). GSEA confirmed loss of AE target genes and PLCG1 target genes identified in this analysis were negatively enriched in the AE-knockdown signature of Kasumi-1 cells (Figure 5H). Consistently, inactivation of Plcg1 by RNAi in primary AE-transformed murine progenitors resulted in decreased colony numbers, induction of differentiation and limited replating capacity in methylcellulose (supplemental Figure 6B-D).
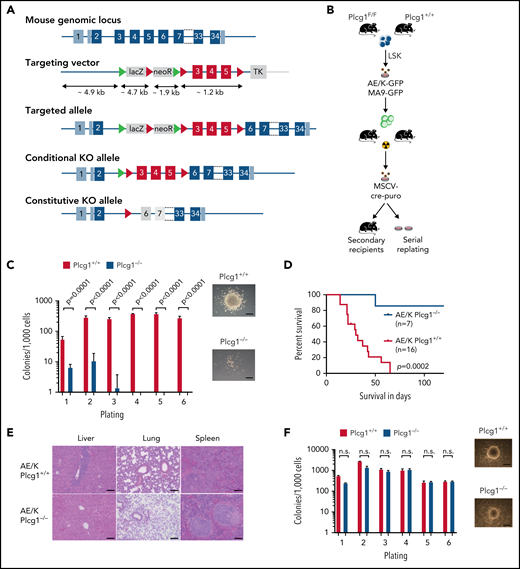
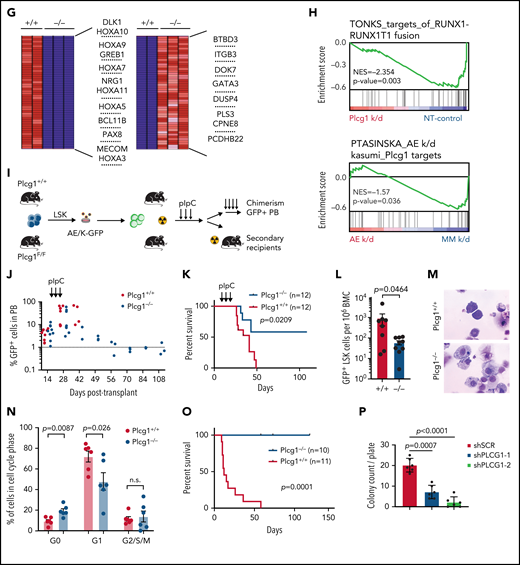
AML1-ETO transformed hematopoietic stem cells depend on PLCG1. (A) Targeting strategy for the conditional Plcg1 knockout mouse model. Exons 3 to 5 are flanked with LoxP sites (red triangles) to facilitate tissue-specific deletion. FRT sites, green triangles. (B-F) GFP+Kit+ BM cells of Plcg1+/+ and Plcg1F/F AML1-ETO/KRAS (AE/K) or MLL-AF9 (MA9) primary recipients were sorted and retrovirally infected with a Cre-recombinase (MSCV-Cre-puro), followed by 24 hours of puromycin selection. (C) Serial replating in methylcellulose. Colony counts per plating over 6 weeks are depicted for AML1-ETO/KRAS. Representative pictures of colonies (second plating). n = 3 independent experiments, in duplicate; paired t test. (D) Kaplan-Meier survival curves of recipient animals of AE/K transformed Plcg1+/+ (n = 16 mice) vs Plcg1−/− (n = 7 mice) LSCs, Mantel-Cox test. (E) Histologic analysis of liver, lung, and spleen morphology in Plcg1+/+ or Plcg1−/− AML1-ETO9a/KRAS (AE/K) transformed secondary recipients. Representative images are shown. Scale bars, 100 μm. (F) Serial replating in methylcellulose. Colony counts per plating over 6 weeks are depicted for MLL-AF9. Representative pictures of colonies (second plating). n = 3 independent experiments, in duplicate; paired t test. (G) Heatmap of differentially expressed genes in AE/KRAS transformed Plcg1+/+ (n = 2) vs Plcg1−/− (n = 3) LSCs 48 hours after genetic deletion of Plcg1. Red zones represent higher gene expression (upregulation); blue zones represent lower gene expression (downregulation). (H) GSEA indicating loss of AML1-ETO (RUNX1-RUNX1T1) target genes (top) and negative enrichment of PLCG1 target genes (bottom) in the AML1-ETO knockdown signature of Kasumi-1 cells. AE, AML1-ETO; k/d, knockdown; MM, mismatch control; NES, normalized enrichment score; NT, nontargeting control. (I) Schematic representation of the experimental setup to study the effects of Plcg1 inactivation on AML1-ETO/KRAS (AE/K)-transformed LSCs in vivo. (J) Analysis of sublethally (7 Gy) irradiated 6- to 8-week-old primary recipients of AE/K-transformed Plcg1+/+ and Plcg1F/F LSK cells. pIpC injections were administered intraperitoneally as indicated by arrows. Immunophenotyping of (GFP+) leukemia cells in peripheral blood of primary recipient mice. Plcg1+/+ (n = 9 mice) vs Plcg1−/− (n = 9 mice). (K) Survival of primary recipient mice. Plcg1+/+ (n = 12 mice) vs Plcg1−/− (n = 12 mice). Mantel-Cox test. (L) Immunophenotyping of GFP+ bone marrow (BM) LSKs (Plcg1+/+ n = 8 mice, Plcg1−/− n = 9 mice; Mann-Whitney U test. (M) Cytospins (May-Grünwald/Giemsa staining) of GFP+ LSK cells following short-term (24-hour) culture ex vivo. (N) Cell-cycle analysis (Ki67/Hoechst staining) of GFP+ LSK cells from primary recipient mice following genetic inactivation of Plcg1 in vivo (Plcg1+/+, n = 6 mice vs Plcg1−/−, n = 6 mice; Mann-Whitney U test). (O) Kaplan-Meier survival curves of secondary recipients of 2 × 10⁶ BM cells from primary Plcg1+/+ (n = 11) and Plcg1−/− (n = 10) recipient mice, Mantel-Cox test. (P) Colony formation of leukemic bone marrow cells derived from patients at primary diagnosis of t(8;21) positive AML (n = 6 individual patients). Colony number following PLCG1 depletion by RNAi (shPLCG1-1 and 1-2) compared with nontargeting control (shSCR).
AML1-ETO transformed hematopoietic stem cells depend on PLCG1. (A) Targeting strategy for the conditional Plcg1 knockout mouse model. Exons 3 to 5 are flanked with LoxP sites (red triangles) to facilitate tissue-specific deletion. FRT sites, green triangles. (B-F) GFP+Kit+ BM cells of Plcg1+/+ and Plcg1F/F AML1-ETO/KRAS (AE/K) or MLL-AF9 (MA9) primary recipients were sorted and retrovirally infected with a Cre-recombinase (MSCV-Cre-puro), followed by 24 hours of puromycin selection. (C) Serial replating in methylcellulose. Colony counts per plating over 6 weeks are depicted for AML1-ETO/KRAS. Representative pictures of colonies (second plating). n = 3 independent experiments, in duplicate; paired t test. (D) Kaplan-Meier survival curves of recipient animals of AE/K transformed Plcg1+/+ (n = 16 mice) vs Plcg1−/− (n = 7 mice) LSCs, Mantel-Cox test. (E) Histologic analysis of liver, lung, and spleen morphology in Plcg1+/+ or Plcg1−/− AML1-ETO9a/KRAS (AE/K) transformed secondary recipients. Representative images are shown. Scale bars, 100 μm. (F) Serial replating in methylcellulose. Colony counts per plating over 6 weeks are depicted for MLL-AF9. Representative pictures of colonies (second plating). n = 3 independent experiments, in duplicate; paired t test. (G) Heatmap of differentially expressed genes in AE/KRAS transformed Plcg1+/+ (n = 2) vs Plcg1−/− (n = 3) LSCs 48 hours after genetic deletion of Plcg1. Red zones represent higher gene expression (upregulation); blue zones represent lower gene expression (downregulation). (H) GSEA indicating loss of AML1-ETO (RUNX1-RUNX1T1) target genes (top) and negative enrichment of PLCG1 target genes (bottom) in the AML1-ETO knockdown signature of Kasumi-1 cells. AE, AML1-ETO; k/d, knockdown; MM, mismatch control; NES, normalized enrichment score; NT, nontargeting control. (I) Schematic representation of the experimental setup to study the effects of Plcg1 inactivation on AML1-ETO/KRAS (AE/K)-transformed LSCs in vivo. (J) Analysis of sublethally (7 Gy) irradiated 6- to 8-week-old primary recipients of AE/K-transformed Plcg1+/+ and Plcg1F/F LSK cells. pIpC injections were administered intraperitoneally as indicated by arrows. Immunophenotyping of (GFP+) leukemia cells in peripheral blood of primary recipient mice. Plcg1+/+ (n = 9 mice) vs Plcg1−/− (n = 9 mice). (K) Survival of primary recipient mice. Plcg1+/+ (n = 12 mice) vs Plcg1−/− (n = 12 mice). Mantel-Cox test. (L) Immunophenotyping of GFP+ bone marrow (BM) LSKs (Plcg1+/+ n = 8 mice, Plcg1−/− n = 9 mice; Mann-Whitney U test. (M) Cytospins (May-Grünwald/Giemsa staining) of GFP+ LSK cells following short-term (24-hour) culture ex vivo. (N) Cell-cycle analysis (Ki67/Hoechst staining) of GFP+ LSK cells from primary recipient mice following genetic inactivation of Plcg1 in vivo (Plcg1+/+, n = 6 mice vs Plcg1−/−, n = 6 mice; Mann-Whitney U test). (O) Kaplan-Meier survival curves of secondary recipients of 2 × 10⁶ BM cells from primary Plcg1+/+ (n = 11) and Plcg1−/− (n = 10) recipient mice, Mantel-Cox test. (P) Colony formation of leukemic bone marrow cells derived from patients at primary diagnosis of t(8;21) positive AML (n = 6 individual patients). Colony number following PLCG1 depletion by RNAi (shPLCG1-1 and 1-2) compared with nontargeting control (shSCR).
PLCG1 is required for maintenance of AML1-ETO LSCs but is dispensable for normal HSC function
To experimentally confirm our previous findings and to assess the requirement for PLCG1 in maintenance of AE-LSCs in vivo, we injected unexcised AE/K-transformed Plcg1F/F Mx-Cre+ and Plcg1+/+ Mx-Cre+ leukemic cells into sublethally irradiated recipient hosts and monitored GFP+ cells at serial time points after transplantation (Figure 5I). By day 14 (and before Cre induction by pIpC injection), equal abundance of GFP+ cells indicated comparable homing and engraftment of leukemic cells (Figure 5J). Following pIpC injection, the total number of AE/K Plcg1+/+ cells in each recipient mouse had increased until overt and lethal leukemia developed. Conversely, Plcg1 deletion resulted in loss of leukemia development in 50% of recipient hosts and leukemic cells decreased below 1% in the peripheral blood until day 110 (Figure 5K). Overall, deletion of Plcg1 resulted in significant reduction of disease penetrance and LSC numbers (GFP+ LSK cells; Figure 5L). Isolated LSCs from these animals revealed induction of differentiation (Figure 5M), loss of cell-cycle activity (Figure 5N), and failure to reestablish disease in secondary recipient hosts (Figure 5O). Likewise, primary human t(8;21) AML cells showed impaired colony-forming capacity following PLCG1 inactivation in vitro (Figure 5P; supplemental Figure 6E). In contrast, genetic deletion of Plcg1 (Figure 6A) appeared to be dispensable for steady-state hematopoiesis regarding peripheral blood counts (Figure 6B) and immunophenotypic abundance of BM compartments at week 20 (Figure 6C-D). Likewise, normal murine HSC function was not impaired during serial transplantation as indicated by peripheral blood chimerism of primary and secondary recipient hosts (Figure 6E-I) and the abundance of HSPCs as determined in the BM of primary recipient hosts (Figure 6G-H). Consistently colony forming capacity of human HSC-enriched CD34+ BM cells was preserved in 3/5 and partially reduced in 2/5 donors (Figure 6J).
The fact that LSC with higher cell-cycle activity than normal HSCs were sensitive to Plcg1 inhibition raised the possibility that these cells might exhaust faster under stress conditions. To address this question without using the transplantation system, we evaluated hematopoietic recovery and survival after serial injections of 5-fluorouracil (5-FU). When 5-FU was injected every 7 days to achieve depletion of regenerating progenitor cells, both wild-type and Plcg1-deficient mice displayed similar survival rates, with the majority of deaths occurring in weeks 4 and 5 (Figure 6K). When 5-FU was injected every second month to allow complete recovery of hematopoiesis, Plcg1-deficient mice showed a trend toward lower restoration of myeloid cells (Figure 6L) and decreased long-term survival (Figure 6M) only when stress is applied over several month. Together, these functional experiments demonstrate that AE but neither MA9-driven LSCs nor normal (steady-state) HSCs depend on PLCG1 to maintain their self-renewal capacity.
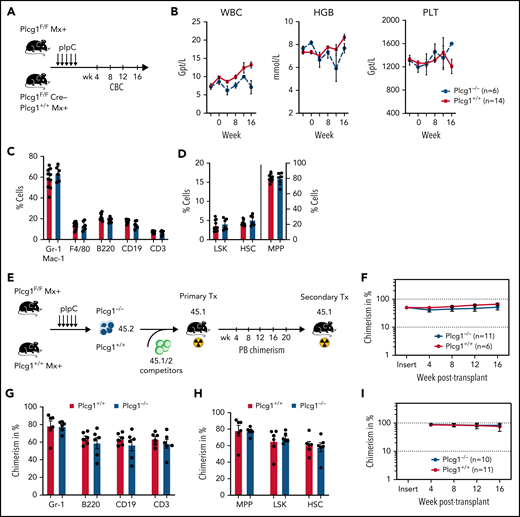
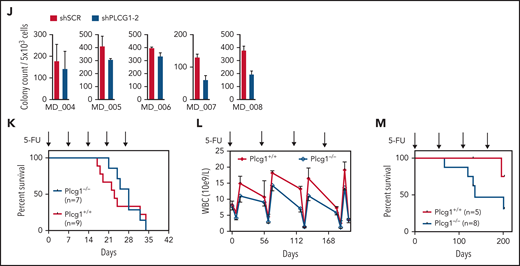
PLCG1 is dispensable for normal HSC function. (A) Experimental protocol for investigation of steady-state hematopoiesis. (B) White blood count (WBC), hemoglobin (HGB), and platelets (PLT) following genetic inactivation of Plcg1 (Plcg1−/−, n = 6) for 16 weeks of steady-state hematopoiesis, compared with Plcg1+/+ controls (n = 14). (C) Immunophenotypic quantification of mature myeloid (Gr-1 Mac-1; F4/80), B-lymphoid (B220; CD19), and T-lymphoid (CD3) bone marrow cells (Plcg1+/+, n = 10; Plcg1−/−, n = 6). (D) Immunophenotypic quantification of stem and progenitor cell abundance, specifically of hematopoietic stem cells (HSC: CD150+ CD48− L−S+K+) and multipotent progenitors (MPP: CD150 low, CD48+ L−S+K+) (Plcg1+/+, n = 10; Plcg1−/−, n = 6). (E) Protocol for assessing impact of Plcg1 loss on LT-HSC function by serial transplantation. (F) Peripheral blood chimerism of primary recipient mice (Plcg1+/+, n = 6; Plcg1−/−, n = 11); shown are 2 independent cohorts. (G) Immunophenotypic quantification of mature myeloid (Gr-1), B-lymphoid (B220; CD19), and T-lymphoid (CD3) bone marrow cells (Plcg1+/+, n = 6; Plcg1−/−, n = 6) from primary recipients. (H) Immunophenotypic quantification of stem and progenitor cell abundance, specifically of hematopoietic stem cells (HSC: CD150+ CD48− L−S+K+) and multipotent progenitors (MPP: CD150 low, CD48+ L−S+K+) (Plcg1+/+, n = 6; Plcg1−/−, n = 6). (I) Peripheral blood chimerism of secondary recipient mice (Plcg1+/+, n = 10; Plcg1−/−, n = 11); shown are 2 independent cohorts. (J) Colony count of BM cells derived from healthy donors. Genetic inactivation of PLCG1 by shRNA compared with nontargeting control (shSCR). n = 5, in duplicate. (K) Short-term stress analysis after serial 5-fluorouracil (5-FU) injections; Kaplan-Meier survival curve of Plcg1+/+ (n = 9) and Plcg1−/− (n = 7) mice injected intravenously (i.v.) with 150 mg/kg 5-FU (arrows) every 7 days. (L) Long-term stress analysis by serial 5-FU injections (2 monthly injections IV). Kinetics of hematopoietic recovery as measured by peripheral white blood count of Plcg1−/− (n = 8) and Plcg1+/+ (n = 5) mice during the 2 monthly 5-FU injection schedule. (M) Survival rates of Plcg1−/− (n = 8) and Plcg1+/+ (n = 5) mice during long-term 5-FU treatment.
PLCG1 is dispensable for normal HSC function. (A) Experimental protocol for investigation of steady-state hematopoiesis. (B) White blood count (WBC), hemoglobin (HGB), and platelets (PLT) following genetic inactivation of Plcg1 (Plcg1−/−, n = 6) for 16 weeks of steady-state hematopoiesis, compared with Plcg1+/+ controls (n = 14). (C) Immunophenotypic quantification of mature myeloid (Gr-1 Mac-1; F4/80), B-lymphoid (B220; CD19), and T-lymphoid (CD3) bone marrow cells (Plcg1+/+, n = 10; Plcg1−/−, n = 6). (D) Immunophenotypic quantification of stem and progenitor cell abundance, specifically of hematopoietic stem cells (HSC: CD150+ CD48− L−S+K+) and multipotent progenitors (MPP: CD150 low, CD48+ L−S+K+) (Plcg1+/+, n = 10; Plcg1−/−, n = 6). (E) Protocol for assessing impact of Plcg1 loss on LT-HSC function by serial transplantation. (F) Peripheral blood chimerism of primary recipient mice (Plcg1+/+, n = 6; Plcg1−/−, n = 11); shown are 2 independent cohorts. (G) Immunophenotypic quantification of mature myeloid (Gr-1), B-lymphoid (B220; CD19), and T-lymphoid (CD3) bone marrow cells (Plcg1+/+, n = 6; Plcg1−/−, n = 6) from primary recipients. (H) Immunophenotypic quantification of stem and progenitor cell abundance, specifically of hematopoietic stem cells (HSC: CD150+ CD48− L−S+K+) and multipotent progenitors (MPP: CD150 low, CD48+ L−S+K+) (Plcg1+/+, n = 6; Plcg1−/−, n = 6). (I) Peripheral blood chimerism of secondary recipient mice (Plcg1+/+, n = 10; Plcg1−/−, n = 11); shown are 2 independent cohorts. (J) Colony count of BM cells derived from healthy donors. Genetic inactivation of PLCG1 by shRNA compared with nontargeting control (shSCR). n = 5, in duplicate. (K) Short-term stress analysis after serial 5-fluorouracil (5-FU) injections; Kaplan-Meier survival curve of Plcg1+/+ (n = 9) and Plcg1−/− (n = 7) mice injected intravenously (i.v.) with 150 mg/kg 5-FU (arrows) every 7 days. (L) Long-term stress analysis by serial 5-FU injections (2 monthly injections IV). Kinetics of hematopoietic recovery as measured by peripheral white blood count of Plcg1−/− (n = 8) and Plcg1+/+ (n = 5) mice during the 2 monthly 5-FU injection schedule. (M) Survival rates of Plcg1−/− (n = 8) and Plcg1+/+ (n = 5) mice during long-term 5-FU treatment.
Pharmacologic perturbation of Ca++-signaling inhibits AML1-ETO LSC function
To date, no specific inhibitors of PLCG1 are available. To assess for relevant cellular functions that depend on PLCG1 in AE transformed cells, we performed in-depth proteomic analysis. PLCG1 was genetically deleted in AE+ SKNO-1 cells and global proteome was assessed following puromycin selection. We quantified hundreds of significantly differentially expressed proteins depending on the presence or absence of PLCG1. In particular, loss of PLCG1 significantly downregulated 412 proteins (Figure 7A; supplemental Figure 7A). GSEA identified cell signaling and specifically Ca++ signaling as relevant downstream functions affected by PLCG1 loss (Figure 7B). Consistently, previous reports32 had suggested a functional relevance of PLCG1 for modulation of intracellular Ca++ homeostasis in hematopoietic and leukemic cells. Therefore, we aimed to confirm the effects of Ca++ signaling perturbation on AE-leukemia. First, we tested the efficacy of cyclosporin A (CsA), a clinically approved calcineurin inhibitor that blocks intracellular Ca++ release and activation of Ca++-dependent transcription programs33 on leukemic cell lines. Here, Kasumi-1 and SKNO-1 cells showed significantly reduced proliferation upon CsA-treatment compared with non-AE cell lines HL-60 and OCI-AML3 (Figure 7C). To assess for AE-LSC function in vivo, we treated primary leukemic mice with established AE/K- or MA9-driven leukemia with CsA for 3 weeks (Figure 7D). Mice with established AE-leukemia showed reduction in total leukemic burden (Figure 7E-F; supplemental Figure 7B) and LSC numbers (Figure 7G). This reduction resulted in delayed disease onset and increased survival of secondary recipients hosts (Figure 7H). Notably, these effects could not be observed in MA9-driven leukemia (Figure 7I-L; supplemental Figure 7C), indicating specificity of this dependency for the AE fusion. To determine the functional abundance of LSCs and the leukemia initiating potential, we performed limiting dilution assays by injecting immunocompromised recipient mice with limiting numbers (1 × 10⁵, 1 × 10⁴, 1 × 10³) of drug/diluent exposed GFP+ leukemic bone marrow cells. CsA-exposed cells showed profound reduction in LSC frequency compared with diluent-treated controls (Figure 7M-N; supplemental Figure 7D). Likewise, CsA-treated primary human AE+ AML blasts showed strong reduction in colony formation in methylcellulose (Figure 7O-P; supplemental Figure 7E), an effect that could not be observed with normal HSPCs derived from healthy donors (Figure 7Q) or other AML subtypes (supplemental Figure 7F-G). Consistently, in vivo treatment of primary human AE-leukemic cells in humanized mouse models resulted in reduced engraftment potential (Figure 7R-S; supplemental Figure 7H). Thus, pharmacologic perturbation of Ca++ signaling by CsA targets the AE-LSC compartment that is critical for development and maintenance of AE-AML.
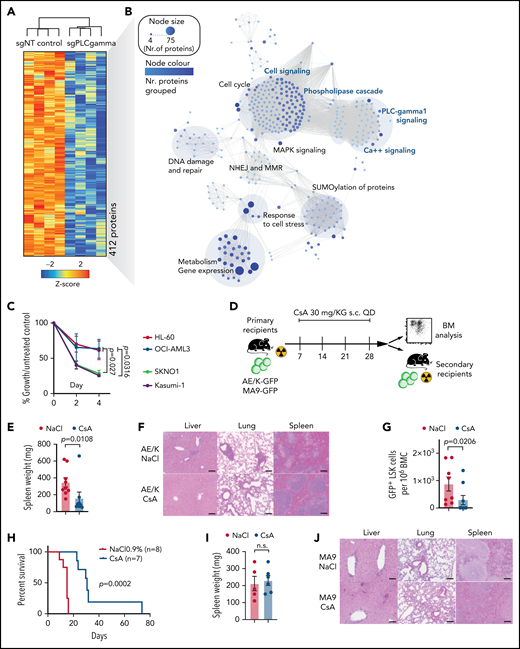
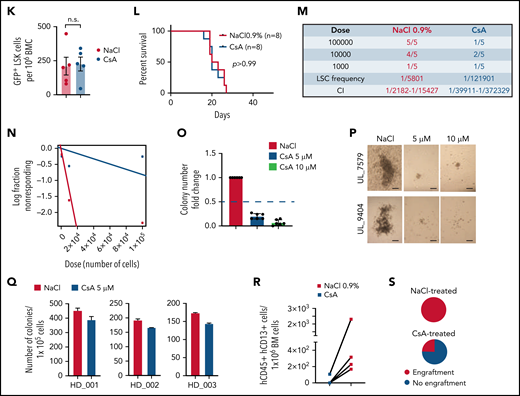
Pharmacologic suppression of Ca++-signaling inhibits AML1-ETO LSC function in vitro and in vivo. (A) Unsupervised hierarchical clustering of significantly downregulated proteins following genetic inactivation of PLCG1 by a specific gRNA in SKNO-1_Cas9-Blast cells. (B) Network map displaying the significantly enriched signaling pathways upon genetic inactivation of PLCG1, annotation from Reactome. The node size and color represent number of proteins participating in each node. (C) Proliferation assayed by cell counting after trypan blue exclusion for Kasumi-1, SKNO-1, HL-60, and OCI-AML3 cells following treatment with the calcineurin inhibitor cyclosporin A (CsA, 5 μM) or diluent control (NaCl 0.9%). n = 4 independent experiments, 1-way ANOVA. (D) Analysis scheme of primary recipient mice following ciclosporin A (CsA) treatment vs diluent control (NaCl 0.9%). (E) Spleen weight of AE/K primary recipient mice; Mann-Whitney U test. (F) Histologic analysis of liver, lung, and spleen morphology after onset of AML in AE/K primary recipient mice treated with CsA or diluent control (NaCl 0.9%). Scale bars, 100 μm. (G) Immunophenotypic analysis of AE/K GFP+ BM LSK cells; Mann-Whitney U test. (H) Kaplan-Meier survival curves of AE/K secondary recipient mice. Irradiated (13 Gy, single dose) 6- to 8-week-old recipients of 2 × 10⁶ bone marrow cells from AE/K CsA (n = 7) or NaCl 0.9% (n = 8) treated primary recipients; Mantel-Cox test. (I) Spleen weight of MA9 primary recipient mice treated with CsA or diluent control (NaCl 0.9%), n.s., not significant. (J) Histologic analysis of liver, lung, and spleen morphology after onset of AML in MA9 primary recipient mice after treatment with CsA or diluent control. Scale bars, 100 μm. (K) Immunophenotypic analysis of GFP+LSK cells in the bone marrow of MA9 primary recipient mice. (L) Survival of MA9-transformed secondary recipient mice. Irradiated (13 Gy, single dose) 6- to 8-week-old recipients of 2 × 10⁶ bone marrow cells from MA9 CsA or NaCl 0.9% treated primary recipient mice (n = 8 CsA; n = 8 NaCl 0.9%), Mantel-Cox test. (M-N) Number of engrafted mice per dilution in the NaCl- vs CsA-treated cohort. LSC frequency was 1/5801 for NaCl-treated recipients (95% confidence interval, 1/2182-15,427) and 1/12,1901 for CsA-treated recipients (95% confidence interval, 1/39,911-372,329), P = .000026 using Poisson analysis; n = 5 mice per dilution and treatment, analysis was performed using ELDA (Extreme Limiting Dilution Assay) software.44 (O) Colony formation of primary human AE/t(8;21) AML cells (n = 6 individual patients). Colony number per sample following pharmacologic inhibition with CsA (5, 10 μM) compared with diluent control (NaCl 0.9%). (P) Representative pictures of colonies from t(8;21) AML bone marrow cells after pharmacological inhibition with cyclosporin A compared with diluent control (NaCl). Scale bars, 200 μm. (Q) Colony count of BM cells derived from 3 independent healthy donors. Colony number per sample following pharmacologic inhibition with CsA (5 μM) compared with diluent control (NaCl 0.9%). (R) Number of hCD4+ hCD13+ cells per 1 × 10⁶ bone marrow (BM) cells after treatment with CsA (n = 4 mice) compared with diluent control (NaCl 0.9%; n = 4 mice). (S) Pie charts depicting engraftment of t(8;21) AML cells (%) after treatment with CsA or diluent control.
Pharmacologic suppression of Ca++-signaling inhibits AML1-ETO LSC function in vitro and in vivo. (A) Unsupervised hierarchical clustering of significantly downregulated proteins following genetic inactivation of PLCG1 by a specific gRNA in SKNO-1_Cas9-Blast cells. (B) Network map displaying the significantly enriched signaling pathways upon genetic inactivation of PLCG1, annotation from Reactome. The node size and color represent number of proteins participating in each node. (C) Proliferation assayed by cell counting after trypan blue exclusion for Kasumi-1, SKNO-1, HL-60, and OCI-AML3 cells following treatment with the calcineurin inhibitor cyclosporin A (CsA, 5 μM) or diluent control (NaCl 0.9%). n = 4 independent experiments, 1-way ANOVA. (D) Analysis scheme of primary recipient mice following ciclosporin A (CsA) treatment vs diluent control (NaCl 0.9%). (E) Spleen weight of AE/K primary recipient mice; Mann-Whitney U test. (F) Histologic analysis of liver, lung, and spleen morphology after onset of AML in AE/K primary recipient mice treated with CsA or diluent control (NaCl 0.9%). Scale bars, 100 μm. (G) Immunophenotypic analysis of AE/K GFP+ BM LSK cells; Mann-Whitney U test. (H) Kaplan-Meier survival curves of AE/K secondary recipient mice. Irradiated (13 Gy, single dose) 6- to 8-week-old recipients of 2 × 10⁶ bone marrow cells from AE/K CsA (n = 7) or NaCl 0.9% (n = 8) treated primary recipients; Mantel-Cox test. (I) Spleen weight of MA9 primary recipient mice treated with CsA or diluent control (NaCl 0.9%), n.s., not significant. (J) Histologic analysis of liver, lung, and spleen morphology after onset of AML in MA9 primary recipient mice after treatment with CsA or diluent control. Scale bars, 100 μm. (K) Immunophenotypic analysis of GFP+LSK cells in the bone marrow of MA9 primary recipient mice. (L) Survival of MA9-transformed secondary recipient mice. Irradiated (13 Gy, single dose) 6- to 8-week-old recipients of 2 × 10⁶ bone marrow cells from MA9 CsA or NaCl 0.9% treated primary recipient mice (n = 8 CsA; n = 8 NaCl 0.9%), Mantel-Cox test. (M-N) Number of engrafted mice per dilution in the NaCl- vs CsA-treated cohort. LSC frequency was 1/5801 for NaCl-treated recipients (95% confidence interval, 1/2182-15,427) and 1/12,1901 for CsA-treated recipients (95% confidence interval, 1/39,911-372,329), P = .000026 using Poisson analysis; n = 5 mice per dilution and treatment, analysis was performed using ELDA (Extreme Limiting Dilution Assay) software.44 (O) Colony formation of primary human AE/t(8;21) AML cells (n = 6 individual patients). Colony number per sample following pharmacologic inhibition with CsA (5, 10 μM) compared with diluent control (NaCl 0.9%). (P) Representative pictures of colonies from t(8;21) AML bone marrow cells after pharmacological inhibition with cyclosporin A compared with diluent control (NaCl). Scale bars, 200 μm. (Q) Colony count of BM cells derived from 3 independent healthy donors. Colony number per sample following pharmacologic inhibition with CsA (5 μM) compared with diluent control (NaCl 0.9%). (R) Number of hCD4+ hCD13+ cells per 1 × 10⁶ bone marrow (BM) cells after treatment with CsA (n = 4 mice) compared with diluent control (NaCl 0.9%; n = 4 mice). (S) Pie charts depicting engraftment of t(8;21) AML cells (%) after treatment with CsA or diluent control.
Discussion
AML1-ETO transforms HSPCs in a cell-type-specific manner by conferring aberrant self-renewal capacity34,35 and established AE-AML cells show a deregulation of a number of signaling pathways involved in leukemic maintenance.24,36,37 In our study, we identified PLCG1 as an essential factor required for AE-AML. We show that this gene directly responds to the expression of AML1-ETO and we identified an enhancer that is required for LSC-specific expression. The mechanism of activation closely resembles activation of cell-cycle regulators such as CCND2 transcription by AML1-ETO,25 which also depends on the presence of AP-1 transcription factors. These findings suggest that also PLCG1 expression is regulated in a direct and indirect manner through AML1-ETO. Of note, disruption of gene-regulatory networks by genetic inactivation of the oncogenic fusion resulted in gradual and time-dependent changes of gene expression and modulated chromatin landscape.
Importantly, we found that PLCG1 function is specifically required for AML1-ETO LSCs but not for normal HSC function and that calcium signaling downstream of PLCG1 is an essential component for leukemia maintenance.
Recent reports have described activation of PLCG1 in bulk leukemia populations and cell lines of t(8;21) AML and have linked its expression with resistance to chemotherapy.8 Primary resistance, however, is not the major clinical limitation, as most patients with t(8;21) AML respond positively to chemotherapy.38 In contrast, more than 50% eventually relapse or present with minimal residual disease that stays stable over many years.39 Here, we show that PLCG1 is required for self-renewal properties and maintenance of AE-LSC and its inactivation depletes AE-transformed LSCs in vivo. We therefore hypothesize that PLCG1 plays an important role in the maintenance of a clinically relevant LSC pool that is responsible for relapse and thus highlights the relevant target population.1 Corruption of the cellular signaling network by PLCG1 upregulation is a part of the AE-specific transcriptional network and emphasizes the importance of studying the gene regulatory networks of specific types of AML in detail to be able to uncover new therapeutic approaches.
Recent reports have highlighted the importance of tightly controlled Ca++ homeostasis for HSC self-renewal.40,41 Such a requirement for tightly controlled Ca++ homeostasis may change during malignant transformation, depending on the oncogenic background. BCR-ABL transformed CML cells show activation of Wnt/Ca++/NFAT signaling and pharmacologic abrogation of Ca++ signaling facilitates leukemia cell elimination when combined with tyrosine kinase inhibitor therapy.42 In contrast, disturbance of Ca++ homeostasis through deletion of Prdm16 results in delayed disease development and improved survival of recipient mice in MA9-transformed leukemia.43 That Ca++ signaling is functionally relevant specifically in t(8;21) AML allowed to use this information of devise as a potential drug-repurposing regime for the eradication of AE-LSCs. Treatment with CsA-delayed disease onset in secondary transplants, indicating that the LSC population is highly sensitive to this treatment and may form part of a sequential approach designed to prevent relapse.
In summary, our findings identified a critical pathway for AE-leukemia maintenance and self-renewal. Because PLCG1 is dispensable for maintenance of normal HSPCs, we anticipate that targeting PLCG1 signaling will predict therapeutic success in AML1-ETO AML.
Acknowledgments
The authors thank A. Fenske (Central Animal Facility, Otto-von-Guericke University Magdeburg) and M.v.d. Wall (Animal Facility University Hospital Jena) for their support with animal care; R. Hartig (Flow Facility, Otto-von-Guericke University Magdeburg), M. Locke, and K. Schubert (Flow Facility, Fritz-Lipmann Institute, Jena, Germany) for their support with cell sorting; L. Rothenburger (SF Histology, Fritz-Lipmann Institute, Jena) for support with histopathology; M. Scherr (Hannover Medical School, Hannover) for providing constructs; Peter Cockerill (Institute of Cancer and Genomic Sciences, University of Birmingham) for his help with motif annotation; N. Rahnis and P. Riemenschneider (CF Proteomics, Fritz-Lipmann Institute, Jena) for support with sample preparation; and S. Frey and K. Kathner-Schaffert for technical assistance. The authors also thank T. Fischer (OvGU Magdeburg) for helpful discussions during the initial steps of this project.
This work was supported by grants of the German Research Council (DFG), (HE6233/6-1 to F.H.H. and SCHN1556/1-1 to T.M.S.), by a travel grant of the Fritz Thyssen Stiftung (Az. 50.19.0.003MN to T.M.S.), by the DFG-Collaborative Research Center (CRC854/2) to F.H.H. (Project A20), by the German Jose Carreras Leukemia Foundation (DJCLS F 12/06 to F.H.H.), and by the Thuringian state program ProExzellenz (RegenerAging - FSU-I-03/14) of the Thuringian Ministry for Research (to F.H.H. and H.B.). Research in C.B.’s laboratory is supported by a program grant from Bloodwise (15001) and a studentship grant from Universitas 21 (M.N.)
Authorship
Contribution: conceptualization: T.M.S., F.H.H.; methodology: T.M.S., K.-D.F., F.H.H.; formal analysis: T.M.S., A.S., A.K.J., J.K., A.D., T.E., N.H., C.-J.H., C.B., S.A.A., L.J., Y.-T.D., S.G.K., A.P., H.B., A.H., O.H., C.-W.C., L.B., A.O., B.v.E., F.H.H.; investigation: T.M.S., M.N., P.A.-T.; resources: K.D., Z.C., S.-J.C., S.B., G.M., E.S.N., E.G.S., A.G.E., M.M.; writing-original draft: T.M.S., A.S., C.B., F.H.H.; writing-review and editing: T.M.S., A.S., F.P., A.H., M.B., S.W.L., C.B., F.H.H.; and supervision: F.H.H.
Conflict-of-interest disclosure: The authors declare no competing financial interests.
Correspondence: Florian H. Heidel, Universitätsmedizin Greifswald, Sauerbruchstraße, 17489 Greifswald, Germany; e-mail: florian.heidel@uni-greifswald.de.
The online version of this article contains a data supplement.
There is a Blood Commentary on this article in this issue.
The publication costs of this article were defrayed in part by page charge payment. Therefore, and solely to indicate this fact, this article is hereby marked “advertisement” in accordance with 18 USC section 1734.

This feature is available to Subscribers Only
Sign In or Create an Account Close Modal