

Key Points
Patients who are MRD negative with ≥CR have improved PFS, regardless of therapy, vs those who do not reach CR or are MRD positive.
Daratumumab-based therapies lead to higher rates of ≥CR with MRD negativity compared with the standard of care.

Abstract
We explored minimal residual disease (MRD) in relapsed/refractory multiple myeloma (RRMM) and transplant-ineligible (TIE) newly diagnosed multiple myeloma (NDMM) using data from 4 phase 3 studies (POLLUX, CASTOR, ALCYONE, and MAIA). Each study previously demonstrated that daratumumab-based therapies improved MRD negativity rates and reduced the risk of disease progression or death by approximately half vs standards of care. We conducted a large-scale pooled analysis for associations between patients achieving complete response or better (≥CR) with MRD-negative status and progression-free survival (PFS). MRD was assessed via next-generation sequencing (10−5 sensitivity threshold). Patient-level data were pooled from all 4 studies and for patients with TIE NDMM and patients with RRMM who received ≤2 prior lines of therapy (≤2 PL). PFS was evaluated by response and MRD status. Median follow-up (months) was 54.8 for POLLUX, 50.2 for CASTOR, 40.1 for ALCYONE, and 36.4 for MAIA. Patients who achieved ≥CR and MRD negativity had improved PFS vs those who failed to reach CR or were MRD positive (TIE NDMM and RRMM hazard ratio [HR] 0.20, P < .0001; TIE NDMM and RRMM ≤2 PL HR 0.20, P < .0001). This benefit occurred irrespective of therapy or disease setting. A time-varying Cox proportional hazard model confirmed that ≥CR with MRD negativity was associated with improved PFS. Daratumumab-based treatment was associated with more patients reaching ≥CR and MRD negativity. These findings represent the first large-scale analysis with robust methodology to support ≥CR with MRD negativity as a prognostic factor for PFS in RRMM and TIE NDMM. These trials were registered at www.clinicaltrials.gov as #NCT02076009, #NCT02136134, #NCT02195479, and #NCT02252172.
Introduction
Recent therapeutic advancements for patients with multiple myeloma (MM) have led to near doubling of their survival.1 As long-term outcomes improve, the duration of time to data maturity in clinical trials lengthens for end points aimed at demonstrating clinically meaningful patient benefits, such as progression-free survival (PFS) and overall survival (OS). Consequently, patients may need to wait longer for access to novel drugs or indications; therefore, alternative disease assessments are needed to allow evaluation of the efficacy of novel therapies at earlier time points.
Minimal residual disease (MRD) is emerging as a prognostic and sensitive assessment to measure depth of response, with many studies demonstrating that undetectable MRD (also referred to as MRD negativity) is associated with improved PFS and OS for MM.2-10 Moreover, MRD is becoming a key end point in recent clinical studies, and the International Myeloma Working Group (IMWG) has provided updated guidance for the uniform assessment and reporting of MRD negativity.11 The IMWG MRD criteria state that MRD should be assessed when a patient achieves complete response (CR) or better (≥CR), with a minimum sensitivity of 1 nucleated tumor cell in 100 000 normal cells (10−5 sensitivity threshold), by either next-generation sequencing (NGS) or next-generation flow cytometry.
Daratumumab is a human immunoglobulin Gκ monoclonal antibody targeting CD38 with a direct on-tumor and immunomodulatory12 mechanism of action. Daratumumab is approved as monotherapy for patients with heavily pretreated relapsed and/or refractory MM (RRMM) and combination therapy for both RRMM after ≥1 prior line of therapy and newly diagnosed MM (NDMM).13 In the primary analyses of the registrational phase 3 POLLUX14 (median follow-up, 13.5 months) and CASTOR15 (median follow-up, 7.4 months) studies for RRMM, daratumumab (D) added either to lenalidomide and dexamethasone (Rd) or to bortezomib and dexamethasone (Vd), respectively, reduced the risk of disease progression or death by ≥61%. Longer follow-up from these studies (median follow-up: POLLUX, 44.3 months; CASTOR, 40.0 months) demonstrated that responses to therapy deepened over time, with the daratumumab groups having significantly improved rates of MRD negativity (10−5) compared with the control groups (POLLUX, D-Rd 30.4% vs Rd 5.3%, P < .0001; CASTOR, D-Vd 14.0% vs Vd 1.6%, P < .0001).16,17 In the CASTOR and POLLUX studies, negative status for MRD and sustained MRD negativity lasting ≥6 months and ≥12 months were associated with longer PFS for patients with RRMM.18
Similarly, the phase 3 ALCYONE10 and MAIA9 studies demonstrated a clinical benefit for daratumumab-combination therapy among patients with transplant-ineligible (TIE) NDMM. In the primary analysis of ALCYONE (median follow-up, 16.5 months), daratumumab combined with bortezomib, melphalan, and prednisone (VMP) reduced the risk of disease progression or death by 50%.10 The benefit of D-VMP was maintained with longer median follow-up (40.1 months), with D-VMP reducing the risk of death by 40% vs VMP; D-VMP was also associated with a significant improvement in MRD negativity rate (D-VMP 28% vs VMP 7%, P < .0001).19 In the primary analysis of MAIA (median follow-up, 28.0 months), D-Rd reduced the risk of disease progression or death by 44% vs Rd and significantly improved rates of MRD negativity (D-Rd 24.2% vs Rd 7.3%, P < .001).9 In both ALCYONE and MAIA, negative status for MRD was associated with longer PFS, irrespective of trial treatments.9,19
As noted, numerous studies and meta-analyses have assessed the predictive and prognostic value of MRD status for MM2-10; however, these studies have included different MRD assessment techniques, MRD cutoff thresholds, and timing of assessments and have not exclusively evaluated MRD negativity among patients with ≥CR, as indicated by the IMWG criteria. Here, we present a large-scale, pooled analysis using consistent MRD assessment methodology to assess patient-level data from phase 3 registrational clinical studies of daratumumab-combination therapies in RRMM (POLLUX and CASTOR) and in TIE NDMM (ALCYONE and MAIA). These data were evaluated for the predictive value of MRD negativity with best response, as well as its prognostic value for daratumumab-based therapies.
Methods
Study design
The study designs and primary end points of the randomized, open-label, multicenter, registrational, phase 3 POLLUX (NCT02076009),14 CASTOR (NCT02136134),15 ALCYONE (NCT02195479),10 and MAIA (NCT02252172)9 studies have been previously published. Briefly, POLLUX and CASTOR evaluated D-Rd or D-Vd, respectively, in patients with RRMM, and ALCYONE and MAIA evaluated D-VMP or D-Rd, respectively, in patients with TIE NDMM. All patients had documented measurable disease according to IMWG criteria.20-22 In the POLLUX and CASTOR studies, patients had received ≥1 prior line of therapy with a response (partial response or better) to ≥1 of the lines. Patients were ineligible if their RRMM disease was refractory to lenalidomide (for POLLUX) or was refractory to bortezomib or another proteasome inhibitor (for CASTOR). In ALCYONE and MAIA, patients were ineligible for high-dose chemotherapy and stem cell transplant due to age (≥65 years) or unacceptable coexisting conditions. In each study, patients were randomized 1:1 to each treatment group (POLLUX, D-Rd or Rd; CASTOR, D-Vd or Vd; ALCYONE, D-VMP or VMP; MAIA, D-Rd or Rd) based on predefined stratification factors.9,10,14,15
Each study was approved by an independent ethics committee or institutional review board, patients provided written informed consent, and the trials were conducted in accordance with the principles in the Declaration of Helsinki and current International Conference on Harmonization Good Clinical Practice guidelines.
Study treatments
In POLLUX, all patients received lenalidomide (25 mg orally on days 1-21) and dexamethasone (40 mg weekly) during each 28-day cycle. Patients in the D-Rd group received daratumumab (16 mg/kg IV) weekly for cycles 1 and 2, every other week in cycles 3 to 6, and every 4 weeks thereafter. Study treatment continued until disease progression, patient withdrawal, or unacceptable toxicity. In CASTOR, all patients received bortezomib (1.3 mg/m2 subcutaneously on days 1, 4, 8, and 11) and dexamethasone (20 mg orally on days 1, 2, 4, 5, 8, 9, 11, and 12) for up to eight 21-day cycles. Patients in the D-Vd group received daratumumab (16 mg/kg IV) weekly for cycles 1 to 3, once every 3 weeks for cycles 4 to 8, and once every 4 weeks thereafter until disease progression, patient withdrawal, or unacceptable toxicity. In ALCYONE, all patients received nine 42-day cycles of bortezomib (1.3 mg/m2 subcutaneously twice weekly during weeks 1, 2, 4, and 5 of cycle 1 and once weekly during weeks 1, 2, 4, and 5 of cycles 2-9), melphalan (9 mg/m2 orally on days 1-4 of each cycle), and prednisone (60 mg/m2 orally on days 1-4 of each cycle). In the D-VMP group, patients received daratumumab (16 mg/kg IV) weekly in cycle 1, every 3 weeks in cycles 2 to 9, and every 4 weeks thereafter until disease progression or unacceptable toxicity. In MAIA, all patients received lenalidomide (25 mg orally on days 1-21) and dexamethasone (40 mg weekly) during each 28-day cycle. Patients in the D-Rd group received daratumumab (16 mg/kg) weekly for cycles 1 and 2, every other week for cycles 3 to 6, and every 4 weeks thereafter. Study treatment continued until progressive disease or unacceptable toxicity. For each study, pre- and postinfusion medications, as well as dose modifications, have been previously described.9,10,14,15
End points and MRD assessments
In each study, the primary efficacy end point was PFS.9,10,14,15 Response to therapy and disease progression assessments were evaluated using a central laboratory and a validated computer algorithm according to IMWG criteria.11,21,22 As specified in study designs, MRD assessments first occurred for all patients who were suspected to have achieved CR or stringent CR (sCR). For those patients who achieved ≥CR, additional MRD testing occurred in POLLUX (3 and 6 months following CR/sCR, and thereafter every 12 months post-CR/sCR), CASTOR (on the first day of cycle 9 and cycle 15, and thereafter every 12 months post-CR/sCR), and ALCYONE and MAIA (12, 18, 24, and 30 months after the first dose). MRD was assessed from bone marrow aspirates and evaluated with NGS using the clonoSEQ® assay (v.2.0; Adaptive Biotechnologies, Seattle, WA).23 According to IMWG criteria,11 the minimum sensitivity level for the definition of MRD negativity was set at 1 in 105 nucleated cells (eg, meaning that no tumor cell could be detected within 100 000 bone marrow cells). A minimum cell input equivalent to the given sensitivity threshold was required to determine MRD negativity (eg, MRD at 10−5 required that ≥100 000 cells were evaluated). The MRD negativity rate was defined as the proportion of patients with ≥CR and ≥1 MRD-negative result at any time point during daratumumab-based treatment and prior to subsequent therapy for MM. If MRD negativity was not achieved, a patient was considered MRD positive.
For the combined analyses of PFS and status of MRD plus conventional response,21,22 patient-level data were pooled in a combined analysis including all patients from POLLUX, CASTOR, ALCYONE, and MAIA. An additional analysis included pooled patients from POLLUX and CASTOR who had ≤2 prior lines of therapy (≤2 PL) combined with patients from ALCYONE and MAIA. As the primary end point, PFS was defined as the duration from the date of randomization to either progressive disease or death, whichever occurred first.
Statistical analyses
Sample size determinations and predefined statistical analyses have been presented previously.9,10,14,15 For the present analysis, the Kaplan-Meier method with log-rank tests and Cox proportional hazard models was used to compare PFS by ≥CR and MRD-negative status and treatment group (daratumumab or control). Hazard ratios (HRs) and 95% confidence intervals (CIs) were reported between the patients with ≥CR and MRD-negative status and patients with very good partial response (VGPR) or worse or MRD-positive status regardless of response or treatment regimen. The HR within each treatment group was also determined, and a 2-sided P value was presented. Similar analyses were done to compare PFS by MRD status among patients who achieved ≥CR.
As MRD status and clinical response change over time, time-varying survival analyses were used to assess the correlation between MRD with response status and PFS. A univariate model was conducted with ≥CR plus MRD-negative status at multiple time points (as the sole time-varying explanatory variable) to assess its impact on PFS. Baseline MRD status was considered as positive for all patients before initiation of treatment. A multivariate time-varying survival model with response group, disease setting (NDMM, RRMM), treatment group (daratumumab-containing regimen, standard-of-care control regimen), age (as reported in the case report form), International Staging System (ISS) disease stage (I, II, III), baseline renal function (>60 mL/min, 60 mL/min), and cytogenetic risk (high, standard) as covariates was also performed to examine whether the correlation between CR with MRD-negative status and PFS was affected by these baseline factors. High cytogenetic risk status was defined as having ≥1 of the following abnormalities, determined using NGS or fluorescence in situ hybridization or karyotype analysis: del17p, t(4;14), or t(14;16). Patients with missing values in baseline renal function and cytogenetic risk were excluded from the multivariate model.
Role of funding source
The study sponsor funded this study and, in collaboration with the authors, designed the trials, collected the data, and analyzed and interpreted the data. All authors had full access to all the data in the studies and had responsibility for the decision to submit for publication.
Results
In total, 2510 patients were included in this analysis, including 569 patients in POLLUX (D-Rd, n = 286; Rd, n = 283), 498 patients in CASTOR (D-Vd, n = 251; Vd, n = 247), 706 patients in ALCYONE (D-VMP, n = 350; VMP, n = 356), and 737 patients in MAIA (D-Rd, n = 368; Rd, n = 369) who were randomized to the daratumumab or control groups. Patient baseline demographics and clinical characteristics were previously published and were generally well balanced between treatment groups within each study.9,10,14,15 Among patients with RRMM, 460 patients in POLLUX (D-Rd, n = 234; Rd, n = 226) and 379 patients in CASTOR (D-Vd, n = 192; Vd, n = 187) had received ≤2 PL. The median duration of follow-up was 54.8 (range, 0.0-61.9) months in POLLUX, 50.2 (range, 0.0-58.6) months in CASTOR, 40.1 (range, 0.0-52.1) months in ALCYONE, and 36.4 (range, 0.0-49.9) months in MAIA.
MRD negativity
Overall, 16.7% (n = 418) of patients achieved MRD-negative status (by NGS, 10−5 sensitivity threshold), and 34.0% of patients (n = 854) achieved ≥CR. Within this latter subgroup of patients who achieved ≥CR (n = 854), 48.4% (n = 413) were MRD negative. In the combined daratumumab-combination groups, the MRD negativity rate was 26.8% compared with 6.5% in the combined control groups (P < .0001). ≥CR was achieved by 45.9% (n = 576) of patients in the daratumumab groups and 22.2% (n = 278) of patients in the control groups; among patients who achieved ≥CR, MRD negativity was achieved by 57.5% of patients in the D groups and 29.5% in the control groups (P < .0001). Within each study, daratumumab-combination therapies led to higher rates of MRD negativity vs standard of care, both in the intention-to-treat (ITT) populations and among patients who reached ≥CR (Table 1). The MRD negativity rates for daratumumab-based regimens ranged from 15.1% to 32.5% in the ITT population and 52.8% to 58.8% among patients who achieved ≥CR.
Rates of MRD negativity
| POLLUX | CASTOR | |||||
|---|---|---|---|---|---|---|
| MRD negativity (10−5) in RRMM | D-Rd | Rd | P value* | D-Vd | Vd | P value* |
| ITT | ||||||
| Number evaluable | 286 | 283 | 251 | 247 | ||
| Rate | 93 (32.5%) | 19 (6.7%) | <.0001 | 38 (15.1%) | 4 (1.6%) | <.0001 |
| ≥CR | ||||||
| Number evaluable | 162 | 65 | 72 | 23 | ||
| Rate | 93 (57.4%) | 19 (29.2%) | .0001 | 38 (52.8%) | 4 (17.4%) | .0035 |
| ≤2 PL, ITT | ||||||
| Number evaluable | 234 | 226 | 192 | 187 | ||
| Rate | 77 (32.9%) | 19 (8.4%) | <.0001 | 35 (18.2%) | 3 (1.6%) | <.0001 |
| ≤2 PL, ≥CR | ||||||
| Number evaluable | 135 | 56 | 67 | 22 | ||
| Rate | 77 (57.0%) | 19 (33.9%) | .0042 | 35 (52.2%) | 3 (13.6%) | .0023 |
| ALCYONE† | MAIA | |||||
|---|---|---|---|---|---|---|
| MRD negativity (10−5) in TIE NDMM | D-VMP | VMP | P value* | D-Rd | Rd | P value* |
| ITT | ||||||
| Number evaluable | 350 | 356 | 368 | 369 | ||
| Rate | 99 (28.3%) | 25 (7.0%) | <.0001 | 106 (28.8%) | 34 (9.2%) | <.0001 |
| ≥CR | ||||||
| Number evaluable | 160 | 90 | 182 | 100 | ||
| Rate | 94 (58.8%) | 25 (27.8%) | <.0001 | 106 (58.2%) | 34 (34.0%) | .0001 |
Data are n (%) or n. Median duration of follow-up was 54.8 months in POLLUX, 50.2 months in CASTOR, 40.1 months in ALCYONE, and 36.4 months in MAIA.
P value was calculated using Fisher exact test.
MRD data in the ITT population of ALCYONE were reported previously.19 In the ITT population, 5 patients who achieved a best response of VGPR were also MRD negative (all from the D-VMP arm of ALCYONE).
Among patients with a high cytogenetic risk (defined by ≥1 of the del17p, t[4;14], or t[14;16] abnormalities), the rate of achieving ≥CR and MRD negativity was sixfold higher in the pooled D-combination therapy groups compared with the pooled standard-of-care groups (23.3% vs 3.8%), although these rates are all together lower than those seen in the ITT population. Within each study, the rate of ≥CR plus MRD negativity for the D-combination group vs the standard of care group was 28.6% vs 2.9% for POLLUX, 15.0% vs 0% for CASTOR, 26.4% vs 8.9% for ALCYONE, and 22.9% vs 2.3% for MAIA (supplemental Table 1).
Prognostic value of MRD negativity by depth of response
In a combined analysis of all patients from POLLUX, CASTOR, ALCYONE, and MAIA (n = 2510), patients who reached ≥CR and MRD negativity (n = 413) had extended PFS compared with patients who either failed to reach CR (eg, achieved ≤VGPR) or were MRD positive (n = 2097). The estimated 48-month PFS rates were 70.4% for patients who reached ≥CR and MRD negativity compared with 23.9% for patients who achieved ≤VGPR or were MRD positive. At clinical cutoff, the clinical benefit for patients with combined ≥CR and MRD negativity translated to an 80.0% reduction in the risk of disease progression or death (HR, 0.20; 95% CI, 0.16-0.24; P < .0001; Figure 1A). A separate post hoc combined analysis including patients from POLLUX and CASTOR with ≤2 PL and all patients from ALCYONE and MAIA (n = 2282) produced nearly identical results. For this group of patients, the estimated 48-month PFS rates were 70.7% for patients who achieved the deepest response (≥CR and MRD negative) and 24.8% for patients who either achieved ≤VGPR or were MRD positive, with an 80.0% reduction in the risk of disease progression or death (HR, 0.20; 95% CI, 0.16-0.25; P < .0001; Figure 1B). In an additional analysis comparing patients who achieved ≥CR with or without MRD negativity, as well as patients with a best response of ≤VGPR, the deepest level of response (≥CR and MRD negativity) was associated with a clinically meaningful improvement in PFS compared with the other groups (≥CR and MRD positive [HR, 0.52; 95% CI, 0.41-0.66; P < .0001] and ≤VGPR [HR, 0.14; 95% CI, 0.11-0.17; P < .0001]; supplemental Figure 1).
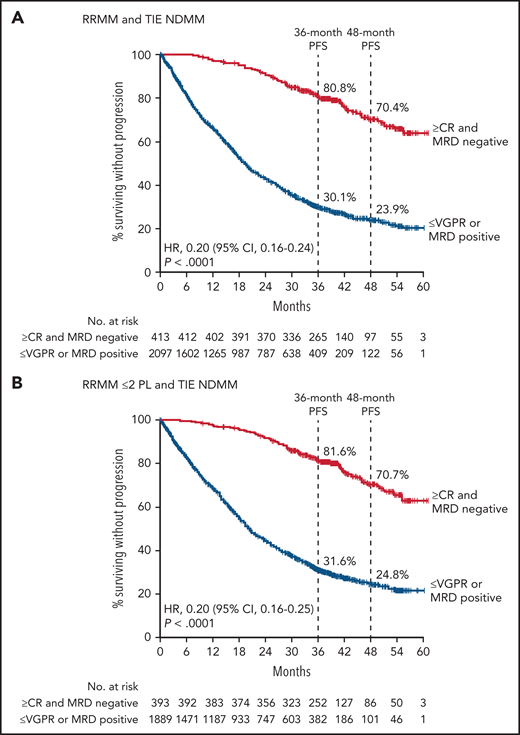
PFS by response and MRD status. PFS by response and MRD status (10−5) among patients who achieved CR or better and were MRD negative (≥CR and MRD negative) or who achieved a response less than CR or were MRD positive (≤VGPR or MRD positive) for patients pooled from POLLUX, CASTOR, ALCYONE, and MAIA (A) and patients in POLLUX and CASTOR with ≤2 PL pooled with all patients from ALCYONE and MAIA (B). Shown are Kaplan-Meier estimates of PFS among patients in the ITT population based on the absence of MRD as measured using the threshold of 1 tumor cell per 105 white cells and response categories according to IMWG criteria.
PFS by response and MRD status. PFS by response and MRD status (10−5) among patients who achieved CR or better and were MRD negative (≥CR and MRD negative) or who achieved a response less than CR or were MRD positive (≤VGPR or MRD positive) for patients pooled from POLLUX, CASTOR, ALCYONE, and MAIA (A) and patients in POLLUX and CASTOR with ≤2 PL pooled with all patients from ALCYONE and MAIA (B). Shown are Kaplan-Meier estimates of PFS among patients in the ITT population based on the absence of MRD as measured using the threshold of 1 tumor cell per 105 white cells and response categories according to IMWG criteria.
These data are further supported by results from a Cox proportional hazard model with time-dependent covariates showing that ≥CR with MRD negativity was associated with improved PFS in univariate and multivariate analyses among all RRMM and TIE NDMM patients and among RRMM ≤2 PL and TIE NDMM patients (Table 2). Multivariate analyses also demonstrated that improved PFS was associated with disease setting, treatment group, ISS disease stage, and cytogenetic risk status. Similar results were seen in analyses of the risk of disease progression or death on the next subsequent line of therapy (PFS2), with patients who achieved the deepest level of response (≥CR and MRD negative) having improved PFS2 compared with those who did not reach CR (≤VGPR) or were MRD positive (supplemental Figure 2A-B and supplemental Table 2).
Time-varying Cox proportional hazard model for PFS
| Variable | HR (95% CI) | P value |
|---|---|---|
| RRMM and TIE NDMM | ||
| Univariate analysis | ||
| Response group (≥CR + MRD negative vs ≤VGPR or MRD positive) | 0.17 (0.12-0.24) | <.0001 |
| Multivariate analysis | ||
| Response group (≥CR + MRD negative vs ≤VGPR or MRD positive) | 0.20 (0.14-0.29) | <.0001 |
| Disease setting (NDMM vs RRMM) | 0.45 (0.39-0.52) | <.0001 |
| Treatment (daratumumab-containing regimen vs SoC) | 0.48 (0.43-0.54) | <.0001 |
| Age | 1.00 (0.99-1.01) | .9619 |
| ISS disease stage (II vs I) | 1.76 (1.52-2.03) | <.0001 |
| ISS disease stage (III vs I) | 1.94 (1.64-2.30) | <.0001 |
| Baseline renal function (>60 mL/min vs ≤60 mL/min) | 1.00 (0.87-1.14) | .9449 |
| Cytogenetic risk (high vs standard) | 1.53 (1.30-1.79) | <.0001 |
| RRMM ≤2 PL and TIE NDMM | ||
| Univariate analysis | ||
| Response group (≥CR + MRD negative vs ≤VGPR or MRD positive) | 0.16 (0.11-0.24) | <.0001 |
| Multivariate analysis | ||
| Response group (≥CR + MRD negative vs ≤VGPR or MRD positive) | 0.19 (0.13-0.29) | <.0001 |
| Disease setting (NDMM vs RRMM) | 0.46 (0.39-0.53) | <.0001 |
| Treatment (daratumumab-containing regimen vs SoC) | 0.46 (0.40-0.52) | <.0001 |
| Age | 1.00 (0.99-1.01) | .7395 |
| ISS disease stage (II vs I) | 1.80 (1.54-2.11) | <.0001 |
| ISS disease stage (III vs I) | 1.93 (1.61-2.31) | <.0001 |
| Baseline renal function (>60 mL/min vs ≤60 mL/min) | 1.02 (0.89-1.18) | .7601 |
| Cytogenetic risk (high vs standard) | 1.64 (1.38-1.94) | <.0001 |
Data are shown for univariate and multivariate analyses using combined data from all RRMM and TIE NDMM patients in POLLUX, CASTOR, ALCYONE, and MAIA (RRMM and TIE NDMM) and among patients with RRMM with ≤2 PL from POLLUX and CASTOR and TIE NDMM from ALCYONE and MAIA (RRMM ≤2 PL and TIE NDMM). The following variables were evaluated: MRD negativity status with best response, disease setting, treatment, age, ISS disease stage, baseline renal function, and cytogenetic risk. RRMM and TIE NDMM patients with missing data for baseline renal function (POLLUX, n = 9; CASTOR, n = 20; ALCYONE, n = 0; MAIA, n = 0; total n = 29) or cytogenetic risk (POLLUX, n = 130; CASTOR, n = 142; ALCYONE, n = 90; MAIA, n = 95; total n = 457) were excluded from the multivariate model. RRMM ≤2 PL and TIE NDMM patients with missing data for baseline renal function (POLLUX, n = 8; CASTOR, n = 14; ALCYONE, n = 0; MAIA, n = 0; total n = 22) or cytogenetic risk (POLLUX, n = 108; CASTOR, n = 111; ALCYONE, n = 90; MAIA, n = 95; total n = 404) were excluded from the multivariate model.
SoC, standard of care.
Predictive value of MRD negativity by treatments
In PFS analyses of the pooled daratumumab-combination therapy groups vs the pooled control groups, patients who achieved ≥CR with MRD negativity had improved PFS compared with those who had responses ≤VGPR or were MRD positive, regardless of therapy (Figure 2A-B). While the benefit of achieving ≥CR with MRD negativity occurred regardless of treatment regimen or disease setting, among patients in deep response (≥CR and MRD negative), daratumumab-based therapies vs the standard of care were associated with significantly improved PFS in a pooled analysis of all RRMM and TIE NDMM patients (HR, 0.55; 95% CI, 0.36-0.84; P = .0057; Figure 2A) and among pooled RRMM ≤2 PL and TIE NDMM patients (HR, 0.54; 95% CI, 0.35-0.83; P = .0055; Figure 2B). The PFS benefit associated with daratumumab-based therapy compared with standard-of-care therapy was maintained in patients with ≥CR plus MRD negativity and in patients who had a response ≤VGPR or were MRD positive, regardless of whether standard-of-care therapy was given for a fixed number of cycles and daratumumab was given until disease progression or unacceptable toxicity (CASTOR and ALCYONE; supplemental Figure 3A-B) or if all components of the study treatment were given until disease progression (POLLUX and MAIA; supplemental Figure 3C-D).

PFS by response and MRD status among patients who received daratumumab-based regimens vs control regimens. PFS by response and MRD status (10−5) among patients in the pooled daratumumab-combination groups vs the pooled control groups from POLLUX, CASTOR, ALCYONE, and MAIA who achieved CR or better and were MRD negative (≥CR and MRD negative) or who achieved a response less than CR or were MRD positive (≤VGPR or MRD positive) for all patients combined (A) and patients in POLLUX and CASTOR with ≤2 PL pooled with all patients from ALCYONE and MAIA (B). Shown are Kaplan-Meier estimates of PFS among patients in the ITT population based on the absence of MRD as measured using the threshold of 1 tumor cell per 105 white cells and response categories according to IMWG criteria. In CASTOR and ALCYONE, standard of care was given for a fixed number of cycles and daratumumab was given until disease progression. In POLLUX and MAIA, patients who received standard of care or daratumumab-based regimens received study treatment until disease progression or unacceptable toxicity. Dara, daratumumab.
PFS by response and MRD status among patients who received daratumumab-based regimens vs control regimens. PFS by response and MRD status (10−5) among patients in the pooled daratumumab-combination groups vs the pooled control groups from POLLUX, CASTOR, ALCYONE, and MAIA who achieved CR or better and were MRD negative (≥CR and MRD negative) or who achieved a response less than CR or were MRD positive (≤VGPR or MRD positive) for all patients combined (A) and patients in POLLUX and CASTOR with ≤2 PL pooled with all patients from ALCYONE and MAIA (B). Shown are Kaplan-Meier estimates of PFS among patients in the ITT population based on the absence of MRD as measured using the threshold of 1 tumor cell per 105 white cells and response categories according to IMWG criteria. In CASTOR and ALCYONE, standard of care was given for a fixed number of cycles and daratumumab was given until disease progression. In POLLUX and MAIA, patients who received standard of care or daratumumab-based regimens received study treatment until disease progression or unacceptable toxicity. Dara, daratumumab.
The benefit of MRD negativity was further confirmed in a pooled analysis including only patients who achieved ≥CR from POLLUX, CASTOR, ALCYONE, and MAIA (Table 1). Patients who were also MRD negative had improved PFS compared with patients who achieved ≥CR but were MRD positive (HR, 0.49; 95% CI, 0.39-0.63; P < .0001; Figure 3A). The estimated 48-month PFS rates were 70.4% for patients who achieved ≥CR and MRD negativity vs 51.7% for patients who achieved ≥CR but were MRD positive. When analyzed by pooled treatment groups, patients who achieved ≥CR with MRD negativity had improved PFS regardless of therapy (Figure 3B). However, patients who received daratumumab-based therapies and achieved ≥CR and MRD negativity had improved PFS compared with patients who also achieved ≥CR and MRD negativity but received standard of care (HR, 0.51; 95% CI, 0.33-0.78; P = .0019; Figure 3B). Interestingly, daratumumab-based therapies vs standard of care also improved PFS among patients who achieved ≥CR but were MRD positive (HR, 0.53; 95% CI, 0.40-0.71; P < .0001; Figure 3B). An additional analysis of PFS based on MRD status among patients who achieved ≥CR showed that the benefit of daratumumab-based therapy was maintained when patients were grouped and pooled for the studies in which standard-of-care therapy was given for a fixed number of cycles and daratumumab was given until disease progression or unacceptable toxicity (CASTOR and ALCYONE; supplemental Figure 4A) and when all components of the study treatment were given until disease progression (POLLUX and MAIA; supplemental Figure 4B).
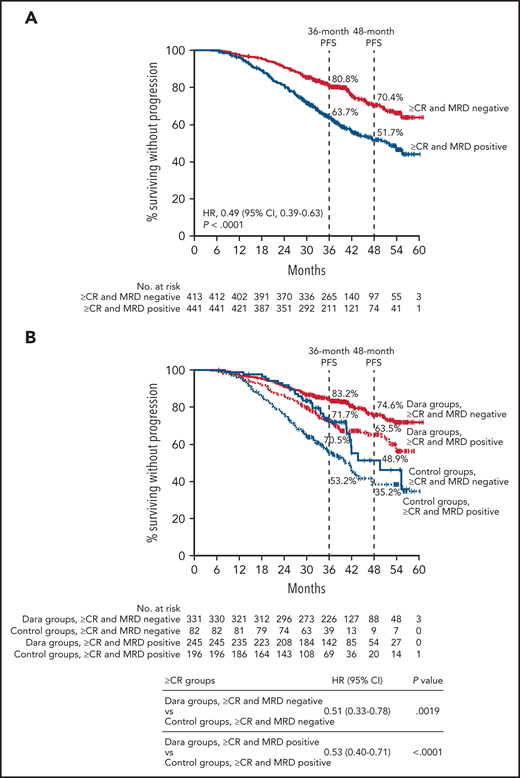
PFS by MRD status among patients who achieved ≥CR. PFS by MRD status (10−5) among all patients who achieved ≥CR (A) and patients in the pooled daratumumab-combination groups vs the pooled control groups (B) from POLLUX, CASTOR, ALCYONE, and MAIA. Shown are Kaplan-Meier estimates of PFS based on MRD status (MRD negative or positive) as measured using the threshold of 1 tumor cell per 105 white cells among patients in the ITT population who achieved ≥CR according to IMWG criteria. In CASTOR and ALCYONE, standard of care was given for a fixed number of cycles, and daratumumab was given until disease progression. In POLLUX and MAIA, patients who received standard of care or daratumumab-based regimens received study treatment until disease progression or unacceptable toxicity.
PFS by MRD status among patients who achieved ≥CR. PFS by MRD status (10−5) among all patients who achieved ≥CR (A) and patients in the pooled daratumumab-combination groups vs the pooled control groups (B) from POLLUX, CASTOR, ALCYONE, and MAIA. Shown are Kaplan-Meier estimates of PFS based on MRD status (MRD negative or positive) as measured using the threshold of 1 tumor cell per 105 white cells among patients in the ITT population who achieved ≥CR according to IMWG criteria. In CASTOR and ALCYONE, standard of care was given for a fixed number of cycles, and daratumumab was given until disease progression. In POLLUX and MAIA, patients who received standard of care or daratumumab-based regimens received study treatment until disease progression or unacceptable toxicity.
Discussion
This analysis of pooled data from 4 phase 3 clinical studies of daratumumab plus standard-of-care regimens for the treatment of RRMM or TIE NDMM demonstrated that ≥CR with MRD-negative status was strongly associated with improved PFS, regardless of therapy. While deep response (≥CR and MRD negative) was associated with improved PFS for all patients, patients receiving daratumumab-based therapies had even further improved PFS compared with the control groups. This finding was related to the higher rate of ≥CR with MRD negativity observed in the daratumumab-based therapy groups compared with the control groups, including among the small number of patients with high cytogenetic risk. Additionally, patients who achieved deep response (≥CR and MRD negative) had improved PFS on the next line of therapy in comparison with those who had responses ≤VGPR or were MRD positive.
Within the pooled analysis including only patients who achieved ≥CR, those who also achieved MRD negativity had prolonged PFS compared with those who reached ≥CR but were MRD positive, regardless of treatment regimen. These data highlight the importance of assessing MRD status even in patients with a deep response according to conventionally defined criteria. Moreover, among patients who achieved ≥CR, those who received daratumumab-based regimens experienced higher rates of MRD negativity and prolonged PFS compared with control groups. From a response perspective, patients receiving daratumumab-based therapy who achieved ≥CR showed a PFS benefit vs control groups, regardless of MRD status.
One possible explanation for these observations is that daratumumab may induce longer periods of sustained MRD negativity and deeper responses compared with standard of care. It is also possible that the improved outcomes associated with daratumumab-based regimens may be affected by continued daratumumab therapy that was given until progression, vs standard of care that was given for a fixed number of cycles, in 2 of 4 studies (CASTOR and ALCYONE; in POLLUX and MAIA, patients in both arms received study treatment until disease progression or unacceptable toxicity). Nevertheless, the observation that MRD negativity with CR improved patient outcomes was consistent across analyses of all pooled patients in RRMM and TIE NDMM studies and analyses of patients in RRMM studies who had received 1 or 2 prior lines of therapy. Together, these data support the use of MRD negativity among patients who achieved ≥CR as a prognostic tool to measure deep response translating into improved PFS.
A number of studies have suggested that MRD negativity is associated with improved PFS and OS in MM.2-10,24,25 However, these studies examined varied patient populations at different time points using nonuniform MRD assessment methods; moreover, patient-level data were not uniformly available in those studies. The current analysis leveraged similarities across POLLUX, CASTOR, ALCYONE, and MAIA in terms of similar MRD assessment techniques and thresholds applied, only considering MRD negativity in patients achieving ≥CR, using similar intervals of periodic MRD assessments after CR, and generally similar patient populations. Any differences between RRMM and TIE NDMM in the 4 studies were accounted for by including evaluations of RRMM ≤2 PL patients with TIE NDMM patients; as noted above, results were nearly identical to the full RRMM and TIE NDMM population analyses. While it is likely that many patients with MRD negativity also have deep responses, the current study represents the first evaluation of the prognostic value of ≥CR with MRD negativity with robust methodology in a large number of patients.
This study aligns with data from other analyses demonstrating that MRD negativity is associated with improved long-term outcomes and that MRD negativity is the most relevant predictor of clinical outcome compared with other prognostic factors for MM.26,27 Moreover, this study supports the prognostic value of MRD negativity with ≥CR in RRMM and TIE NDMM populations, which aligns with the IMWG criteria recommending that MRD negativity be evaluated among patients who achieve ≥CR.11
Acknowledgments
The authors thank the patients, volunteers, co-investigators, staff members at the trial sites, and clinical site coordinators who participated in the POLLUX, CASTOR, ALCYONE, and MAIA studies. They also thank representatives of the sponsor who were involved in data collection and analysis, as well as Charlotte Majerczyk (Cello Health Communications/MedErgy) for medical writing and editorial assistance, which was funded by Janssen Global Services.
The studies were supported by Janssen Research & Development, LLC.
Authorship
Contribution: M.C., J.S.-M., S.Z.U., K.W., M.A.D., H.A.-L., B.P., N.J.B., T.P., V.H., P.M., M.-V.M., A.P., S.I., T.F., S.K., N.W.C.J.v.d.D., P.S., A.S., and N.M. collected data; and all authors participated in study design, data analysis and interpretation, and drafting and revising of the manuscript and approved the final version for submission.
Conflict-of-interest disclosure: M.C. received honoraria from Janssen, Celgene/Bristol Myers Squibb, Sanofi, Takeda, Amgen, AbbVie, Adaptive, and GSK and served on a speakers bureau for Janssen and Celgene/Bristol Myers Squibb. J.S.-M. served as a consultant and on an advisory board for Amgen, Bristol Myers Squibb, Celgene, Janssen, MSD, Novartis, Takeda, Roche, Sanofi, GSK, AbbVie, and Karyopharm. S.Z.U. received research support and personal fees from Amgen, Celgene, Sanofi, Seattle Genetics, Janssen, Takeda, SkylineDX, and Merck; received personal fees from AbbVie and MundiPharma; and received research support from Bristol Myers Squibb and Pharmacyclics. K.W. received honoraria from and served as a consultant for Adaptive, AbbVie, Amgen, GSK, Celgene/Bristol Myers Squibb, Karyopharm, Takeda, Roche, Janssen, and Sanofi. M.A.D. received honoraria from Amgen, Takeda, Bristol Myers Squibb, Janssen, Celgene, and Beigene. H.A.-L. received honoraria from and served on a speakers bureau for Celgene, Amgen, Bristol Myers Squibb, Sanofi, and Janssen and received research funding from Celgene and Janssen. B.P. served as a consultant for and received honoraria from Amgen, Celgene/Bristol Myers Squibb, Janssen, and Takeda and received research support from Celgene/Bristol Myers Squibb, Sanofi, and Roche. N.J.B. received honoraria from and served as a consultant for AbbVie, Amgen, GSK, Janssen, and Karyopharm; received research funding, honoraria, and served as a consultant for Celgene/Bristol Myers Squibb; and received honoraria from Takeda. T.P. serves as an advisor for Janssen and Celgene. V.H. received honoraria from, served as a consultant for, and served on a speakers bureau for AbbVie, Amgen, Bristol Myers Squibb, Janssen, Sanofi, and Takeda. P.M. received honoraria from Celgene, Amgen, Janssen, AbbVie, and Sanofi. M.-V.M. received honoraria from and served on an advisory board for Janssen, Celgene, Amgen, Takeda, AbbVie, GSK, Adaptive, Roche, Genentech, Pfizer, and Regeneron. A.P. received honoraria from Sanofi; received honoraria and served on an advisory committee for Amgen, Celgene/Bristol Myers Squibb, and Janssen; and received research funding and honoraria from Takeda. S.I. received research funding and honoraria from Janssen, Takeda, Celgene, Ono, Sanofi, Bristol Myers Squibb, and Daiichi Sankyo and received research funding from Chugai, AbbVie, MSD, and Kyowa Kirin. T.F. served on a speakers bureau for Janssen, Bristol Myers Squibb, and Takeda; and served on advisory boards for Janssen, Bristol Myers Squibb, Takeda, Roche, Amgen, Karyopharm, Sanofi, and Oncopeptides. S.K. received research funding from and served as a consultant and on an advisory board for Celgene, Takeda, Janssen, AbbVie, Adaptive, KITE, and Medimmune/AstraZeneca; received research funding from Merck, Novartis, Roche, and Sanofi; and was an IRC member for Oncopeptides. N.W.C.J.v.d.D. received research support from and served on advisory boards for Janssen Pharmaceuticals, Amgen, Celgene, Novartis, and Bristol Myers Squibb; and served on advisory boards for Takeda, Roche, Bayer, and Servier. P.S. received research funding from Amgen, Celgene, Janssen, and Takeda; served on advisory boards and received honoraria from Amgen, Bristol Myers Squibb, Celgene, Janssen, SkylineDx, and Takeda. A.S. served as a consultant for, served on a speakers bureau for, and received research funding and honoraria from Janssen Cilag. M.K., C.H., J.W., R.K., S.S., and M.Q. are employees of Janssen and may hold stock. J.U. was an employee of Janssen at the time of study and may hold stock. N.M. received honoraria from and served on advisory boards for Bristol Myers Squibb, Amgen, Takeda, Karyopharm, and Novartis; received honoraria from and served as a consultant for Janssen, Legend, and AbbVie; received honoraria from Beigene for lectures; and received honoraria from, served as a consultant for, and is a stockholder in Oncoprep, Inc.
Correspondence: Michele Cavo, IRCCS Azienda Ospedaliero-Universitaria di Bologna, Istituto di Ematologia “Seràgnoli”, Dipartimento di Medicina Specialistica, Diagnostica e Sperimentale, Università di Bologna, 40138 Bologna, Italy; e-mail: michele.cavo@unibo.it.
The data sharing policy of Janssen Pharmaceutical Companies of Johnson & Johnson is available at https://www.janssen.com/clinical-trials/transparency. As noted on this site, requests for access to the study data can be submitted through the Yale Open Data Access project site at http://yoda.yale.edu.
There is a Blood Commentary on this article in this issue.
The online version of this article contains a data supplement.
The publication costs of this article were defrayed in part by page charge payment. Therefore, and solely to indicate this fact, this article is hereby marked “advertisement” in accordance with 18 USC section 1734.

This feature is available to Subscribers Only
Sign In or Create an Account Close Modal