

Key Points
miR-125b–mediated repression of the megakaryocytic transcription factor ARID3A synergizes with GATA1s to induce leukemia.
Restoring ARID3A expression relieves megakaryocytic differentiation arrest in megakaryoblastic leukemia.

Abstract
Given the plasticity of hematopoietic stem and progenitor cells, multiple routes of differentiation must be blocked in the the pathogenesis of acute myeloid leukemia, the molecular basis of which is incompletely understood. We report that posttranscriptional repression of the transcription factor ARID3A by miR-125b is a key event in the pathogenesis of acute megakaryoblastic leukemia (AMKL). AMKL is frequently associated with trisomy 21 and GATA1 mutations (GATA1s), and children with Down syndrome are at a high risk of developing the disease. The results of our study showed that chromosome 21–encoded miR-125b synergizes with Gata1s to drive leukemogenesis in this context. Leveraging forward and reverse genetics, we uncovered Arid3a as the main miR-125b target behind this synergy. We demonstrated that, during normal hematopoiesis, this transcription factor promotes megakaryocytic differentiation in concert with GATA1 and mediates TGFβ-induced apoptosis and cell cycle arrest in complex with SMAD2/3. Although Gata1s mutations perturb erythroid differentiation and induce hyperproliferation of megakaryocytic progenitors, intact ARID3A expression assures their megakaryocytic differentiation and growth restriction. Upon knockdown, these tumor suppressive functions are revoked, causing a blockade of dual megakaryocytic/erythroid differentiation and subsequently of AMKL. Inversely, restoring ARID3A expression relieves the arrest of megakaryocytic differentiation in AMKL patient-derived xenografts. This work illustrates how mutations in lineage-determining transcription factors and perturbation of posttranscriptional gene regulation can interact to block multiple routes of hematopoietic differentiation and cause leukemia. In AMKL, surmounting this differentiation blockade through restoration of the tumor suppressor ARID3A represents a promising strategy for treating this lethal pediatric disease.
Introduction
Acute myeloid leukemia (AML) is a hematologic malignancy characterized by the uncontrolled proliferation of immature progenitor cells, which are blocked from differentiating into normal blood cells. Given the plasticity of hematopoietic stem/progenitor cells (HSPCs), multiple routes of differentiation must be blocked during the pathogenesis of AML, the molecular basis of which is incompletely understood. The role of perturbed posttranscriptional gene regulation in leukemic differentiation arrest remains unknown. Understanding how these altered processes cause leukemic transformation is crucial for developing strategies to overcome the differentiation blockade in AML and for designing related therapeutic concepts, an approach that has successfully been applied to acute promyelocytic leukemia.1
Acute megakaryoblastic leukemia (AMKL) is an aggressive subtype of AML. Acquired trisomy 21 is a common feature of AMKL,2 and children with Down syndrome are at a high risk of developing this disease. Megakaryoblastic leukemia of Down syndrome (ML-DS) is characterized by mutations in the hematopoietic transcription factor GATA1, which occur in fetal HSPCs and cause the exclusive expression of an N-terminal truncated protein known as GATA1s, hereinafter referred to as GATA1s mutations.3-5 Notably, ML‐DS pathogenesis involves a stepwise clonal progression from a transient form of leukemia called transient abnormal myelopoiesis (TAM), which occurs in ∼30% of neonates with Down syndrome. Today it is widely accepted that the interplay between trisomy 21, fetal origin and GATA1s is necessary and sufficient to cause TAM, as none of these elements lead to a TAM‐like phenotype alone,4,6-8 yet no additional events/factors are necessary.9,10 During fetal development, GATA1s induces hyperproliferation of human and murine megakaryocytic progenitor cells, but leaves their capacity to differentiate into normal megakaryocytes intact.4,11 Meanwhile, Gata1s causes anemia in murine fetuses and interferes with normal erythroid differentiation,3,4 and GATA1s mutations are seen in patients with Diamond-Blackfan anemia.12 These data suggest that both the erythroid and megakaryocytic differentiation paths are perturbed by the interplay between GATA1s and trisomy 21 and that this combination causes TAM and subsequently ML-DS. Despite the apparent simplicity of this model, the factors on chromosome 21 that underlie this synergy remain enigmatic.13-19 Identifying oncogenic factors on chromosome 21 will also be pertinent to deciphering its role in perturbed differentiation and leukemogenesis beyond ML-DS.13
Chromosome 21 harbors the phylogenetically conserved miR‐99a-125b cluster, which encodes the microRNAs (miRNAs) let-7c, miR-99a, and miR-125b.20 All 3 are jointly transcribed as a polycistron and are highly expressed in TAM, ML-DS, and non-DS AMKL.20 miR-125b was first described as an oncogenic miRNA in ML-DS21 and other types of AML.22,23 However, the role of the miRNA tricistron in TAM/ML-DS pathogenesis and its function in perturbed differentiation have remained an open question. Herein, we resolve the interplay between GATA1s mutations and the miR‐99a-125b cluster and propose a mechanism through which arrest of dual erythroid/megakaryocytic differentiation is achieved in TAM/ML-DS and AMKL. By systematically dissecting the targetome of miR-125b, the dominant oncogenic member of the cluster in this context, we establish ARID3A as a transcriptional activator that promotes megakaryocytic differentiation in concert with GATA1. Not only do these insights enhance our understanding of the complex regulation of normal hematopoiesis, they also shed light on the interplay between posttranscriptional regulators of gene expression and known oncogenic drivers during leukemic differentiation blockade, as well as during the initiation and progression of cancer.
Methods
Reagents and resources
Supplemental Table 1 (available on the Blood Web site) contains a list of all relevant reagents.
Patient samples
Pediatric AML samples were collected from patients enrolled in the AML Berlin-Frankfurt-Münster treatment protocols for children and adolescents. Written informed consent was obtained from all patients and custodians in accordance with the Declaration of Helsinki and local laws and regulations, and the study was approved by the institutional review boards of all participating centers. For details, see supplemental Table 2.
Animal studies
All experimental procedures involving mice were performed in accordance with protocols approved by the local authorities (Landesverwaltungsamt Niedersachsen/Sachsen-Anhalt). B6J.129(Cg)-Gt(ROSA)26Sortm1.1(CAG-cas9*,-EGFP)Fezh/J) (Jackson Laboratory, RRID: IMSR_JAX:026179), C57BL/6J (Charles River, RRID: IMSR_JAX:000664) and C;129S4-Rag2tm1.1FlvCsf1tm1(CSF1)Flv Csf2/Il3tm1.1(CSF2,IL3)FlvThpotm1.1(TPO)FlvIl2rgtm1.1FlvTg(SIRPA)1Flv/J (MISTRG) mice (Regeneron Pharmaceuticals)24 were maintained in a specific pathogen-free environment in individual ventilated cages and fed with autoclaved food and water at the Martin-Luther-University Halle-Wittenberg. Fetal liver isolation was performed as previously described.9 Syngeneic transplantation and patient-derived xenograft protocols have been described.9,25
Statistical analysis
All statistical analyses were performed with GraphPad Prism 8. Statistical analyses of experiments were performed with 2-tailed Student t tests for comparisons between 2 groups and analysis of variance (ANOVA) with Bonferroni post hoc analysis for comparisons between ≥3 groups. Survival was determined using the Kaplan-Meier method and analyzed using log-rank (Mantel-Cox) tests. A value of P < .05 was considered statistically significant. All statistical tests and sample numbers are disclosed in the respective figure legends and supplemental tables.
Additional and detailed descriptions of procedures can be found in supplemental Methods.
Results
miR-125b cooperates with Gata1s to induce megakaryoblastic leukemia
We previously generated a murine model of Gata1s-driven preleukemia, in which we introduce the Gata1s mutation in the fetal context using the CRISPR-Cas9 system.9 The generated Gata1s fetal liver cells (FLCs) show a hyperproliferative phenotype, but unperturbed terminal megakaryocytic differentiation in vitro.4 Importantly, upon transplantation into syngeneic recipients (C57BL/6J), Gata1s FLCs become abundant in the peripheral blood and then disappear over time.9 Thus, our murine preleukemic model constitutes a suitable platform to study and identify GATA1s-cooperating events, and we leveraged this system in combination with fluorescence-based lentiviral barcoding to dissect the role of miR-99a, let-7c, and miR-125b, the members of the miR‐99a-125b tricistron, in TAM/ML-DS pathogenesis. Each of the miRNAs was associated with a reporter fluorescent protein (dTomato, GFP, or mTagBFP2), which enabled monitoring and competition between all possible miRNA permutations (Figure 1A; supplemental Figure 1A-C). This experimental setup revealed major synergy between Gata1s and miR-125b, leading to a massive expansion of FLCs (Figure 1A; supplemental Figure 1A-E) that was mildly attenuated by the addition of let-7c and/or miR-99a (supplemental Figure 1B-C). This finding was corroborated using an all-in-one vector system (supplemental Figure 1D-E) and is in line with our previous study showing that let-7c and miR-99a prevent the exhaustion of miR-125b transduced hematopoietic stem cells.20 miR-125b further enhanced the Gata1s-induced expansion of CD117+ stem/progenitor cells, including CD117+CD41+ megakaryocytic progenitors (Figure 1B; supplemental Figure 1F-G). Correspondingly, the fraction of mature CD41+CD42d+ megakaryocytes was reduced, implying perturbed megakaryocytic differentiation, whereas erythroid differentiation was enhanced (Figure 1B). In methylcellulose-based colony forming unit (CFU) assays solely containing thrombopoietin (Thpo), Gata1s-miR-125b FLCs generated megakaryocyte-like CFUs with replating potential, in contrast to Gata1s control cells (Figure 1C-D). Complete cytokine conditions led to the formation of fewer but larger CFUs, including colonies with blast-like features, in Gata1s-miR-125b FLCs (Figure 1C; supplemental Figure 1H-I), with a nonsignificant increase of erythroid colonies (CFU-E/BFU-E, P = .12; Figure 1E).
![miR-125b cooperates with Gata1s to induce leukemia in vivo. (A) In vitro and in vivo setup for modeling synergy between Gata1s and the members of the miR-99a-125b tricistron (left). Percentage of Gata1s FLCs transduced with different miRNA permutations (marked by dTomato [miR-125b], mTagBFP2 [let-7c], and GFP [miR-99a]) normalized to that on day 0 (n = 4; 1-way ANOVA) (right). (B) Bar graph showing the percentage of stem/progenitor cells (CD117+), mature megakaryocytes (MK, CD41+CD42d+), and erythroid cells (ERY, CD71+Ter-119+) after 6 days of differentiation. Cells shown are Gata1s FLCs transduced with miR-125b or miR-ctrl (n = 3, paired Student t test). (C) Representative methylcellulose-based CFU assays from 1 of 4 independent experiments. Gata1s FLCs transduced with miR-ctrl or miR-125b are depicted in complete or low (Thpo 20 ng/mL) cytokine conditions. (D) The number of megakaryocyte colonies after serial replating of miR-125b Gata1s FLCs in methylcellulose-based medium with low (Thpo 20 ng/mL) cytokine conditions, compared with miR-ctrl Gata1s FLCs (n = 4, unpaired Student t test). (E) Classification of colonies after plating miR-125b or miR-ctrl Gata1s FLCs in methylcellulose-based CFU assays under complete cytokine conditions (n = 2, 2-way ANOVA). Combined granulocytic (CFU-G) and monocytic (CFU-M) CFUs: granulocytic/monocytic (CFU-G/M); and CFU/BFU-E, erythroid. (F-H) Analysis of mouse recipients of Gata1s FLCs overexpressing miR-125b or miR-ctrl (n = 10 per group), including comparisons of Kaplan-Meier survival curves (log-rank test) (F), spleen weights (unpaired Student t test) (G), and representative flow cytometry plots of bone marrow–derived leukemic cells (H) in the diseased mice. miR-125b–overexpressing Gata1s FLC-derived blasts are highlighted in red. The average percentage of miR-125b+ blasts belonging to each immunophenotype is indicated in each corresponding gate. Data are the mean ± standard deviation. FP+, fluorescent protein positive; n.s., not significant.](https://ash.silverchair-cdn.com/ash/content_public/journal/blood/139/5/10.1182_blood.2021012231/3/m_bloodbld2021012231f1.png?Expires=1768780400&Signature=4re1fRnoeawPrAOIpyWZFhykA8-ta2SkgcK02BlUx~sl4qAeOPemJN3Q-eSZ~VJ9tVCsAJAlMLiJM-HYSZ1YDHxQ0X6LNOadmEjSTsk4yLxweO1b~rRz07HBpfykKq0hw8zVfNWRtd567zz5MncNoEAwSSBjey6sM~AmecRTJe87xarGs22S-shUJq25zdhn7BTogu03YS74sNbl78hKrmS0ADDOFjuDhBZmOKwMxkno8A2BeEHRDTj6Pr~klKWyFqeXZJKF8oQ-wS3OYDrDtQ1hNbFc9FfjM8h76qbLgxr-OrzvQOS06S0L2fg33WmL2X50DFtLgnNvlMAFstUCjA__&Key-Pair-Id=APKAIE5G5CRDK6RD3PGA)
miR-125b cooperates with Gata1s to induce leukemia in vivo. (A) In vitro and in vivo setup for modeling synergy between Gata1s and the members of the miR-99a-125b tricistron (left). Percentage of Gata1s FLCs transduced with different miRNA permutations (marked by dTomato [miR-125b], mTagBFP2 [let-7c], and GFP [miR-99a]) normalized to that on day 0 (n = 4; 1-way ANOVA) (right). (B) Bar graph showing the percentage of stem/progenitor cells (CD117+), mature megakaryocytes (MK, CD41+CD42d+), and erythroid cells (ERY, CD71+Ter-119+) after 6 days of differentiation. Cells shown are Gata1s FLCs transduced with miR-125b or miR-ctrl (n = 3, paired Student t test). (C) Representative methylcellulose-based CFU assays from 1 of 4 independent experiments. Gata1s FLCs transduced with miR-ctrl or miR-125b are depicted in complete or low (Thpo 20 ng/mL) cytokine conditions. (D) The number of megakaryocyte colonies after serial replating of miR-125b Gata1s FLCs in methylcellulose-based medium with low (Thpo 20 ng/mL) cytokine conditions, compared with miR-ctrl Gata1s FLCs (n = 4, unpaired Student t test). (E) Classification of colonies after plating miR-125b or miR-ctrl Gata1s FLCs in methylcellulose-based CFU assays under complete cytokine conditions (n = 2, 2-way ANOVA). Combined granulocytic (CFU-G) and monocytic (CFU-M) CFUs: granulocytic/monocytic (CFU-G/M); and CFU/BFU-E, erythroid. (F-H) Analysis of mouse recipients of Gata1s FLCs overexpressing miR-125b or miR-ctrl (n = 10 per group), including comparisons of Kaplan-Meier survival curves (log-rank test) (F), spleen weights (unpaired Student t test) (G), and representative flow cytometry plots of bone marrow–derived leukemic cells (H) in the diseased mice. miR-125b–overexpressing Gata1s FLC-derived blasts are highlighted in red. The average percentage of miR-125b+ blasts belonging to each immunophenotype is indicated in each corresponding gate. Data are the mean ± standard deviation. FP+, fluorescent protein positive; n.s., not significant.
miR-125b cooperates with Gata1s to induce leukemia in vivo. (A) In vitro and in vivo setup for modeling synergy between Gata1s and the members of the miR-99a-125b tricistron (left). Percentage of Gata1s FLCs transduced with different miRNA permutations (marked by dTomato [miR-125b], mTagBFP2 [let-7c], and GFP [miR-99a]) normalized to that on day 0 (n = 4; 1-way ANOVA) (right). (B) Bar graph showing the percentage of stem/progenitor cells (CD117+), mature megakaryocytes (MK, CD41+CD42d+), and erythroid cells (ERY, CD71+Ter-119+) after 6 days of differentiation. Cells shown are Gata1s FLCs transduced with miR-125b or miR-ctrl (n = 3, paired Student t test). (C) Representative methylcellulose-based CFU assays from 1 of 4 independent experiments. Gata1s FLCs transduced with miR-ctrl or miR-125b are depicted in complete or low (Thpo 20 ng/mL) cytokine conditions. (D) The number of megakaryocyte colonies after serial replating of miR-125b Gata1s FLCs in methylcellulose-based medium with low (Thpo 20 ng/mL) cytokine conditions, compared with miR-ctrl Gata1s FLCs (n = 4, unpaired Student t test). (E) Classification of colonies after plating miR-125b or miR-ctrl Gata1s FLCs in methylcellulose-based CFU assays under complete cytokine conditions (n = 2, 2-way ANOVA). Combined granulocytic (CFU-G) and monocytic (CFU-M) CFUs: granulocytic/monocytic (CFU-G/M); and CFU/BFU-E, erythroid. (F-H) Analysis of mouse recipients of Gata1s FLCs overexpressing miR-125b or miR-ctrl (n = 10 per group), including comparisons of Kaplan-Meier survival curves (log-rank test) (F), spleen weights (unpaired Student t test) (G), and representative flow cytometry plots of bone marrow–derived leukemic cells (H) in the diseased mice. miR-125b–overexpressing Gata1s FLC-derived blasts are highlighted in red. The average percentage of miR-125b+ blasts belonging to each immunophenotype is indicated in each corresponding gate. Data are the mean ± standard deviation. FP+, fluorescent protein positive; n.s., not significant.
Most important, upon transplantation into syngeneic C57BL/6J recipients, miR-125b-transduced Gata1s FLCs caused high-penetrance (90%) megakaryoblastic leukemia after a latency of 39 days (median disease-free survival; Figure 1F-H; supplemental Figure 1J). Leukemic blasts engrafted and induced leukemia in secondary recipients with 100% penetrance, underlining the leukemic potential of the Gata1s-miR-125b combination (supplemental Figure 1K-L). These results from the murine Gata1s preleukemic model concur with those in our previous study,21 and confirm miR‐125b as the dominant oncogenic driver of the miR‐99a-125b tricistron’s synergy with Gata1s in FLCs. The combination of miR-125b and Gata1s in FLCs caused megakaryocytic leukemia in vivo, recapitulating ML-DS or an aggressive form of TAM in humans.
shRNA-based positive selection screening in combination with RNA-sequencing identifies miR-125b targets that synergize with Gata1s
To identify downstream targets of miR-125b that mediate its synergy with Gata1s, we performed an in vitro short hairpin RNA (shRNA)‐based positive selection screening probing 220 predicted miR‐125b targets that are downregulated by miR-125b in HSPCs (Figure 2A; supplemental Table 3).20,26 Next-generation sequencing–based shRNA quantification 4 and 30 days after transduction, followed by MAGeCK analysis,27 revealed a continuous significant enrichment of shRNAs targeting 13 candidate genes (Figure 2A; supplemental Figure 2A; supplemental Table 4). We complemented the screening with RNA-sequencing (RNA-seq) after switching miR-125b expression on and off by using a doxycycline-inducible lentiviral expression system. Notably, this system achieves physiological miR-125b expression levels similar to those observed in ML-DS samples and produces a hyperproliferative phenotype in Gata1s FLCs comparable to that of constitutive expression (Figure 2B; supplemental Figures 1F and 2B). We showed that sustained miR-125b expression (eg, continuous addition of doxycycline) is necessary for the enhanced proliferation of Gata1s FLCs and related transcriptional changes, such as the induction of ML-DS–like expression signatures28 and of MYC target genes29 (Figure 2B; supplemental Figure 2C; supplemental Table 5). Hence, candidate targets of miR-125b should be downregulated upon miR-125b induction (doxycycline addition) and reexpressed after miR-125b release (doxycycline withdrawal). Only 1 candidate followed this expression pattern, in addition to being significantly enriched in the shRNA screening: the transcription factor gene Arid3a (Figure 2C). The convergence of these 2 complementary approaches implicates Arida3 as the primary player in the synergy between miR-125b and Gata1s.
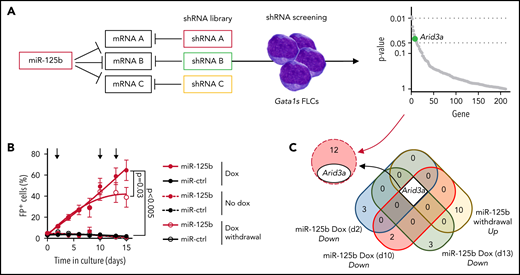
shRNA-based positive selection screening in combination with RNA-seq identifies miR-125b targets that synergize with Gata1s. (A) shRNA+ selection screening, in which a pool of shRNAs directed against miR-125b target genes was used to mimic the effect of miR-125b (left). Dot plot showing significantly enriched shRNA-targeted genes (right). Significance was defined as P < .05 (n = 12). Arid3a is highlighted in green. (B) The percentage of Gata1s FLCs expressing doxycycline-regulated miR-125b or miR-ctrl upon addition and removal of doxycycline (500 ng/mL). Arrows indicate time points used for gene expression analysis. Data are the mean ± standard error of the mean (n = 4, paired Student t test). FP+, fluorescent protein positive. (C) Venn diagram of differentially expressed genes after miR-125b modulation (compared with miR-ctrl), overlapping with the 13 enriched genes from the shRNA+ selection screen in panel A.
shRNA-based positive selection screening in combination with RNA-seq identifies miR-125b targets that synergize with Gata1s. (A) shRNA+ selection screening, in which a pool of shRNAs directed against miR-125b target genes was used to mimic the effect of miR-125b (left). Dot plot showing significantly enriched shRNA-targeted genes (right). Significance was defined as P < .05 (n = 12). Arid3a is highlighted in green. (B) The percentage of Gata1s FLCs expressing doxycycline-regulated miR-125b or miR-ctrl upon addition and removal of doxycycline (500 ng/mL). Arrows indicate time points used for gene expression analysis. Data are the mean ± standard error of the mean (n = 4, paired Student t test). FP+, fluorescent protein positive. (C) Venn diagram of differentially expressed genes after miR-125b modulation (compared with miR-ctrl), overlapping with the 13 enriched genes from the shRNA+ selection screen in panel A.
Arid3a knockdown mimics the miR-125b phenotype in Gata1s FLCs
Next, we sought to validate Arid3a as the primary target of miR-125b in this context. We confirmed repression of ARID3A at the protein level, as well as direct targeting of the Arid3a/ARID3A 3'UTR by miR-125b (supplemental Figure 3A-D). Knockdown of Arid3a in Gata1s FLCs by using 2 efficient (shArid3a #2 and shArid3a #3; supplemental Figure 3A; supplemental Table 6) mimicked the miR-125b proproliferative phenotype and arrest of megakaryocytic differentiation (Figure 3A-B). In CFU assays containing Thpo only, Arid3a knockdown resulted in the formation of megakaryocyte-like CFUs with high replating potential (Figure 3C-D; supplemental Figure 3E), whereas, in complete cytokine conditions, knockdown of Arid3a led to a nonsignificant increase in erythroid colonies (CFU-E/BFU-E; P = .29) and larger colony size (supplemental Figure 3F-H). Inversely, restoring Arid3a levels in Gata1s-miR-125b FLCs via overexpression of complementary DNA (cDNA) reestablished megakaryocytic differentiation while impeding miR-125b–driven proliferation (Figure 3E-F) and CFU formation (Thpo only; Figure 3G-H). Most important, knockdown of Arid3a in Gata1s FLCs was sufficient to recapitulate the miR-125b–induced leukemic phenotype in vivo, leading to the development of CD117+CD41+ megakaryoblastic leukemia with a short latency of 71 days (median disease-free survival; P = .02), accompanied by marked splenomegaly and blast infiltration of the spleen and liver (Figure 3I-K; supplemental Figure 3I). These results strongly implicate Arid3a as the main target of miR-125b that drives its synergy with Gata1s during leukemogenesis in vitro and in vivo.
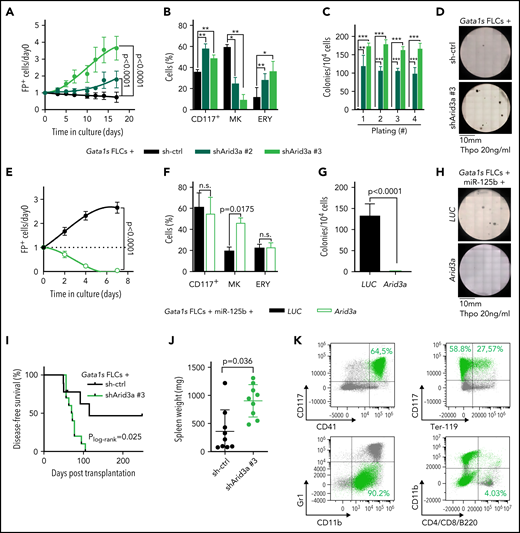
Arid3a knockdown mimics the miR-125b phenotype in Gata1s FLCs. (A) Percentage of transduced (sh-ctrl or shArid3a #2 or #3) Gata1s FLCs compared with that on day 0 (n = 4, 2-way ANOVA). (B) Percentage of stem/progenitor cells (CD117+), mature megakaryocytes (MK, CD41+ CD42d+), and erythroid cells (ERY, CD71+Ter-119+) in transduced (sh-ctrl or shArid3a #2 or #3) Gata1s FLCs after 6 days of differentiation (n = 3, paired Student t test). (C-D) Serial replating of transduced (sh-ctrl or shArid3a #2 or #3) Gata1s FLCs in methylcellulose-based medium with low concentrations of Thpo (20 ng/mL). (C) The number of megakaryocyte colonies, with the serial replating number on the x-axis (n = 4, 2-way ANOVA) (C), alongside a representative image from the first plating of 4 independent experiments (D). (E) Percentage of cDNA-transduced (Arid3a or LUC) miR-125b-Gata1s FLCs normalized to that on day 0 (n = 4, unpaired Student t test). (F) Percentage of stem/progenitor cells (CD117+), mature megakaryocytes (MK, CD41+CD42d+), and erythroid cells (ERY, CD71+Ter-119+) in cDNA-transduced (Arid3a or LUC) miR-125b-Gata1s FLCs after 6 days of differentiation (n = 3, paired Student t-test). (G-H) Methylcellulose-based colony-forming assays of cDNA-transduced (Arid3a or LUC) miR-125b Gata1s FLCs in low Thpo conditions (20 ng/mL; n = 4, unpaired Student t test). (G) The number of colonies (depicted in panel H) alongside a representative image from 4 independent experiments. (I-K) Analysis of C57BL/6J recipients of shRNA-transduced (sh-ctrl or shArid3a) Gata1s FLCs, including Kaplan-Meier survival curves (log-rank test) (I), spleen weights (unpaired Student t test) (J), and representative flow cytometry plots of BM-derived leukemic cells from the diseased mice (K). shArid3a-expressing Gata1s FLC–derived blasts are highlighted in green. The average percentage of shArid3a+ blasts belonging to each immunophenotype is indicated in the corresponding gate. All data are presented as the mean ± standard deviation. *P < .05; **P < .01; ***P < .001. FP+, fluorescent protein positive; n.s., not significant.
Arid3a knockdown mimics the miR-125b phenotype in Gata1s FLCs. (A) Percentage of transduced (sh-ctrl or shArid3a #2 or #3) Gata1s FLCs compared with that on day 0 (n = 4, 2-way ANOVA). (B) Percentage of stem/progenitor cells (CD117+), mature megakaryocytes (MK, CD41+ CD42d+), and erythroid cells (ERY, CD71+Ter-119+) in transduced (sh-ctrl or shArid3a #2 or #3) Gata1s FLCs after 6 days of differentiation (n = 3, paired Student t test). (C-D) Serial replating of transduced (sh-ctrl or shArid3a #2 or #3) Gata1s FLCs in methylcellulose-based medium with low concentrations of Thpo (20 ng/mL). (C) The number of megakaryocyte colonies, with the serial replating number on the x-axis (n = 4, 2-way ANOVA) (C), alongside a representative image from the first plating of 4 independent experiments (D). (E) Percentage of cDNA-transduced (Arid3a or LUC) miR-125b-Gata1s FLCs normalized to that on day 0 (n = 4, unpaired Student t test). (F) Percentage of stem/progenitor cells (CD117+), mature megakaryocytes (MK, CD41+CD42d+), and erythroid cells (ERY, CD71+Ter-119+) in cDNA-transduced (Arid3a or LUC) miR-125b-Gata1s FLCs after 6 days of differentiation (n = 3, paired Student t-test). (G-H) Methylcellulose-based colony-forming assays of cDNA-transduced (Arid3a or LUC) miR-125b Gata1s FLCs in low Thpo conditions (20 ng/mL; n = 4, unpaired Student t test). (G) The number of colonies (depicted in panel H) alongside a representative image from 4 independent experiments. (I-K) Analysis of C57BL/6J recipients of shRNA-transduced (sh-ctrl or shArid3a) Gata1s FLCs, including Kaplan-Meier survival curves (log-rank test) (I), spleen weights (unpaired Student t test) (J), and representative flow cytometry plots of BM-derived leukemic cells from the diseased mice (K). shArid3a-expressing Gata1s FLC–derived blasts are highlighted in green. The average percentage of shArid3a+ blasts belonging to each immunophenotype is indicated in the corresponding gate. All data are presented as the mean ± standard deviation. *P < .05; **P < .01; ***P < .001. FP+, fluorescent protein positive; n.s., not significant.
ARID3A promotes terminal megakaryocytic differentiation
ARID3A has been extensively studied in the B-cell lineage, including in the context of miR-125b,30 where it upregulates IgH transcription in activated B cells.31 More recent reports have highlighted its role in myelopoiesis.32Arid3a knockout at the fetal stage severely impairs erythropoiesis33; inversely, high levels of ARID3A reduced the number of immature and mature myeloid cells including erythroid cells.32 Gene expression analysis of stringently sorted blood cells (R.B. and J.-H.K, unpublished data) showed that ARID3A expression is elevated in megakaryocytes compared with erythroid cells and CD34+ HSPCs (Figure 4A), indicating that ARID3A may also act as a regulator of megakaryopoiesis. Indeed, shRNA-mediated knockdown of Arid3a enhanced the colony-forming and replating capacity of wild-type FLCs in the presence of Thpo, and impaired terminal megakaryocytic differentiation in liquid culture (Figure 4B-C). Inversely, Arid3a overexpression promoted megakaryocytic differentiation at the expense of erythroid differentiation (Figure 4D), which was also evident in CFU assays (Figure 4E; supplemental Figure 4A). To verify the effects of Arid3a on megakaryopoiesis and erythropoiesis in vivo, we transplanted shRNA-transduced FLCs into lethally irradiated syngeneic recipients. After 16 weeks, we observed a marked increase in the percentage of CD71+Ter-119+ early and CD71−Ter-119+ late erythroblasts,34 as well as of CD41+CD42d− immature megakaryocytes in the bone marrow of the recipient mice, whereas the percentage of CD41+CD42d+ mature megakaryocytes was not significantly changed (Figure 4F). Other lineages were not affected (supplemental Figure 4B).
![ARID3A promotes terminal megakaryocytic differentiation. (A) ARID3A expression (reads per kilobase of transcript per million mapped reads, RPKM) in sorted HSPCs (peripheral blood [PB] mobilized CD34+ cells; n = 4), megakaryocyte (MK; CD41+CD61+; n = 3), and erythroid cells (CD71+, n = 3) derived from PB CD34+ HSPCs after 7 days of differentiation in megakaryocyte- or erythroid-promoting culture conditions (1-way ANOVA). (B) Colony counts after replating sh-ctrl-, miR-125b-, or shArid3a-transduced murine FLCs in low Thpo methylcellulose-based CFU assays (n = 6; 2-way ANOVA). The serial replating number is shown on the x-axis. (C-D) Ratio of terminal megakaryocyte (MK, CD41+CD42d+) and erythroid cells (ERY, CD71+Ter-119+) in shArid3a- vs sh-ctrl-transduced murine FLCs (C) and in Arid3a- vs LUC-transduced FLCs (D) after 6 and 4 days of differentiation, respectively (n = 3; paired Student t test). (E) Classification of colonies after plating cDNA-transduced (Arid3a or LUC) murine FLCs in methylcellulose-based CFU assays under complete cytokine conditions (n = 3; 2-way ANOVA). CFU-G/M: granulocytic (CFU-G), monocytic (CFU-M) and granulocytic/monocytic (CFU-GM); CFU/BFU-E: erythroid. (F) Dot plot showing the percentage of mature megakaryocytes (mature MK, CD41+CD42d+), immature megakaryocytes (Immature MK, CD41+CD42−), early erythroblasts (ProE I, CD71+Ter-119+), and late erythroblasts (ProE II, CD71−Ter-119+) in the BM of mouse recipients of shRNA-transduced Ter-119− FLCs (sh-ctrl or shArid3a). shRNA+ cells shown (n = 5, unpaired Student t test). (G) Percentage of differentiated cells after transduction of human PB CD34+ HSPCs with ARID3A cDNA, normalized to LUC-transduced HSPCs (n = 6; paired Student t test). Percentage of mature megakaryocytes (CD41+/CD61+/CD42+) after 11 days in medium promoting megakaryocytic differentiation (left). Percentage of mature erythroid cells (CD71+CD235a+) after 7 days in medium promoting erythroid differentiation (right). (H) Classification of colonies after plating ARID3A- or LUC-expressing human PB CD34+ HSPCs in methylcellulose-based CFU assays under complete cytokine conditions (n = 6, 2-way ANOVA). (I) Percentage of terminally differentiated cells after transduction of human PB CD34+ HSPCs with shRNAs targeting ARID3A, normalized to sh-ctrl (n = 3; paired Student t test). Percentage of mature megakaryocytes (CD41+CD61+CD42+) after 11 days in medium promoting megakaryocytic differentiation (left). Percentage of mature erythroid cells (CD71+CD235a+) after 7 days in medium promoting erythroid differentiation (right). Data are presented as the mean ± standard deviation. n.s., not significant.](https://ash.silverchair-cdn.com/ash/content_public/journal/blood/139/5/10.1182_blood.2021012231/3/m_bloodbld2021012231f4.png?Expires=1768780400&Signature=c-rU3o~-JuqnLjC7sSSFynwUijiYKC4NNhKvSRh1RM8zmYMz6siYQQIvTKJDMKGF88OyNlWHrES0bfJFVQhYrsD7LTDWe1epdmx-ZCX~SxW1q6SBsiCLSO91GQfPAR8zjJZDDN6-RHWbqIdqaaDFhbkGfl8Pz5NuIA-RdDa0~9bKo~lkMzzGTawOt9yzH3L13aoiLgLX2taLxl827bhoVDJZL9vl0mpDc1PGV~kWUUp5QJkHmAfjOBRLUX~Pwr5cbja-quAWvLgjxGNlbmkZUiWNa0KaLrSqbCn6IhdD3M70NmBijxDNyT2G7ROJpS2SRqMG-kK91wv46j4RbaFOWA__&Key-Pair-Id=APKAIE5G5CRDK6RD3PGA)
ARID3A promotes terminal megakaryocytic differentiation. (A) ARID3A expression (reads per kilobase of transcript per million mapped reads, RPKM) in sorted HSPCs (peripheral blood [PB] mobilized CD34+ cells; n = 4), megakaryocyte (MK; CD41+CD61+; n = 3), and erythroid cells (CD71+, n = 3) derived from PB CD34+ HSPCs after 7 days of differentiation in megakaryocyte- or erythroid-promoting culture conditions (1-way ANOVA). (B) Colony counts after replating sh-ctrl-, miR-125b-, or shArid3a-transduced murine FLCs in low Thpo methylcellulose-based CFU assays (n = 6; 2-way ANOVA). The serial replating number is shown on the x-axis. (C-D) Ratio of terminal megakaryocyte (MK, CD41+CD42d+) and erythroid cells (ERY, CD71+Ter-119+) in shArid3a- vs sh-ctrl-transduced murine FLCs (C) and in Arid3a- vs LUC-transduced FLCs (D) after 6 and 4 days of differentiation, respectively (n = 3; paired Student t test). (E) Classification of colonies after plating cDNA-transduced (Arid3a or LUC) murine FLCs in methylcellulose-based CFU assays under complete cytokine conditions (n = 3; 2-way ANOVA). CFU-G/M: granulocytic (CFU-G), monocytic (CFU-M) and granulocytic/monocytic (CFU-GM); CFU/BFU-E: erythroid. (F) Dot plot showing the percentage of mature megakaryocytes (mature MK, CD41+CD42d+), immature megakaryocytes (Immature MK, CD41+CD42−), early erythroblasts (ProE I, CD71+Ter-119+), and late erythroblasts (ProE II, CD71−Ter-119+) in the BM of mouse recipients of shRNA-transduced Ter-119− FLCs (sh-ctrl or shArid3a). shRNA+ cells shown (n = 5, unpaired Student t test). (G) Percentage of differentiated cells after transduction of human PB CD34+ HSPCs with ARID3A cDNA, normalized to LUC-transduced HSPCs (n = 6; paired Student t test). Percentage of mature megakaryocytes (CD41+/CD61+/CD42+) after 11 days in medium promoting megakaryocytic differentiation (left). Percentage of mature erythroid cells (CD71+CD235a+) after 7 days in medium promoting erythroid differentiation (right). (H) Classification of colonies after plating ARID3A- or LUC-expressing human PB CD34+ HSPCs in methylcellulose-based CFU assays under complete cytokine conditions (n = 6, 2-way ANOVA). (I) Percentage of terminally differentiated cells after transduction of human PB CD34+ HSPCs with shRNAs targeting ARID3A, normalized to sh-ctrl (n = 3; paired Student t test). Percentage of mature megakaryocytes (CD41+CD61+CD42+) after 11 days in medium promoting megakaryocytic differentiation (left). Percentage of mature erythroid cells (CD71+CD235a+) after 7 days in medium promoting erythroid differentiation (right). Data are presented as the mean ± standard deviation. n.s., not significant.
ARID3A promotes terminal megakaryocytic differentiation. (A) ARID3A expression (reads per kilobase of transcript per million mapped reads, RPKM) in sorted HSPCs (peripheral blood [PB] mobilized CD34+ cells; n = 4), megakaryocyte (MK; CD41+CD61+; n = 3), and erythroid cells (CD71+, n = 3) derived from PB CD34+ HSPCs after 7 days of differentiation in megakaryocyte- or erythroid-promoting culture conditions (1-way ANOVA). (B) Colony counts after replating sh-ctrl-, miR-125b-, or shArid3a-transduced murine FLCs in low Thpo methylcellulose-based CFU assays (n = 6; 2-way ANOVA). The serial replating number is shown on the x-axis. (C-D) Ratio of terminal megakaryocyte (MK, CD41+CD42d+) and erythroid cells (ERY, CD71+Ter-119+) in shArid3a- vs sh-ctrl-transduced murine FLCs (C) and in Arid3a- vs LUC-transduced FLCs (D) after 6 and 4 days of differentiation, respectively (n = 3; paired Student t test). (E) Classification of colonies after plating cDNA-transduced (Arid3a or LUC) murine FLCs in methylcellulose-based CFU assays under complete cytokine conditions (n = 3; 2-way ANOVA). CFU-G/M: granulocytic (CFU-G), monocytic (CFU-M) and granulocytic/monocytic (CFU-GM); CFU/BFU-E: erythroid. (F) Dot plot showing the percentage of mature megakaryocytes (mature MK, CD41+CD42d+), immature megakaryocytes (Immature MK, CD41+CD42−), early erythroblasts (ProE I, CD71+Ter-119+), and late erythroblasts (ProE II, CD71−Ter-119+) in the BM of mouse recipients of shRNA-transduced Ter-119− FLCs (sh-ctrl or shArid3a). shRNA+ cells shown (n = 5, unpaired Student t test). (G) Percentage of differentiated cells after transduction of human PB CD34+ HSPCs with ARID3A cDNA, normalized to LUC-transduced HSPCs (n = 6; paired Student t test). Percentage of mature megakaryocytes (CD41+/CD61+/CD42+) after 11 days in medium promoting megakaryocytic differentiation (left). Percentage of mature erythroid cells (CD71+CD235a+) after 7 days in medium promoting erythroid differentiation (right). (H) Classification of colonies after plating ARID3A- or LUC-expressing human PB CD34+ HSPCs in methylcellulose-based CFU assays under complete cytokine conditions (n = 6, 2-way ANOVA). (I) Percentage of terminally differentiated cells after transduction of human PB CD34+ HSPCs with shRNAs targeting ARID3A, normalized to sh-ctrl (n = 3; paired Student t test). Percentage of mature megakaryocytes (CD41+CD61+CD42+) after 11 days in medium promoting megakaryocytic differentiation (left). Percentage of mature erythroid cells (CD71+CD235a+) after 7 days in medium promoting erythroid differentiation (right). Data are presented as the mean ± standard deviation. n.s., not significant.
To corroborate our findings in the context of human hematopoiesis, we tested human CD34+ HSPCs. Under megakaryocytic differentiation conditions, ARID3A overexpression strongly promoted terminal differentiation, as determined by the presence of CD41+CD61+CD42b+ cells (Figure 4G). Inversely, under erythroid differentiation conditions, ARID3A caused a 60% reduction in mature CD71+CD235a+ erythroid cells (Figure 4G), and we observed a decrease in CFU/BFU-E in CFU assays (Figure 4H; supplemental Figure 4C). In contrast, shRNA-mediated knockdown of ARID3A impaired megakaryocytic differentiation (Figure 4I; supplemental Figure 4D; supplemental Table 6). These data reveal a previously unknown role for ARID3A in the regulation of megakaryocytic differentiation and confirm previous reports suggesting its negative impact on erythroid differentiation.32
ARID3A acts in concert with GATA1 to activate megakaryocytic transcriptional programs
Toward better defining the function of ARID3A during megakaryopoiesis and leukemogenesis, we proceeded with the molecular characterization of this transcription factor. To elucidate whether the observed effects were mediated by its activating or repressing function,35,36 we fused the KRAB inhibitor domain37 and the VP64 activator38 to the N terminus of ARID3A (supplemental Figure 5A). Lentiviral Arid3a expression reduced the proliferation of Gata1s FLCs, an effect that was further enhanced by the addition of VP64 and abrogated by the addition of KRAB (supplemental Figure 5B), suggesting that ARID3A acts mainly through transcriptional activation in this context. These data were supported by gene expression profiling of preleukemic Gata1s FLCs, as well as of Gata1s FLCs after doxycycline-induced knockdown (shArid3a) or overexpression of Arid3a (Figure 5A; supplemental Figure 5C-E). Moreover, we complemented these analyses with ARID3A chromatin occupancy information, which we obtained via CUT&RUN (cleavage under targets and release using nuclease)39 on miR-125b–transduced Gata1s FLCs with inducible expression of FLAG-tagged ARID3A. Differentially expressed genes occupied by ARID3A40 were mostly upregulated by Arid3a overexpression and downregulated by Arid3a knockdown (89.6% and 73.3%, respectively), including several megakaryocytic genes such as Mylk and Hpn41-43 (supplemental Figure 5F-H).
![ARID3A acts in concert with GATA1 to activate megakaryocytic transcriptional programs. (A) Characterizing the molecular function of ARID3A in TAM/ML-DS leukemogenesis via sequential Gata1s acquisition and Arid3a repression. Gata1s FLCs were expanded for 3 weeks and then transduced with Arid3a cDNA, shArid3a #3 or their respective controls. RNA samples were obtained from each of the 4 different conditions and subjected to RNA-seq–based gene expression analysis (n = 2-3). (B) Normalized enrichment scores for up- or downregulated gene sets involved in hematopoietic differentiation, cell proliferation, and ML-DS progression. Gata1s FLCs were compared against wild-type FLCs (top); Arid3a and shArid3a Gata1s FLCs were compared against their respective Gata1s FLCs controls (LUC or sh-ctrl) after doxycycline induction (bottom). *P < .05; **P < .01; ***P < .001. (C) GSEA enrichment plots showing genes downregulated by the Gata1s mutation in FLCs, and their response to Arid3a modulation in Gata1s FLCs. (D) Venn diagram showing the number of genomic regions bound by ARID3A and/or GATA1s. The data were generated using CUT&RUN after the doxycycline-induced Arid3a expression in miR-125b-expressing Gata1s FLCs. Significantly enriched peaks were called using SEACR (sparse enrichment analysis for CUT&RUN.40 (E) Heat maps depict the colocalization of ARID3A (green, left) and GATA1s (orange, middle) and chromatin accessibility (green, right) signals after doxycycline-induced Arid3a expression in miR-125b-expressing Gata1s FLCs. The data were generated by CUT&RUN (colocalization) and ATAC-seq (accessibility). Regions ±3 kb of the peak center are shown. Aggregate signals of single- and co-occupied regions are also provided (bottom; cobound [black] and ARID3A-bound only [green] are indicated). (F) Volcano plot showing the differential expression of ARID3A/GATA1s cobound genes after Arid3a knockdown in Gata1s FLCs.40 Genes involved in megakaryocytic differentiation (green), significantly downregulated (blue) and upregulated (red) genes, and nonsignificantly changed genes (gray). (G) IGV snapshots of megakaryocytic genes, showing co-occupancy by ARID3A and GATA1 and chromatin accessibility (ATAC). The tracks display coverage (RPKM) (left). Scale and chromosome location are shown (top). n.s., not significant.](https://ash.silverchair-cdn.com/ash/content_public/journal/blood/139/5/10.1182_blood.2021012231/3/m_bloodbld2021012231f5.png?Expires=1768780400&Signature=nZQBFvg2FKjWcN6ginV78hoD3qrYBN4ZI1540DBfIE4hJbPKfBqxDXXz2gt06op6d9M3OM86BgOk3Qz3P5ToSwaxF-Nm7RnRyW5kowKMQfsucFKVJCMucZsEexIxH7U24UtkTkqM4d6i85uOHltjCjvHfkLyaFdD1ftlzMX1CMxJ5S9spblI~w6xwIzR0GeQpQOllKmZVPUfGknIhANXxFvpUIVBbIywm6j5xFgg1~xebdfBMo4zYg1ShUkI1-kAgqSBCcRoetRvXPYJZDtlsauXPbRh3XxS59WbE2Saiep9SCPeBJG-AKJMj3k8UTsOcI~cf709-R57UbCkG0L7Bw__&Key-Pair-Id=APKAIE5G5CRDK6RD3PGA)
ARID3A acts in concert with GATA1 to activate megakaryocytic transcriptional programs. (A) Characterizing the molecular function of ARID3A in TAM/ML-DS leukemogenesis via sequential Gata1s acquisition and Arid3a repression. Gata1s FLCs were expanded for 3 weeks and then transduced with Arid3a cDNA, shArid3a #3 or their respective controls. RNA samples were obtained from each of the 4 different conditions and subjected to RNA-seq–based gene expression analysis (n = 2-3). (B) Normalized enrichment scores for up- or downregulated gene sets involved in hematopoietic differentiation, cell proliferation, and ML-DS progression. Gata1s FLCs were compared against wild-type FLCs (top); Arid3a and shArid3a Gata1s FLCs were compared against their respective Gata1s FLCs controls (LUC or sh-ctrl) after doxycycline induction (bottom). *P < .05; **P < .01; ***P < .001. (C) GSEA enrichment plots showing genes downregulated by the Gata1s mutation in FLCs, and their response to Arid3a modulation in Gata1s FLCs. (D) Venn diagram showing the number of genomic regions bound by ARID3A and/or GATA1s. The data were generated using CUT&RUN after the doxycycline-induced Arid3a expression in miR-125b-expressing Gata1s FLCs. Significantly enriched peaks were called using SEACR (sparse enrichment analysis for CUT&RUN.40 (E) Heat maps depict the colocalization of ARID3A (green, left) and GATA1s (orange, middle) and chromatin accessibility (green, right) signals after doxycycline-induced Arid3a expression in miR-125b-expressing Gata1s FLCs. The data were generated by CUT&RUN (colocalization) and ATAC-seq (accessibility). Regions ±3 kb of the peak center are shown. Aggregate signals of single- and co-occupied regions are also provided (bottom; cobound [black] and ARID3A-bound only [green] are indicated). (F) Volcano plot showing the differential expression of ARID3A/GATA1s cobound genes after Arid3a knockdown in Gata1s FLCs.40 Genes involved in megakaryocytic differentiation (green), significantly downregulated (blue) and upregulated (red) genes, and nonsignificantly changed genes (gray). (G) IGV snapshots of megakaryocytic genes, showing co-occupancy by ARID3A and GATA1 and chromatin accessibility (ATAC). The tracks display coverage (RPKM) (left). Scale and chromosome location are shown (top). n.s., not significant.
ARID3A acts in concert with GATA1 to activate megakaryocytic transcriptional programs. (A) Characterizing the molecular function of ARID3A in TAM/ML-DS leukemogenesis via sequential Gata1s acquisition and Arid3a repression. Gata1s FLCs were expanded for 3 weeks and then transduced with Arid3a cDNA, shArid3a #3 or their respective controls. RNA samples were obtained from each of the 4 different conditions and subjected to RNA-seq–based gene expression analysis (n = 2-3). (B) Normalized enrichment scores for up- or downregulated gene sets involved in hematopoietic differentiation, cell proliferation, and ML-DS progression. Gata1s FLCs were compared against wild-type FLCs (top); Arid3a and shArid3a Gata1s FLCs were compared against their respective Gata1s FLCs controls (LUC or sh-ctrl) after doxycycline induction (bottom). *P < .05; **P < .01; ***P < .001. (C) GSEA enrichment plots showing genes downregulated by the Gata1s mutation in FLCs, and their response to Arid3a modulation in Gata1s FLCs. (D) Venn diagram showing the number of genomic regions bound by ARID3A and/or GATA1s. The data were generated using CUT&RUN after the doxycycline-induced Arid3a expression in miR-125b-expressing Gata1s FLCs. Significantly enriched peaks were called using SEACR (sparse enrichment analysis for CUT&RUN.40 (E) Heat maps depict the colocalization of ARID3A (green, left) and GATA1s (orange, middle) and chromatin accessibility (green, right) signals after doxycycline-induced Arid3a expression in miR-125b-expressing Gata1s FLCs. The data were generated by CUT&RUN (colocalization) and ATAC-seq (accessibility). Regions ±3 kb of the peak center are shown. Aggregate signals of single- and co-occupied regions are also provided (bottom; cobound [black] and ARID3A-bound only [green] are indicated). (F) Volcano plot showing the differential expression of ARID3A/GATA1s cobound genes after Arid3a knockdown in Gata1s FLCs.40 Genes involved in megakaryocytic differentiation (green), significantly downregulated (blue) and upregulated (red) genes, and nonsignificantly changed genes (gray). (G) IGV snapshots of megakaryocytic genes, showing co-occupancy by ARID3A and GATA1 and chromatin accessibility (ATAC). The tracks display coverage (RPKM) (left). Scale and chromosome location are shown (top). n.s., not significant.
Next, we determined the gene expression changes induced by the Gata1s mutation in FLCs and the additive effects of Arid3a repression. As previously described,11,44 gene set enrichment analysis (GSEA)45 revealed a marked reduction of erythroid genes and concurrent activation of proproliferative genes, including MYC and E2F targets, upon introduction of the Gata1s mutation (Figure 5A-B; supplemental Table 7). On this background, knockdown of Arid3a impaired the expression of megakaryocytic genes, which was accompanied by a further amplification of proproliferative programs and induction of an ML-DS gene expression signature, whereas the opposite was true upon Arid3a overexpression (Figure 5B; supplemental Table 7). We note that these gene expression changes were highly reminiscent of those induced by miR-125b overexpression (supplemental Figure 2C). Interestingly, results of GSEA also indicated that Arid3a knockdown enhances the Gata1s gene expression signature. Genes that were downregulated upon loss of full-length GATA1 caused by the Gata1s mutation were further repressed by Arid3a knockdown and reinduced by Arid3a overexpression (Figure 5C), suggesting that ARID3A maintains the expression of these genes at the preleukemic stage. In accordance with this result, almost half of the ARID3A CUT&RUN peaks overlapped with the GATA1s peaks (Figure 5D). Genomic regions where ARID3A colocalizes with GATA1s are situated in open chromatin areas, as determined by ATAC-sequencing (ATAC-seq)46 and proximal to several megakaryocytic genes with expression that increased upon Arid3a expression, such as Meis1, Vwf, and Gp1ba (CD42B)47-50 (Figure 5E-G). Importantly, these genes showed similar expression patterns in miR-125b– and shArid3a-transduced Gata1s FLCs (supplemental Figure 5G), but do not possess miR-125b binding sites in their 3'UTRs as assessed by TargetScan,26 suggesting that they are indirectly regulated via miR-125b-mediated knockdown of Arid3a. Coimmunoprecipitation (Co-IP) followed by western blot analysis excluded a direct interaction between ARID3A and GATA1 (data not shown), rather suggesting a functional interaction at the promoter level.
Altogether, these data establish ARID3A as a transcriptional activator that promotes megakaryocytic differentiation in concert with GATA1 and support ARID3A repression as a key event in AMKL pathogenesis.
ARID3A interacts with SMAD2/3 and promotes TGFβ pathway activation
To further elucidate the molecular mechanism of ARID3A in the context of TAM/ML-DS, we probed the ARID3A protein interaction network through Co-IP of ARID3A in the ML-DS cell line CMK, followed by liquid chromatography with tandem mass spectrometry (LC-MS/MS; Figure 6A). Thirty-seven proteins were significantly enriched, including previously described ARID3A interactors, such as ARID3B and PML (Figure 6B; supplemental Table 8).51,52 Interestingly, one of the top interaction partners was SMAD2, a downstream effector of the TGFβ pathway. To confirm the LC-MS/MS results, we performed western blots analyses of ARID3A Co-IP samples, and showed a direct interaction between ARID3A and SMAD2 or its paralogue SMAD353 (Figure 6C).
![ARID3A interacts with SMAD2/3 and promotes TGFβ pathway activation. (A) Experimental design for isolating ARID3A-containing protein complexes from CMK cells. (B) Volcano plot showing enriched proteins in LC-MS/MS after ARID3A pulldown, compared with the IgG control (n = 2). Significantly-enriched proteins (red); and ARID3A (green) and SMAD2 (blue). (C) Western blot confirming the coimmunoprecipitation of SMAD2 and SMAD3 and ARID3A. (D) Venn diagram showing the number of genomic regions bound by ARID3A, SMAD2 and/or SMAD3. The data were obtained via CUT&RUN, after the doxycycline-induced Arid3a expression in miR-125b-expressing Gata1s FLCs. Significantly enriched peaks were called using SEACR.40 (E) Heat maps depicting the colocalization of ARID3A (green, left), SMAD2/3 (blue and gray, middle), and chromatin accessibility (green, right) signals after doxycycline-induced Arid3a expression in miR-125b-expressing Gata1s FLCs. The data were generated using CUT&RUN and ATAC-seq, respectively. Regions ±3 kb of the peak center are shown. Aggregate signals of single- and co-occupied regions are also provided (bottom; ARID3A and SMAD2/3 cobound [black], ARID3A and SMAD2 cobound [blue], ARID3A and SMAD3 cobound [gray], and ARID3A-bound only [green] are indicated). (F) Volcano plot showing the differential expression of ARID3A and SMAD2/3 cobound genes upon Arid3a knockdown in Gata1s FLCs.40 Genes involved in apoptosis and cell cycle arrest (green); significantly downregulated (blue) and upregulated (red) genes; non-significantly changed genes (gray). (G) GSEA enrichment plots showing genes bound by ARID3A, SMAD2 and SMAD3, and their response to Arid3a modulation in Gata1s FLCs. (H) Integrative Genomics Viewer snapshots of genes involved in apoptosis and cell cycle arrest, showing occupancy of the ARID3A-SMAD2-SMAD3 protein complex and chromatin accessibility (ATAC). The tracks display coverage (RPKM) (left). Scale and chromosome location are shown (top).](https://ash.silverchair-cdn.com/ash/content_public/journal/blood/139/5/10.1182_blood.2021012231/3/m_bloodbld2021012231f6.png?Expires=1768780400&Signature=uAtTAGFI47b~aIgu4fI0F3ZNdSNMXFbBZ4FXGY9su~NXolHTLXx8giEFFuTOEZ0mvXNHlv3aDizFVNIXqF9ZYb9FzK3bT8EXumV3bifk9ig1bDVMASZElKgm8qyqSaeYFXVxuLU88ZUQA5-v~knWx2uJ76JYdC4NGzikRV9grzYDw4Sab8-HuZFhwyrGnO4fGXlsgdMLavESZLbHcLZaUYUxF10bPc6RNmu13giZR8sqP47A8taHLg3nfjGSi6WJiE7esPPKcEIQJhkBHEhdusp6pov2PYij6at5wPl8KhS3BI4xu8cfKzRSC0iMIlKVqimW4dsGEgjqVjDsR2k7bQ__&Key-Pair-Id=APKAIE5G5CRDK6RD3PGA)
ARID3A interacts with SMAD2/3 and promotes TGFβ pathway activation. (A) Experimental design for isolating ARID3A-containing protein complexes from CMK cells. (B) Volcano plot showing enriched proteins in LC-MS/MS after ARID3A pulldown, compared with the IgG control (n = 2). Significantly-enriched proteins (red); and ARID3A (green) and SMAD2 (blue). (C) Western blot confirming the coimmunoprecipitation of SMAD2 and SMAD3 and ARID3A. (D) Venn diagram showing the number of genomic regions bound by ARID3A, SMAD2 and/or SMAD3. The data were obtained via CUT&RUN, after the doxycycline-induced Arid3a expression in miR-125b-expressing Gata1s FLCs. Significantly enriched peaks were called using SEACR.40 (E) Heat maps depicting the colocalization of ARID3A (green, left), SMAD2/3 (blue and gray, middle), and chromatin accessibility (green, right) signals after doxycycline-induced Arid3a expression in miR-125b-expressing Gata1s FLCs. The data were generated using CUT&RUN and ATAC-seq, respectively. Regions ±3 kb of the peak center are shown. Aggregate signals of single- and co-occupied regions are also provided (bottom; ARID3A and SMAD2/3 cobound [black], ARID3A and SMAD2 cobound [blue], ARID3A and SMAD3 cobound [gray], and ARID3A-bound only [green] are indicated). (F) Volcano plot showing the differential expression of ARID3A and SMAD2/3 cobound genes upon Arid3a knockdown in Gata1s FLCs.40 Genes involved in apoptosis and cell cycle arrest (green); significantly downregulated (blue) and upregulated (red) genes; non-significantly changed genes (gray). (G) GSEA enrichment plots showing genes bound by ARID3A, SMAD2 and SMAD3, and their response to Arid3a modulation in Gata1s FLCs. (H) Integrative Genomics Viewer snapshots of genes involved in apoptosis and cell cycle arrest, showing occupancy of the ARID3A-SMAD2-SMAD3 protein complex and chromatin accessibility (ATAC). The tracks display coverage (RPKM) (left). Scale and chromosome location are shown (top).
ARID3A interacts with SMAD2/3 and promotes TGFβ pathway activation. (A) Experimental design for isolating ARID3A-containing protein complexes from CMK cells. (B) Volcano plot showing enriched proteins in LC-MS/MS after ARID3A pulldown, compared with the IgG control (n = 2). Significantly-enriched proteins (red); and ARID3A (green) and SMAD2 (blue). (C) Western blot confirming the coimmunoprecipitation of SMAD2 and SMAD3 and ARID3A. (D) Venn diagram showing the number of genomic regions bound by ARID3A, SMAD2 and/or SMAD3. The data were obtained via CUT&RUN, after the doxycycline-induced Arid3a expression in miR-125b-expressing Gata1s FLCs. Significantly enriched peaks were called using SEACR.40 (E) Heat maps depicting the colocalization of ARID3A (green, left), SMAD2/3 (blue and gray, middle), and chromatin accessibility (green, right) signals after doxycycline-induced Arid3a expression in miR-125b-expressing Gata1s FLCs. The data were generated using CUT&RUN and ATAC-seq, respectively. Regions ±3 kb of the peak center are shown. Aggregate signals of single- and co-occupied regions are also provided (bottom; ARID3A and SMAD2/3 cobound [black], ARID3A and SMAD2 cobound [blue], ARID3A and SMAD3 cobound [gray], and ARID3A-bound only [green] are indicated). (F) Volcano plot showing the differential expression of ARID3A and SMAD2/3 cobound genes upon Arid3a knockdown in Gata1s FLCs.40 Genes involved in apoptosis and cell cycle arrest (green); significantly downregulated (blue) and upregulated (red) genes; non-significantly changed genes (gray). (G) GSEA enrichment plots showing genes bound by ARID3A, SMAD2 and SMAD3, and their response to Arid3a modulation in Gata1s FLCs. (H) Integrative Genomics Viewer snapshots of genes involved in apoptosis and cell cycle arrest, showing occupancy of the ARID3A-SMAD2-SMAD3 protein complex and chromatin accessibility (ATAC). The tracks display coverage (RPKM) (left). Scale and chromosome location are shown (top).
In accordance with ARID3A’s previously described role in TGFβ signaling,54 activation of TGFβ pathway genes was observed upon Arid3a overexpression in Gata1s FLCs (supplemental Figure 6A). Moreover, we observed considerable co-occupancy of ARID3A and SMAD2 and/or SMAD3 at genomic loci in open chromatin regions (60% of ARID3A occupied loci; 4714/7971) (Figure 6D-E). Genes proximal to the cobound regions were upregulated upon Arid3a overexpression, including several genes involved in cell cycle arrest and apoptosis, such as Bmf, Bcl2l11 (Bim), and Btg255-60 (Figure 6F-H; supplemental Figure 6B-C). In line with these transcriptional changes, ectopic expression of Arid3a not only induced megakaryocytic differentiation (Figure 3F), but also led to rapid induction of apoptosis in miR-125b-expressing Gata1s FLCs accompanied by a decrease in S-phase cells compared with the LUC control (supplemental Figure 6D-E). In summary, these results confirm the tumor suppressive role of ARID3A, positioning it as a mediator of TGFβ-induced cell cycle arrest and apoptosis in complex with SMAD2/3.
Restoring ARID3A expression reestablishes normal differentiation of leukemic blasts
TAM, ML‐DS, and non-DS samples from patients with AMKL showed reduced ARID3A expression compared with other AML subtypes and fetal CD34+ HSPCs (Figure 7A). We therefore considered restoring ARID3A expression as a strategy for overcoming the leukemic phenotype and/or differentiation blockade in AMKL. Indeed, doxycycline-induced ARID3A expression in the ML-DS cell line CMK (supplemental Figure 7A) led to growth arrest and a massive expansion of mature CD41+CD61+CD42b+ megakaryocytes, accompanied by the induction of megakaryocytic genes and repression of the ML-DS expression signature and oncogenic programs (supplemental Figure 7B-E; supplemental Table 9). Corroborating its role as mediator of TGFβ signaling, we observed increased apoptosis and cell cycle arrest upon ARID3A expression (supplemental Figure 7F-G), as well as reduced leukemic growth in other AMKL cell lines (supplemental Figure 7H).
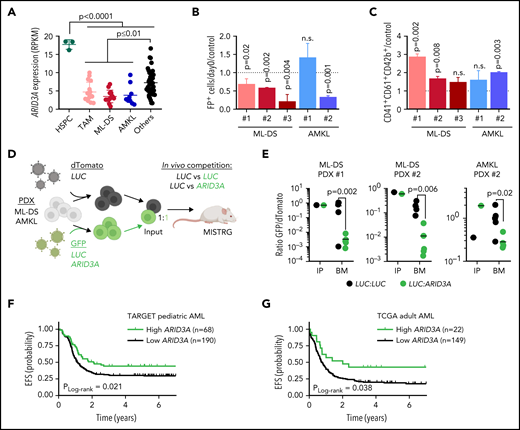
Restoring ARID3A expression reestablishes normal differentiation of leukemic blasts. (A) ARID3A expression (RPKM) in fetal CD34+ HSPCs (n = 3) and sorted pediatric AML blasts of different subtypes: TAM (n = 16), ML-DS (n = 13), and AMKL (n = 9); others include CBFB-MYH11 (n = 12), RUNX1-RUNX1T1 (n = 8), KMT2A-MLLT10 (n = 10), and KMT2A-MLLT3 (n = 8) (1-way ANOVA). (B-C) AMKL and ML-DS PDXs were transduced with doxycycline-inducible ARID3A or LUC cDNA vectors. (B) Normalized percentage of ARID3A+ cells after a 12-day induction with doxycycline, normalized to the LUC control. (C) Normalized percentage of ARID3A+ terminally differentiated megakaryocytes (CD41+CD61+CD42+) after an 8-day induction with doxycycline, normalized to the LUC control (n = 3 per PDX, unpaired Student t test vs the respective control). (D) Experimental design for evaluating ARID3A restoration in vivo. Leukemic blasts were transduced with ARID3A (GFP+) or a LUC control (GFP+) and mixed 1:1 with LUC control-transduced blasts (dTomato+), before transplantation into sublethally irradiated recipient mice. (E) Ratio of GFP+ to dTomato+ cells in input cells (IP), and in the bone marrow (BM) of mice euthanized 4 to 5 weeks after transplantation (n = 5, unpaired Student t test). (F) Probability of event-free survival (EFS) in 258 NCI-TARGET pediatric patients with AML,63 with high (green; >12.0 normalized reads; cutoff determined via maximally selected rank statistics) or low ARID3A expression (black; ≤12.0 normalized reads). (G) Probability of EFS in 171 TCGA (The Cancer Genome Atlas) adult patients with AML64 with high (green; >12.3 normalized reads; cutoff determined via maximally selected rank statistics) or low ARID3A expression (black; ≤12.3 normalized reads). (A-C,E) Data are the mean ± standard deviation. FP+, fluorescent protein positive; n.s., not significant.
Restoring ARID3A expression reestablishes normal differentiation of leukemic blasts. (A) ARID3A expression (RPKM) in fetal CD34+ HSPCs (n = 3) and sorted pediatric AML blasts of different subtypes: TAM (n = 16), ML-DS (n = 13), and AMKL (n = 9); others include CBFB-MYH11 (n = 12), RUNX1-RUNX1T1 (n = 8), KMT2A-MLLT10 (n = 10), and KMT2A-MLLT3 (n = 8) (1-way ANOVA). (B-C) AMKL and ML-DS PDXs were transduced with doxycycline-inducible ARID3A or LUC cDNA vectors. (B) Normalized percentage of ARID3A+ cells after a 12-day induction with doxycycline, normalized to the LUC control. (C) Normalized percentage of ARID3A+ terminally differentiated megakaryocytes (CD41+CD61+CD42+) after an 8-day induction with doxycycline, normalized to the LUC control (n = 3 per PDX, unpaired Student t test vs the respective control). (D) Experimental design for evaluating ARID3A restoration in vivo. Leukemic blasts were transduced with ARID3A (GFP+) or a LUC control (GFP+) and mixed 1:1 with LUC control-transduced blasts (dTomato+), before transplantation into sublethally irradiated recipient mice. (E) Ratio of GFP+ to dTomato+ cells in input cells (IP), and in the bone marrow (BM) of mice euthanized 4 to 5 weeks after transplantation (n = 5, unpaired Student t test). (F) Probability of event-free survival (EFS) in 258 NCI-TARGET pediatric patients with AML,63 with high (green; >12.0 normalized reads; cutoff determined via maximally selected rank statistics) or low ARID3A expression (black; ≤12.0 normalized reads). (G) Probability of EFS in 171 TCGA (The Cancer Genome Atlas) adult patients with AML64 with high (green; >12.3 normalized reads; cutoff determined via maximally selected rank statistics) or low ARID3A expression (black; ≤12.3 normalized reads). (A-C,E) Data are the mean ± standard deviation. FP+, fluorescent protein positive; n.s., not significant.
We next restored ARID3A expression in samples from patients with ML-DS and non-DS AMKL expanded via xenotransplantation (see supplemental Table 2 for patient characteristics). Except for 1 non-DS AMKL sample harboring a KMT2A mutation, we observed decreased leukemic growth in vitro accompanied by cell cycle arrest and increased apoptosis, as well as induction of megakaryocytic differentiation upon doxycycline-induced ARID3A expression (Figure 7B-C; supplemental Figure 7I-J). Last, we evaluated the effect of ARID3A reexpression on leukemic growth in vivo, through a fluorescence-based competitive transplantation assay, using 1 AMKL and 2 ML-DS patient-derived xenografts (PDX; Figure 7D). In all 3 cases, at the experimental end point, ARID3A-transduced leukemic blasts were significantly diminished in the bone marrow of the transplant-recipient mice (Figure 7E), supporting the role of ARID3A as a miR-125b-repressed novel tumor suppressor in ML-DS and AMKL. For a more global perspective of AML, we analyzed the relationship between ARID3A expression and patient prognosis across AML subtypes and age groups. We found low ARID3A expression61,62 to be significantly associated with shorter event-free and overall survival in a pediatric63 and an adult64 cohort (Figure 7F-G; supplemental Figure 8A-D). Multivariate analysis further validated ARID3A expression as an independent prognostic factor across both AML data sets (supplemental Table 10).65 Finally, ARID3A was also downregulated compared with HSPCs in other AML subtypes, and its restoration led to tumor suppression in a panel of 5 myeloid leukemia cell lines in vitro and in 2 PDXs in vitro and in vivo (supplemental Figure 8E-K). These data position ARID3A as a putative pan-AML tumor suppressor and suggest that ARID3A reexpression could represent a general strategy to combat AML across subtypes and age groups.
Discussion
We have delineated the molecular basis of the differentiation blockade in AMKL. Using ML-DS, which is characterized by the interplay of trisomy 21 and GATA1s mutations, as a genetically simple model, we demonstrated that miR-125b increases proliferation and blocks terminal megakaryocytic differentiation in Gata1s FLCs, thereby leading to leukemia in vivo, and that miR-125b-mediated downregulation of Arid3a underlies this phenotype. Although the contribution of other miR-125b targets20,21,66 cannot be fully excluded, our comprehensive experimental data using complementary methods and different models strongly suggest that Arid3a is the main target of miR-125b in this context. We further uncover novel functions for ARID3A in promoting megakaryocytic differentiation in concert with GATA1 and mediating TGFβ-induced cell cycle arrest and apoptosis in complex with SMAD2/3, indicating a tumor suppressive role for ARID3A in this context. Inversely, we propose that the dual hit of ARID3A repression and loss of full-length GATA1, and the resulting perturbation of erythropoiesis and megakaryopoiesis, is key to the pathogenesis of TAM/ML-DS. In this model, Arid3a downregulation blocks the otherwise unperturbed megakaryocytic differentiation of hyperproliferative Gata1s megakaryocytic progenitors, arresting them in an undetermined differentiation state and thereby causing leukemia. Reinstating ARID3A expression relieved megakaryocytic differentiation arrest in ML-DS and non-DS AMKL patient-derived xenografts, opening the way for new therapeutic concepts. As miR-125b is also upregulated in non-DS AMKL, which frequently presents with oncogene-mediated functional perturbation of GATA1 and acquired trisomy 21,67 these findings are also more broadly applicable beyond the scope of TAM/ML-DS. This point is supported by our finding that ARID3A expression is a prognostic factor in AML across subtypes and age groups, which may be attributable to ARID3A’s function in controlling TGFβ signaling.
Our work on miR-125b and Gata1s provides a rare example of dissecting the specific interaction between a dysregulated miRNA and a known oncogene in the process of transformation. It has been shown that GATA1s mutations perturb erythroid differentiation but leave megakaryocytic differentiation unaffected.3,4,11,12 Accordingly, GATA1s occupancy at several erythroid-specific genes is reduced but unaltered at megakaryocytic genes.3,45,68 Because the erythroid and megakaryocytic lineages share a common progenitor, GATA1s has been speculated to bias differentiation away from the erythroid lineage and toward megakaryocytes, while failing to control their proliferation.21 In this study, we found that high levels of miR-125b, as seen in TAM and ML-DS, block this megakaryocytic route favored by Gata1s cells. Instead, the combination of Gata1s and miR-125b results in an accumulation of hyperproliferative megakaryocytic progenitors with erythroid features, which remain in an undetermined differentiation state and ultimately lead to leukemia in vivo. We note that the synergy between Gata1s and miR-125b alone in ML-DS was unexpected, as we previously showed that concerted action from all 3 members of the miR-99a-125b tricistron was required to prevent the exhaustion of adult hematopoietic stem cells.20 However, the current findings, which we obtained using our recently generated murine preleukemic model to study and identify GATA1s co-operating events,9 corroborate those of our previous study,21 as well as others,69,70 describing miR-125b as the dominant oncogenic miRNA from this cluster in AML and acute lymphoblastic leukemia, and highlight the importance of developmental and cellular context in studying oncogenes and their partners, a phenomenon that has been described for other oncogenes in AMKL.67 Although our findings were made possible through the use of our murine model, we note its limitations in fully reflecting the complexity of human disease; therefore, we have confirmed key findings in human cells in vitro and in vivo. Of note, a recent study using murine xenograft models demonstrated the importance of chromosome 21–encoded miR-125b, miR-99a, and miR-155, but not let-7c, in mediating trisomy 21–associated alterations in human fetal hematopoiesis.71 Another recent study discovered the NRIP1-MIR99AHG fusion gene resulting from inv(21)(q11.2;q21.1) in 1.1% of patients with AML, which led to the disruption of the miR-99a-125b-2 locus and exclusive expression of miR-125b.72 These reports support the significance of our findings for leukemogenesis and highlight the strength of our system for studying oncogenic synergy.
Our results suggest an unexpected role for ARID3A in the regulation of megakaryopoiesis and megakaryocyte/erythroid cell fate decision, where high levels direct cells toward a megakaryocytic and low levels toward an erythroid fate. Importantly, our shRNA-based approach enables us to overcome the fetal lethality of Arid3a−/− HSPCs and confirm the relevance of ARID3A in fetal hematopoiesis and early cell fate decisions.33,35 Our comprehensive molecular characterization of ARID3A further provides a mechanistic explanation for the synergy between miR-125b and GATA1s at the genetic level: ARID3A occupies megakaryocytic genes, inducing their transcriptional activation, and the majority of ARID3A regulated genes are also co-occupied by GATA1, suggesting that ARID3A acts as a GATA1 coregulator during megakaryopoiesis. This coregulation is sufficient to maintain megakaryocytic differentiation, even in GATA1s-mutated cells. Upon knockdown of ARID3A, this concerted transcriptional activation of megakaryocytic genes is lost, leading to an arrest in megakaryocytic differentiation. Hence, together, ARID3A knockdown and GATA1s mutations block both functions of full-length GATA1 (ie, induction of erythroid and megakaryocytic differentiation). Because the respective abilities of GATA1 and ARID3A to control the proliferation of hematopoietic cells are similarly lost,73 this combination results in drastic perturbation of normal hematopoiesis and development of megakaryoblastic leukemia with erythroid features in vivo, a hallmark of ML-DS.74,75 Using a proteomic approach, we found that the tumor suppressive functions of ARID3A are mediated in complex with SMAD2/3, downstream effectors of the TGFβ signaling pathway, which induce apoptosis and cell cycle arrest in megakaryocytic progenitor cells.76,77 Thus, our current work adds the downregulation of ARID3A as another mechanism through which miR‐99a-125b controls TGFβ-signaling in hematopoietic cells.20
Overall, our work helps explain the synergy between trisomy 21 and GATA1 mutations in leukemogenesis, through the functional dissection of a chromosome 21–encoded gene that is highly expressed in TAM/ML-DS. Although other factors on chromosome 21, such as CHAF1B13 and RUNX1,15 are likely relevant for leukemogenesis, our findings can extend to non-DS AMKL with acquired trisomy 21 and functional GATA1 perturbation. In addition, we exemplify a general framework that can be used to interrogate oncogene-miRNA interactions in cancer and provide a basis for developing refined treatment approaches centered on ARID3A.
Acknowledgments
The authors thank D. Trono of EPFL (Lausanne, Switzerland), for kindly providing both pMD2.G (plasmid 12259; Addgene) and psPAX2 (plasmid 12260; Addgene); A. Santos (University of Halle-Wittenberg) for assistance with flow cytometry; and K. Huke for assistance with animal experiments. Illustrations (Figures 6A and 7D and the graphical abstract) were created with BioRender.com.
K.W. is a recipient of Mildred-Scheel doctoral research funding from the German Cancer Aid. This work was supported by funding from the German Research Foundation (DFG; KL2374/5-1) and the European Research Council (ERC) under the European Union’s Horizon 2020 Research and Innovation Program grant 714226 (J.-H.K.); and by German Cancer Aid grant 111743 (D.H.). J.-H.K. is a recipient of the St Baldrick’s Robert J. Arceci Innovation Award.
Authorship
Contribution: O.A.-V. performed experiments, analyzed the data, and wrote the manuscript; K.W., M.N., S.E., C.B., M.F., H.I., R.B., and M.L. performed experiments, analyzed the data, and revised the manuscript; E.R., K.S., C.I., M.Z., and C.W. analyzed and interpreted the data and revised the manuscript; A.S. and M.-L.Y. supervised data analysis, interpreted the data, and revised the manuscript; D.R. provided patient samples and/or data and revised the manuscript; D.H. and J.-H.K. designed the study, analyzed and interpreted the data, wrote the manuscript, and academically drove the project.
Conflict-of-interest disclosure: D.R. has advisory roles for Celgene Corporation, Novartis, Bluebird Bio, and Janssen, and receives research funding from CLS Behring and Roche. J.-H.K. has served in advisory roles for Bluebird Bio, Novartis, Roche, and Jazz Pharmaceuticals. M.-L.Y. is partially employed by Alacris Theranostics. The remaining authors declare no competing financial interests.
Correspondence: Jan-Henning Klusmann, Goethe University Frankfurt, Theodor Stern Kai 7, Frankfurt 60590, Germany; e-mail: jan-henning.klusmann@kgu.de (preferred contact); and Dirk Heckl, Martin-Luther-University Halle-Wittenberg, Ernst-Grube-Str. 40, Halle 06120, Germany; e-mail: dirk.heckl@uk-halle.de.
RNA-seq gene expression data have been deposited in the National Center for Biotechnology Information’s Gene Expression Omnibus (accession numbers GSE169738, GSE169739, GSE169740, and GSE181570). Data from the shRNA-positive selection screening are available through the European Genome-Phenome Archive (accession number PRJEB43922). Mass spectrometry proteomics data have been deposited in the ProteomeXchange Consortium via the PRIDE partner repository (data set identifier PXD025027).
Data that are not available within the article and supplemental files may be obtained by e-mail request to the corresponding authors.
The online version of this article contains a data supplement.
There is a Blood Commentary on this article in this issue.
The publication costs of this article were defrayed in part by page charge payment. Therefore, and solely to indicate this fact, this article is hereby marked “advertisement” in accordance with 18 USC section 1734.

This feature is available to Subscribers Only
Sign In or Create an Account Close Modal