

Key Points
Chr7q21.3 amplification drives ectopic PEG10 expression and potentiates large-cell transformation in CTCL via a PEG10/KLF2/ NF-κB axis.
Pharmacological targeting PEG10 reverses the phenotypes of large-cell transformation in CTCL.

Abstract
Mycosis fungoides (MF), the most common form of cutaneous T-cell lymphoma, undergo large-cell transformation (LCT) in the late stage, manifesting aggressive behavior, resistance to treatments, and poor prognosis, but the mechanisms involved remain unclear. To identify the molecular driver of LCT, we collected tumor samples from 133 MF patients and performed whole-transcriptome sequencing on 49 advanced-stage MF patients, followed by integrated copy number inference and genomic hybridization. Tumors with LCT showed unique transcriptional programs and enriched expressions of genes at chr7q. Paternally expressed gene 10 (PEG10), an imprinted gene at 7q21.3, was ectopically expressed in malignant T cells from LCT, driven by 7q21.3 amplification. Mechanistically, aberrant PEG10 expression increased cell size, promoted cell proliferation, and conferred treatment resistance by a PEG10/KLF2/NF-κB axis in in vitro and in vivo models. Pharmacologically targeting PEG10 reversed the phenotypes of proliferation and treatment resistance in LCT. Our findings reveal new molecular mechanisms underlying LCT and suggest that PEG10 inhibition may serve as a promising therapeutic approach in late-stage aggressive T-cell lymphoma.
Introduction
Cutaneous T-cell lymphoma (CTCL) is one of the most common forms of T-cell lymphoma, characterized by skin infiltrations of clonally expanded T lymphocytes.1 Mycosis fungoides (MF), constituting the majority of CTCL, presented as scaly skin patches, plaques, and tumors and has been studied as a model disease for mature T-cell lymphoma with indolent clinical courses.2 However, 20% to 55%3,4 of MF patients develop large-cell transformation (LCT), featured by rapidly progressive skin tumors, aggressive extracutaneous spreading, and resistance to conventional treatments.5,6 Histologically, MF-LCT is classified if the biopsy shows large cells (>4 times the size of small lymphocytes) in more than 25% of the skin infiltrate or if they form microscopic nodules,3 which represent an evolution of the malignant T cells.7 LCT has been shown as an independent marker for poor prognosis with a 5-year survival of less than 20%.3 Currently, there is a lack of therapy for effectively tackling LCT, and the management of patients with LCT is a huge clinical obstacle, prompting an urgent need to identify therapeutic options that will benefit this patient population and improve patient outcomes.
The molecular pathogenesis of LCT remains largely unknown. Previous array-based comparative genomic hybridization (aCGH) studies reported recurrent cytogenetic abnormalities in transformed CTCL, including gains of chromosome regions 1q21-1q22, 1q31-1q32, 1p36, 7q, 8q24.3, 9q34, 17q, 19, and losses of 9p21, 2q36, 13q14-13q31, and 17p.8-11 Integration of aCGH results and gene-expression data revealed a series of candidate oncogenes and tumor suppressors in MF, including AP1S1 at 7q21-7q22, RB1, KLF12 at 13q14-13q31, and CDKN2A-CDKN2B at 9p21.8,12,13 However, previous studies focused mainly on the cytogenetic signatures distinguishing MF from other subtypes of CTCLs, including Sézary syndrome and CD30+ lymphoproliferative diseases. Little is known about the biological and functional relevance of these cytogenetic aberrations. More importantly, the key mediators driving LCT phenotypes in MF and their potential molecular mechanisms remain undetermined. In this study, with a large clinical cohort and integrated transcriptomic and genomic studies, we unravel a molecular mechanism driving LCT and delineate its functional importance in transforming CTCL cells with in vitro and in vivo models. Moreover, we highlight a molecule-based therapeutic strategy for LCT in CTCL. The research flow of our study is shown in Figure 1A.
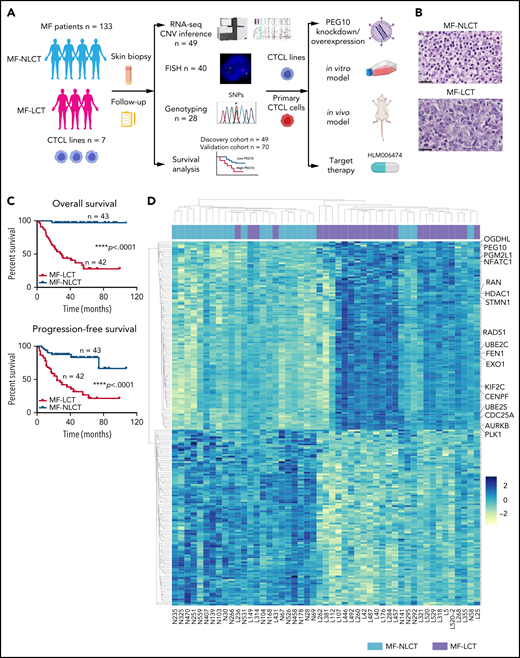


Characteristic transcriptional profiles and enriched gene expression at 7q in MF-LCT. (A) Flowchart depicting the overall clinical samples and experimental design of this study. (B) Histopathological features of biopsied specimens from a tumor-stage MF-LCT and MF-NLCT patient. Hematoxylin and eosin staining. Original magnification ×400. Scale bar = 25 μm. (C) Kaplan-Meier survival analysis of OS and PFS from advanced-stage MF patients classified into MF-LCT and MF-NLCT group. *P < .0001, n = 85. (D) Heatmap of 26 MF-LCT and 23 MF-NLCT samples stratified by top 200 DEGs between MF-LCT and MF-NLCT group. (E) Representative enriched molecular pathways in MF-LCT group via GSEA of 49-patient transcriptional profiles (FDR q-value <0.25, Norminal P < .05). (F) GSEA enrichment plot for romidepsin-resistance gene signature, which consists of upregulated genes in romidepsin-resistant versus romidepsin-sensitive CTCL cases from GSE132053. (G) Heatmap of CNV events identified from InferCNV analysis of 49-patient RNA-seq data and chr7 locus marked with red frame. (H) Enriched positional gene sets in MF-LCT group ranked by normalized enrichment score (FDR q-value <0.25, nominal P < .05). Gene sets at regions of chr7 marked with red color.
Characteristic transcriptional profiles and enriched gene expression at 7q in MF-LCT. (A) Flowchart depicting the overall clinical samples and experimental design of this study. (B) Histopathological features of biopsied specimens from a tumor-stage MF-LCT and MF-NLCT patient. Hematoxylin and eosin staining. Original magnification ×400. Scale bar = 25 μm. (C) Kaplan-Meier survival analysis of OS and PFS from advanced-stage MF patients classified into MF-LCT and MF-NLCT group. *P < .0001, n = 85. (D) Heatmap of 26 MF-LCT and 23 MF-NLCT samples stratified by top 200 DEGs between MF-LCT and MF-NLCT group. (E) Representative enriched molecular pathways in MF-LCT group via GSEA of 49-patient transcriptional profiles (FDR q-value <0.25, Norminal P < .05). (F) GSEA enrichment plot for romidepsin-resistance gene signature, which consists of upregulated genes in romidepsin-resistant versus romidepsin-sensitive CTCL cases from GSE132053. (G) Heatmap of CNV events identified from InferCNV analysis of 49-patient RNA-seq data and chr7 locus marked with red frame. (H) Enriched positional gene sets in MF-LCT group ranked by normalized enrichment score (FDR q-value <0.25, nominal P < .05). Gene sets at regions of chr7 marked with red color.
Methods
Patient recruitment
In total, 133 MF patients were recruited from the Skin Lymphoma Clinic of Peking University First Hospital from March 2010 to December 2018, with approval from the clinical ethics board, in accordance with the Declaration of Helsinki principles. Written informed consents were obtained from all patients. Patients were diagnosed and staged based on the integrated clinical-pathological algorithm proposed by the International Society of Cutaneous Lymphomas.14,15 Each patient was reassessed every 1 to 6 months in the clinic, with an average 40-month follow-up period. Disease progression was defined as progression to a more advanced tumor node metastasis blood (TNMB) classification or death owing to disease.16 Time to next treatment (TTNT) was calculated as the duration between the date of treatment commencement and the date of commencement of the subsequent next treatment.17 Detailed patient information is provided in supplemental Table 1.
RNA sequencing (RNA-seq)
Freshly biopsied tumorous skin lesions with at least 70% of neoplastic T-cell infiltration were subjected to RNA-seq. For tissue RNA, cDNA library construction and 150bp paired-end RNA-seq was completed on Illumina HiSeqTM 4000 platform at Beijing Genomics Institute. On average, 11.04 G raw data for each sample was obtained.
Fluorescence in situ hybridization (FISH)
Bacterial artificial chromosome (BAC) clones covering the PEG10 locus at 7q21.3 (hg19 chr7:94 139,170-95 727,736) and CDKN2A locus at 9q21.3 were labeled with SpectrumOrange(O).
SpectrumGreen-labeled chr7 and chr9 centromeric probes(G) were used as a reference.
Genotyping analysis of PEG10
Polymerase chain reaction (PCR) was performed on DNA extracted from MF skin lesions by Tks Gflex™ DNA Polymerase (R060A, Takara) using the primers (supplemental Table 2) to amplify 2 single nucleotide polymorphism (SNP) sites of PEG10 (rs13073, rs13226637),18 and genotypes were obtained by Sanger sequencing.
Gene knockdown and overexpression
Lentivirus shRNA vectors against PEG10 and KLF2 were constructed with GL404 and GL405 vectors (Obio). GV409 and GV643 vectors (GeneChem) were used to construct the PEG10 lentiviral overexpression vectors. GV655 vector (GeneChem) was used to construct the KLF2 lentiviral overexpression vectors.
In vitro drug combination studies
CTCL cell lines and primary cells were treated with the single and combined drugs with the corresponding dose for 48 hours. Specific apoptosis was tested as the drug effect. Combination index (CI) values were calculated to assess drug interactions using CompuSyn based on the quantitative analysis of dose-effect relationships on combined drugs by Chou-Talalay model.19 CI <1 indicates synergistic effects, CI = 1 indicates the mean additive effects, and CI >1 represents antagonistic effects of the drugs.
Xenograft model of CTCLs
All the experimental procedures were reviewed and approved by the Institutional Animal Care and Use Committee at Peking University First Hospital. In total, 30 6-week-old NOD/scid interleukin-2 receptor γ-chain–deficient (NSG) female mice were purchased from Beijing Vital River Company and maintained in specific pathogen-free conditions. 5 × 10⁶ cells were subcutaneously injected on the right flanks of recipient mice. Treatment was started when the mice had palpable tumors with an average size of 100 mm.3 Indicated drugs were injected intraperitoneally 3 times per week. Tumor volume was measured and calculated 2 to 3 times a week, as previously reported.20
NF-κB luciferase reporter assay
NF-κB response elements and TA promoter (TATA box from herpes simplex virus thymidine kinase promoter) (supplemental Table 2) were cloned to MCS-firefly_Luciferase-PloyA-Tk-Renilla_Luciferase-PolyA vector (GV354, GeneChem). 2 x 10⁶ cells were electroporated (Amaxa Nucleofector II, Lonza) with 4 µg vectors using Nucleofector Kit (VPA-1002 and VCA-1001, Lonza). Luciferase and renilla signals were measured via Dual Luciferase Reporter Assay Kit (E1910, Promega) after 20 hours.
Additional methods are listed in the supplemental Methods.
Results
Large-cell transformation in mycosis fungoides demonstrates gene signatures associated with aggressive clinical behaviors and enriched expressions of genes at chr7q
In total, 136 tumor samples from a cohort of 133 MF patients with long-term follow-ups were obtained. This cohort covers all stages of MF, and the majority are in advanced stages (stage IIB and above, n = 87).21 Forty-three out of 87 advanced-stage patients showed LCT in histology. The representative pathologic manifestations of advanced-stage MF with LCT (MF-LCT) and without LCT (MF-NLCT) are shown (Figure 1B). We confirmed that even in patients with advanced-stage MF (n = 85), LCT was associated with shorter overall survival (OS) and progression-free survival (PFS) (Figure 1C). To unravel the candidate driver molecular events in LCT, we compared the transcriptional atlas between the tumorous skin lesions from MF-LCT (n = 26) and MF-NLCT (n = 23) patients via bulk RNA-seq. Top 200 differentially expressed genes (DEGs) robustly classified MF-LCT samples from MF-NLCT samples with unsupervised hierarchical clustering (Figure 1D), demonstrating characteristic transcriptional profiles in MF-LCT. Further gene set enrichment analysis (GSEA) showed markedly enriched molecular pathways in MF-LCT, including cell cycle regulation (CENPF, CDC25A, KIF2C), DNA repair (EXO1, RAD51, FEN1), oncogenic process (PLK1, STMN1, AURKB, NFATC1), cell metabolism (PGM2L1, OGDHL, PCK2), ubiquitin-proteasome (UBE2C, UBE2S, UBE2H), and histone deacetylase (HDAC) pathways (RAN, HDAC1, HDAC7) (Figure 1E, supplemental Table 3). PLK1 upregulation,22 Aurora kinase activation,23 NF-κB, and nuclear factor of activated T-cells (NFAT) activation24,25 have been reported to participate in CTCL progression. The upregulation of glucose metabolism, mechanistic target of rapamycin complex 1 (mTORC1), and MYC proto-oncogene gene, BHLH transcription factor (MYC) signaling suggested a metabolic reprogramming in MF-LCT, consistent with previous reports demonstrating mTORC1 activation26 and c-MYC overexpression27,28 in late-stage CTCL. Ubiquitin-proteasome pathway participates in carcinogenesis via direct roles in degrading cell cycle regulatory proteins and indirect roles by regulating the availability of nuclear factors, such as NF-κB.29 HDACs play crucial roles in various biological processes, including cell cycle progression and proliferation, and their dysregulation has been linked to multiple cancers.30
Moreover, a set of genes previously reported as romidepsin (an HDAC inhibitor, HDACi)-resistance signatures in CTCL were enriched in MF-LCT31 (Figure 1F, supplemental Table 4). HDACis have been widely used in CTCLs, albeit the response rate is relatively low and unpredictable.32 The enrichment of HDACi-resistance gene signatures in LCT explained the intrinsic HDACi resistance of MF-LCT patients5 and suggested that genes underlying the LCT progression accounted for their HDACi resistance. Consistently, MF-LCT patients showed a significantly shorter TTNT for HDACis (suberoylanilide hydroxamic acid or chidamide) compared with MF-NLCT patients in our cohort (supplemental Figure 1A). These dysregulated pathways collectively illustrated the molecular features responsible for the aggressive clinical process, treatment resistance, and poor prognosis in MF-LCT patients.
Next, we sought to identify the driving molecular events in LCT. Multiple lines of evidence have suggested that copy number variations (CNVs), which may alter large-scale gene expressions, are involved in the development of LCT in MF.8-11 Therefore, we analyzed the RNA-seq data with bioinformatic tools to uncover the transcriptional changes corresponding to chromosome CNVs. Comparing to MF-NLCT, frequent copy number gains at 7q in MF-LCT were inferred via InferCNV analysis (Figure 1G). Next, positional gene enrichment analysis with MSigDB positional gene sets identified overrepresented gene regions in MF-LCT, including multiple locus at 7q (7q36, 7q32, 7q22, 7q11,7q21) (Figure 1H, supplemental Table 3). These results indicated that copy number gains at 7q may occur in MF-LCT and affect gene expressions. Collectively, we identified characteristic molecular programs underlying the aggressive clinical behaviors in MF-LCT and observed that enriched gene expression at 7q was closely associated with LCT in MF.
PEG10 is ectopically expressed in large-transformed malignant T cells and predicts poor patient prognosis
Of the DEGs with the positional enrichment data, paternally expressed gene 10 (PEG10), located at 7q21.3, was among the top upregulated genes in MF-LCT (Figure 2A, supplemental Table 5). PEG10 is an imprinted gene and plays essential roles in embryo and placenta development33 and has restricted expression in adult tissues, including adrenal, ovary, testis, and brain.34 PEG10 is not expressed in healthy CD4+ cells with or without activation,35 prompting us to explore the expression pattern of PEG10 in CTCL. We evaluated the mRNA expression levels of PEG10 in 110 MF lesional biopsies via quantitative reverse transcription polymerase chain reaction (qRT-PCR). While PEG10 showed upregulation in plaque and tumor-stage lesions compared with patch-stage lesions, MF-LCT showed significantly higher PEG10 levels (Figure 2B). MF-LCT samples demonstrated cytoplasmic staining of PEG10 on the large infiltrating T cells (Figure 2C). PEG10 positivity occurred in T cells in the Pautrier’s microabscesses36 (Figure 2D), in TOX+ cells37 (Figure 2E), as well as in large Ki-67+ cells (Figure 2F) in MF-LCT samples, suggesting explicit PEG10 expression on the highly proliferating large-transformed malignant T cells.
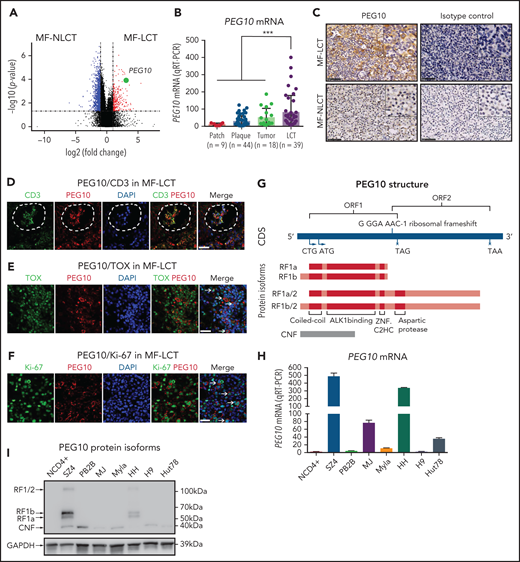

Expression and prognosis analysis of PEG10 in MF. (A) Volcano plot of upregulated (red) and downregulated (blue) DEGs (fold change ≥2 or ≤−2 and P <.05) between MF-LCT and MF-NLCT group and PEG10 gene pointed out in green color. (B) PEG10 mRNA expression in lesion-biopsied samples with different T stages of MF and MF-LCT. *P < .001, n = 110. qRT-PCR, real-time quantitative reverse transcription PCR. (C) Representative immuno-histochemical evaluation of PEG10 on lesion-biopsied samples from MF-LCT and MF-NLCT patients, IgG isotype controls serve as negative controls. Original magnification ×200, insets ×400, scale bar = 50 μm. (D) Immunofluorescence (IF) costaining of PEG10 (red) and CD3 (green) on a lesional biopsy specimen of tumor-stage MF-LCT. Pautrier’s microabscess pointed out with a dashed line circle. (E,F) IF costaining of PEG10 (red) and TOX (green). (E) PEG10 (red) and Ki-67 (green). (F) On lesional biopsy specimens of tumor-stage MF-LCT. DAPI (blue) used to visualize cell nuclei. Original magnification x400, scale bar = 25 μm. (G) The structure of PEG10 coding sequence (CDS) and protein isoforms. (H,I) PEG10 mRNA (H) and protein (I) expression levels among 7 CTCL lines and CD4+ T cells from normal controls (NCD4+). (J) OS and PFS of MF patients stratified by PEG10 expression from a discovery cohort of 49 RNA-seq samples and validation cohort of extended 70 MF samples via Kaplan-Meier survival analysis. (K) TTNT for HDACis in PEG10-low and PEG10-high patients via Kaplan–Meier analysis (n = 21 treatment episodes). **P < .05; ***P < .01.
Expression and prognosis analysis of PEG10 in MF. (A) Volcano plot of upregulated (red) and downregulated (blue) DEGs (fold change ≥2 or ≤−2 and P <.05) between MF-LCT and MF-NLCT group and PEG10 gene pointed out in green color. (B) PEG10 mRNA expression in lesion-biopsied samples with different T stages of MF and MF-LCT. *P < .001, n = 110. qRT-PCR, real-time quantitative reverse transcription PCR. (C) Representative immuno-histochemical evaluation of PEG10 on lesion-biopsied samples from MF-LCT and MF-NLCT patients, IgG isotype controls serve as negative controls. Original magnification ×200, insets ×400, scale bar = 50 μm. (D) Immunofluorescence (IF) costaining of PEG10 (red) and CD3 (green) on a lesional biopsy specimen of tumor-stage MF-LCT. Pautrier’s microabscess pointed out with a dashed line circle. (E,F) IF costaining of PEG10 (red) and TOX (green). (E) PEG10 (red) and Ki-67 (green). (F) On lesional biopsy specimens of tumor-stage MF-LCT. DAPI (blue) used to visualize cell nuclei. Original magnification x400, scale bar = 25 μm. (G) The structure of PEG10 coding sequence (CDS) and protein isoforms. (H,I) PEG10 mRNA (H) and protein (I) expression levels among 7 CTCL lines and CD4+ T cells from normal controls (NCD4+). (J) OS and PFS of MF patients stratified by PEG10 expression from a discovery cohort of 49 RNA-seq samples and validation cohort of extended 70 MF samples via Kaplan-Meier survival analysis. (K) TTNT for HDACis in PEG10-low and PEG10-high patients via Kaplan–Meier analysis (n = 21 treatment episodes). **P < .05; ***P < .01.
We further evaluated the relationship between PEG10 and CD30 expression in MF samples since CD30 positivity occurs in a portion of LCT.6,38 Neither the immunohistochemistry (IHC) results (n = 60) nor the RNA-seq (n = 49) data showed correlated expressions between PEG10 and CD30 (Figure S2A,B). Double staining showed that PEG10 expression in LCT samples was not restricted to CD30+ cells (Figure S2C), confirming that PEG10 expression was independent of CD30 positivity.
PEG10 is evolutionarily derived from the Ty3/Gypsy family of retrotransposons and shares features with retrotransposons.39 It contains 2 overlapping open reading frames (ORF1 and ORF2) and 2 translation initiation sites (“a” is from ATG while “b” is from CTG). Thus, PEG10 is capable of encoding 4 protein isoforms: RF1(a/b) and RF1(a/b)/2 due to -1 ribosomal frameshifting, and a self-cleavage N-terminal fragment (CNF) due to an active aspartic protease motif40,41 (Figure 2G). To explore the PEG10 isoforms in CTCL, we quantified mRNA and protein expression levels of PEG10 on 7 well-established CTCL lines and pooled peripheral blood CD4+ T cells from normal controls (NCD4+). SZ4, a CTCL line established from a Sézary syndrome patient (a leukemic form of CTCL closely related to MF),42 showed the highest PEG10 expression levels, followed by HH, which was derived from a late-stage MF patient,43 whereas neither mRNA nor protein expression of PEG10 was found in NCD4+ (Figure 2H,I). Notably, the dominant isoforms expressed by SZ4 and HH were RF1 (mainly RF1b), consistent with previous reports of PEG10 with 22% frameshifting efficiency to translate RF1/241.
Next, we examined the prognostic significance of PEG10 in the discovery cohort for RNA-seq and validated the results in an extended cohort of 70 MF patients. Kaplan-Meier survival analysis showed that higher PEG10 expression was correlated with shorter OS and PFS in both discovery and validation cohorts (Figure 2J). In addition, when evaluating PEG10 expression in patients receiving HDACi treatments, PEG10-high patients showed shorter TTNT for HDACis (Figure 2K).
Together, these results indicate that PEG10 is ectopically expressed in the large-transformed malignant T cells and serves as an adverse prognostic factor for patient survival in MF.
Genetic amplification of 7q21.3, promoter demethylation, and loss-of-imprinting of PEG10 account for the ectopic PEG10 expression in mycosis fungoides with large-cell transformation
Other than PEG10, 7 genes contiguous to PEG10 locus on chr7q21.3 showed positive correlations with PEG10 expression based on our RNA-seq data (Figure S3A), prompting us to explore if elevated PEG10 expression resulted from genetic amplification of 7q21.3 in MF-LCT. We performed FISH on 21 MF-LCT and 19 MF-NLCT samples with a probe of SpectrumOrange(O) for 7q21.3 covering PEG10 locus and a probe of SpectrumGreen(G) detecting the centromere of chr7(CEN7) (Figure S3B). Cell nuclei with more than 2 O signals are termed as 7q21.3 gain. Representative FISH signals in MF-LCT included 3O2G, 3O3G, and 4O4G, while diploid cells without CNVs on this region showed a 2O2G signal (Figure 3A). Cell nuclei with 3O3G and 4O4G showed gains of both CEN7 and 7q21.3, indicating large-fragment copy number gains at 7q. MF-LCT showed significantly higher percentages of 7q21.3 gain than MF-NLCT (Figure 3B). As expected, PEG10 mRNA expression levels were positively correlated with the percentages of 7q21.3 gain among these samples (Figure 3C). Moreover, patients with 2 skin biopsies before and after disease progression (Pt266 and Pt520) showed upregulated PEG10 expression and increased percentages of 7q21.3 gain along with LCT development (Figure 3D), supporting that PEG10 expression increased along with 7q21.3 amplification during MF progression. Notably, 7q21.3 amplification and its relationship with PEG10 expression was strictly preserved in CTCL cell lines44 (Figure S3C). SZ4 and HH cells with high PEG10 expression showed gains of extra copies of PEG10, while the 2 PEG10-low cell lines, Hut78 and Myla, showed no extra 7q21.3 gains.

Ectopic PEG10 expression in MF-LCT is linked to genetic gains of 7q21.3, promoter demethylation, and loss-of-imprinting of PEG10. (A) Representative tissue FISH images of 3 main amplification patterns of 7q21.3 in MF-LCT and a diploid case in MF-NLCT. O: 7q21.3; G: CEN7. (B) FISH enumeration results of skin-biopsied samples from MF-LCT(n = 21) and MF-NLCT(n = 19) patients. Percentages (%) of nuclei with 7q21.3 gain (O >2) in these 2 groups are shown on the right panel. *P < .0001. (C) Spearman correlation between PEG10 mRNA expression and percentages of nuclei with 7q21.3 gain in MF lesions. n = 39, r = 0.667, **P < .0001. (D) PEG10 mRNA expression and percentages of nuclei with 7q21.3 gain before and after disease progression in 2 MF patients. Pt, patient. (E) PEG10 allelic expression patterns in MF-LCT (n = 8) and MF-NLCT (n = 8) samples from RNA-seq data. (F) Schematic description of the detected CpG sites at PEG10 promoter region. (G) Quantitative methylation analysis on CpG sites at PEG10 promoter region among MF-LCT group (n = 6) and MF-NLCT group (n = 6). Average PEG10 promoter methylation levels of each sample are shown on the right panel. Methylation level 1 represents 100% methylated CpG dinucleotides on this site.
Ectopic PEG10 expression in MF-LCT is linked to genetic gains of 7q21.3, promoter demethylation, and loss-of-imprinting of PEG10. (A) Representative tissue FISH images of 3 main amplification patterns of 7q21.3 in MF-LCT and a diploid case in MF-NLCT. O: 7q21.3; G: CEN7. (B) FISH enumeration results of skin-biopsied samples from MF-LCT(n = 21) and MF-NLCT(n = 19) patients. Percentages (%) of nuclei with 7q21.3 gain (O >2) in these 2 groups are shown on the right panel. *P < .0001. (C) Spearman correlation between PEG10 mRNA expression and percentages of nuclei with 7q21.3 gain in MF lesions. n = 39, r = 0.667, **P < .0001. (D) PEG10 mRNA expression and percentages of nuclei with 7q21.3 gain before and after disease progression in 2 MF patients. Pt, patient. (E) PEG10 allelic expression patterns in MF-LCT (n = 8) and MF-NLCT (n = 8) samples from RNA-seq data. (F) Schematic description of the detected CpG sites at PEG10 promoter region. (G) Quantitative methylation analysis on CpG sites at PEG10 promoter region among MF-LCT group (n = 6) and MF-NLCT group (n = 6). Average PEG10 promoter methylation levels of each sample are shown on the right panel. Methylation level 1 represents 100% methylated CpG dinucleotides on this site.
Furthermore, to determine the influence of CNVs and promoter demethylation on the allelic expression of PEG10, we performed PEG10 genotyping and identified 18 samples with heterozygous SNPs in the 49 RNA-seq cohort. Further read counts analysis over heterozygous SNPs from RNA-seq data classified the 16 MF samples (2 MF-NLCT samples with undetectable read counts) into monoallelic, biased, and biallelic expression groups based on previously reported criteria.45 As expected, monoallelic expression patterns were seen in most MF samples (Figure 3E, supplemental Table 6), indicating that PEG10 maintained its imprinted pattern in the context of carrying CNVs. Only sample L520-2 showed biallelically expressed PEG10 with high PEG10 levels but relatively low percentage of 7q21.3 gains, supporting the loss-of-imprinting (LOI) of PEG10 in this sample, which was frequently seen in cancers and accounted for the upregulation of imprinted genes.46
Of note, a few NLCT patients with low PEG10 levels also demonstrated relatively high 7q21.3 gains (N407, N470, N292). To explain this discrepancy, we evaluated the methylation levels at the CpG islands of PEG10 promoter on 12 MF skin samples (6 LCT vs 6 NLCT) (Figure 3F) via bisulfite sequencing and mass spectrometry since promoter DNA methylation has been reported as the most important epigenetic regulator for gene dosage.47 Significant PEG10 promoter methylations were observed in NLCT samples. In contrast, most MF-LCT cases showed low methylation levels at PEG10 promoter (Figure 3G, supplemental Table 7). These results indicated that promoter DNA demethylation also accounted for PEG10 overexpression in MF-LCT.
Loss of CDKN2A-CDKN2B at 9p21 is one of the most frequently occurring chromosomal aberrations in MF-LCT, with high frequencies of 71%12 and 56%,13 acting as an independent predictor of reduced survival, prompting us to explore the relationship between PEG10 amplification at 7q21.3 and CDKN2A loss in MF. Consistent with previous reports, FISH analyses with probes detecting CDKN2A and centromere of chr9 showed higher CDKN2A loss in MF-LCT samples (Figure S3D,E).12,13 However, we did not observe a significant correlation between 7q21.3 gains with CDKN2A losses (Figure S3F), suggesting they are independent events in LCT. Interestingly, survival analyses on patients with FISH results (n = 36) demonstrated that those with both 7q21.3 gain and CDKN2A loss had the most inferior prognosis (Figure S3G), although the individual P values between the 7q21.3 gain group and 7q21.3 gain/CDKN2A loss group were not significant, which may be due to the limited sample size. Therefore, the prognostic values of the double-hit genomic aberrations in MF-LCT warrant further study in larger cohorts.
Collectively, these results indicate that genomic gains of 7q21.3, promoter demethylation, and LOI of PEG10 cooperatively result in PEG10 upregulation in MF-LCT.
PEG10 regulates cell size, confers growth advantage, and induces drug resistance in CTCL cells
To investigate the function of ectopic PEG10 expression in large-transformed CTCL cells, we silenced PEG10 expression in HH cells and overexpressed PEG10 isoforms (RF1b, RF1b/2, RF1b/2+CNF) in Hut78 and Myla cells via lentivirus-mediated transduction (Figure 4A). We observed decreased cell size in HH upon PEG10 silencing by both flow cytometry48 and average cell area calculation49(Figure 4B,C). When examining the ability to form tumors in vitro with colony-forming cell (CFC) assays in semisolid cultures, PEG10 silencing showed significantly reduced CFC output in terms of the number and size of the colonies (Figure 4D). Conversely, a significant increase of CFC output was observed in PEG10-RF1b overexpressed cells (Figures 4E, S4A), whereas PEG10-RF1b/2 and RF1b/2+CNF overexpression showed only moderate effects. The growth advantages conferred by PEG10 in both knockdown and overexpression systems were confirmed in mouse xenograft models in vivo (Figure 4F,G).
![PEG10 regulates cell size, facilitates tumor-forming ability and HDACi/Pi resistance in CTCL cells. (A) Suppression of PEG10 protein expression in HH cells by lentiviral transduction with 2 independent shRNA sequences (shPEG10-1, shPEG10-2) and overexpression of different PEG10 isoforms in Hut78 and Myla cells by lentiviral transduction with vectors expressing RF1b, RF1b/2, RF1b/2+CNF isoforms, respectively. HH cells transduced with scrambled shRNA (Ctrl) as well as Hut78 and Myla cells transduced with empty vectors (vector) served as controls. (B) Representative flow cytometry profiles of cell size (forward scatter [FSC], height on a linear scale) among control (Ctrl) and PEG10-suppressed (shPEG10) HH cells. Mean FSC signal intensity shown on the right panel. (C) Representative confocal images of successfully transfected GFP+ (green) control (Ctrl) and PEG10-suppressed (shPEG10) HH cells. Average cell area (pixel2) was calculated by Image J (right panel). (D) The number of colonies formed in the CFC assay among PEG10-suppressed (shPEG10-1, shPEG10-2) HH cells and control cells (Ctrl). (E) The number of colonies formed in the CFC assay among Hut78 cells with overexpression of RF1b, RFb1/2, RF1b/2+CNF, and control cells (vector). (F,G) Macroscopic pictures of xenograft mice and tumors after subcutaneously injecting control (Ctrl) and PEG10-suppressed (shPEG10) HH cells (F), as well as control (vector) and RF1b-overexpressed (RF1b) Hut78 cells (G) (n = 3, each). Median tumor volume was measured over time (right panels). (H,I) MTS-based cell viability assay of PEG10-suppressed (shPEG10) and control (Ctrl) HH cells under exposure to increasing dose of romidepsin (H), bortezomib (I) for 48 hours. (J,K) RF1b-overexpressed (RF1b) Hut78 cells and control cells (vector) were exposed to an increasing dose of romidepsin (J), bortezomib (K). Cell viability was evaluated after 48 hours. (L,M) Cleavage of caspase-3 was detected in HH cells with PEG10 silencing (shPEG10) and control cells (Ctrl) after treatment with different-dose SAHA (L), bortezomib (M) for 72 hours via western blot analysis. Data are represented as the mean standard deviation. *P < .05; **P < .01.](https://ash.silverchair-cdn.com/ash/content_public/journal/blood/139/4/10.1182_blood.2021012091/3/m_bloodbld2021012091f4a.png?Expires=1770202290&Signature=Eh~E-IqOMDyK443zWGXLggsuj33~H9wx9A0xVyuvbcTyZa4sep-pZcKCodPAnGaXtGniM8gzd03HosG5-7HXyxmQ9ctj3rTyRFkToRWVtRk9mgqClzdO~NBkDSSwwo79oET5ER9KkvtavVUpVRZFJdLqSS4gOwenJ9ZjnpsriGGXKU-Vnq-3K7PDuOKW8KJvIiv73MwQbl0JYl8KOnIs0t7F8a0v1lW7WmNbSTwfTMlHZXJTzM-9Kp56zebT3mPL7pXZdQZHMTs0EAvUsU0mdoI3xbuYFRmBl2aHoDnc26OPL3HJoJ1d2exIsdYsiHz~evkHSIqI4DO0LEl61bCuwg__&Key-Pair-Id=APKAIE5G5CRDK6RD3PGA)
![PEG10 regulates cell size, facilitates tumor-forming ability and HDACi/Pi resistance in CTCL cells. (A) Suppression of PEG10 protein expression in HH cells by lentiviral transduction with 2 independent shRNA sequences (shPEG10-1, shPEG10-2) and overexpression of different PEG10 isoforms in Hut78 and Myla cells by lentiviral transduction with vectors expressing RF1b, RF1b/2, RF1b/2+CNF isoforms, respectively. HH cells transduced with scrambled shRNA (Ctrl) as well as Hut78 and Myla cells transduced with empty vectors (vector) served as controls. (B) Representative flow cytometry profiles of cell size (forward scatter [FSC], height on a linear scale) among control (Ctrl) and PEG10-suppressed (shPEG10) HH cells. Mean FSC signal intensity shown on the right panel. (C) Representative confocal images of successfully transfected GFP+ (green) control (Ctrl) and PEG10-suppressed (shPEG10) HH cells. Average cell area (pixel2) was calculated by Image J (right panel). (D) The number of colonies formed in the CFC assay among PEG10-suppressed (shPEG10-1, shPEG10-2) HH cells and control cells (Ctrl). (E) The number of colonies formed in the CFC assay among Hut78 cells with overexpression of RF1b, RFb1/2, RF1b/2+CNF, and control cells (vector). (F,G) Macroscopic pictures of xenograft mice and tumors after subcutaneously injecting control (Ctrl) and PEG10-suppressed (shPEG10) HH cells (F), as well as control (vector) and RF1b-overexpressed (RF1b) Hut78 cells (G) (n = 3, each). Median tumor volume was measured over time (right panels). (H,I) MTS-based cell viability assay of PEG10-suppressed (shPEG10) and control (Ctrl) HH cells under exposure to increasing dose of romidepsin (H), bortezomib (I) for 48 hours. (J,K) RF1b-overexpressed (RF1b) Hut78 cells and control cells (vector) were exposed to an increasing dose of romidepsin (J), bortezomib (K). Cell viability was evaluated after 48 hours. (L,M) Cleavage of caspase-3 was detected in HH cells with PEG10 silencing (shPEG10) and control cells (Ctrl) after treatment with different-dose SAHA (L), bortezomib (M) for 72 hours via western blot analysis. Data are represented as the mean standard deviation. *P < .05; **P < .01.](https://ash.silverchair-cdn.com/ash/content_public/journal/blood/139/4/10.1182_blood.2021012091/3/m_bloodbld2021012091f4b.png?Expires=1770202290&Signature=aeAAtsCP8Oeo2mSHgN9UJZrAvJbe-VgCwBrkUCXYLH1u3CMnmAE8QNdr1mtDakWYXkhxQGb6KWKwZrEyHgZXT-GoZ6-hi5ySqEzz5DZameNK3nBQ5gi~nZnMuZGtbFACsYBaNZuNgEELbNDhJTPKha7JKe0pErvjdfB7DieaS5m4hqA1atQJaZKRv-R19FqK5rBDUNKxgSZme9YckIorWs8Un4aHM8156O1NStr9CdMy~CC8scsP24acQQgOOj64T1GqmV5eFVY2Ycn7DctZjj9Zkdxzt0ELiZRx3nkj4nPJBg0I8r8rGRZlr8t38ulk1M0oyyNHX8Hqo2xHhLrHug__&Key-Pair-Id=APKAIE5G5CRDK6RD3PGA)
PEG10 regulates cell size, facilitates tumor-forming ability and HDACi/Pi resistance in CTCL cells. (A) Suppression of PEG10 protein expression in HH cells by lentiviral transduction with 2 independent shRNA sequences (shPEG10-1, shPEG10-2) and overexpression of different PEG10 isoforms in Hut78 and Myla cells by lentiviral transduction with vectors expressing RF1b, RF1b/2, RF1b/2+CNF isoforms, respectively. HH cells transduced with scrambled shRNA (Ctrl) as well as Hut78 and Myla cells transduced with empty vectors (vector) served as controls. (B) Representative flow cytometry profiles of cell size (forward scatter [FSC], height on a linear scale) among control (Ctrl) and PEG10-suppressed (shPEG10) HH cells. Mean FSC signal intensity shown on the right panel. (C) Representative confocal images of successfully transfected GFP+ (green) control (Ctrl) and PEG10-suppressed (shPEG10) HH cells. Average cell area (pixel2) was calculated by Image J (right panel). (D) The number of colonies formed in the CFC assay among PEG10-suppressed (shPEG10-1, shPEG10-2) HH cells and control cells (Ctrl). (E) The number of colonies formed in the CFC assay among Hut78 cells with overexpression of RF1b, RFb1/2, RF1b/2+CNF, and control cells (vector). (F,G) Macroscopic pictures of xenograft mice and tumors after subcutaneously injecting control (Ctrl) and PEG10-suppressed (shPEG10) HH cells (F), as well as control (vector) and RF1b-overexpressed (RF1b) Hut78 cells (G) (n = 3, each). Median tumor volume was measured over time (right panels). (H,I) MTS-based cell viability assay of PEG10-suppressed (shPEG10) and control (Ctrl) HH cells under exposure to increasing dose of romidepsin (H), bortezomib (I) for 48 hours. (J,K) RF1b-overexpressed (RF1b) Hut78 cells and control cells (vector) were exposed to an increasing dose of romidepsin (J), bortezomib (K). Cell viability was evaluated after 48 hours. (L,M) Cleavage of caspase-3 was detected in HH cells with PEG10 silencing (shPEG10) and control cells (Ctrl) after treatment with different-dose SAHA (L), bortezomib (M) for 72 hours via western blot analysis. Data are represented as the mean standard deviation. *P < .05; **P < .01.
PEG10 regulates cell size, facilitates tumor-forming ability and HDACi/Pi resistance in CTCL cells. (A) Suppression of PEG10 protein expression in HH cells by lentiviral transduction with 2 independent shRNA sequences (shPEG10-1, shPEG10-2) and overexpression of different PEG10 isoforms in Hut78 and Myla cells by lentiviral transduction with vectors expressing RF1b, RF1b/2, RF1b/2+CNF isoforms, respectively. HH cells transduced with scrambled shRNA (Ctrl) as well as Hut78 and Myla cells transduced with empty vectors (vector) served as controls. (B) Representative flow cytometry profiles of cell size (forward scatter [FSC], height on a linear scale) among control (Ctrl) and PEG10-suppressed (shPEG10) HH cells. Mean FSC signal intensity shown on the right panel. (C) Representative confocal images of successfully transfected GFP+ (green) control (Ctrl) and PEG10-suppressed (shPEG10) HH cells. Average cell area (pixel2) was calculated by Image J (right panel). (D) The number of colonies formed in the CFC assay among PEG10-suppressed (shPEG10-1, shPEG10-2) HH cells and control cells (Ctrl). (E) The number of colonies formed in the CFC assay among Hut78 cells with overexpression of RF1b, RFb1/2, RF1b/2+CNF, and control cells (vector). (F,G) Macroscopic pictures of xenograft mice and tumors after subcutaneously injecting control (Ctrl) and PEG10-suppressed (shPEG10) HH cells (F), as well as control (vector) and RF1b-overexpressed (RF1b) Hut78 cells (G) (n = 3, each). Median tumor volume was measured over time (right panels). (H,I) MTS-based cell viability assay of PEG10-suppressed (shPEG10) and control (Ctrl) HH cells under exposure to increasing dose of romidepsin (H), bortezomib (I) for 48 hours. (J,K) RF1b-overexpressed (RF1b) Hut78 cells and control cells (vector) were exposed to an increasing dose of romidepsin (J), bortezomib (K). Cell viability was evaluated after 48 hours. (L,M) Cleavage of caspase-3 was detected in HH cells with PEG10 silencing (shPEG10) and control cells (Ctrl) after treatment with different-dose SAHA (L), bortezomib (M) for 72 hours via western blot analysis. Data are represented as the mean standard deviation. *P < .05; **P < .01.
Our RNA-seq findings showed HDACi-resistance gene signatures and enriched ubiquitin-proteasome pathway in MF-LCT, prompting us to investigate whether PEG10 impacts the response to HDACis and proteasome inhibitors (Pis).50 PEG10 silencing sensitized HH cells to 2 HDACis widely used in CTCL, romidepsin (Figures 4H, S4B), and suberoylanilide hydroxamic acid (SAHA) (Figure S4C,D), as well as 2 Pis, bortezomib (Figures 4I, S4E) and carfilzomib (Figure S4F,G). Conversely, PEG10-RF1b overexpression conferred resistance to these drugs in Hut78 (Figures 4J,K, S4H-M) and Myla cells (Figure S4N). Consistently, HDACi and Pi-induced cleavage of caspase-3 was enhanced by PEG10 silencing (Figure 4L,M) and inhibited by PEG10-RF1b overexpression (Figure S4O,P), confirming the roles of PEG10 in resisting HDACii-induced apoptosis. These results show that PEG10 confers aggressive phenotypes in CTCL cells, including enlarged cell size, increased tumor progression, and drug resistance.
PEG10 potentiates large-cell transformation via the PEG10/KLF2/NF-κB axis
PEG10 protein has multiple functional domains,39,51 but its downstream signaling remains largely unknown. Transcriptome sequencing was performed in CTCL lines with PEG10 knockdown/overexpression to define its downstream effectors. Spearman correlation coefficients were calculated between the cell lines with PEG10 knockdown and clinical samples based on DEGs identified by RNA-seq (fold change ≥2 or ≤−2 and P < .05). Compared to control cells, PEG10-silenced cells showed a significantly lower degree of similarity with MF-LCT, suggesting that PEG10 silencing reversed, at least partially, the LCT gene signatures in MF (Figure 5A). Furthermore, several pathways enriched in MF-LCT were affected by PEG10 knockdown/overexpression in cell lines. The romidepsin-response gene signature was enriched in PEG10-silenced cells, while the romidepsin-resistance gene signature was enriched in PEG10-overexpressed cells (Figure S5A,B, supplemental Table 4).31 These data revealed the roles of PEG10 in determining the aberrant transcriptional profiles of MF-LCT.
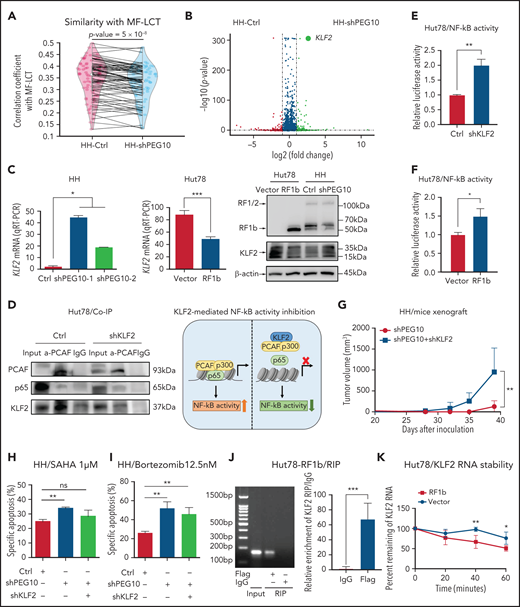
PEG10 confers growth advantage and HDACi/Pi resistance via a KLF2/NF-κB axis in CTCL cells. (A) Spearman correlation analysis of gene expression from control (Ctrl) as well as PEG10-silenced (shPEG10) HH cells with MF-LCT samples. The 2 dots on each line represent the correlation coefficients between each MF-LCT sample with a Ctrl as well as a shPEG10 sample, respectively. Paired P = 5 x 10⁻⁸. (B) Volcano plot of upregulated (red) and downregulated (blue) DEGs (fold change ≥2 or ≤−2 and P < .05) between PEG10-suppressed (shPEG10) and control (Ctrl) HH cells and KLF2 gene pointed out in green color. (C) KLF2 mRNA and protein levels of PEG10-suppressed (shPEG10-1, shPEG10-2) HH cells, RF1b-overexpressed (RF1b) Hut78 cells, and their control cells (Ctrl; vector). (D) Coimmunoprecipitation of nuclear extracts from control (Ctrl) and KLF2-suppressed (shKLF2) Hut78 cells using a PACF antibody (lane 2 and 5) or normal rabbit IgG (lane 3 and 6) with protein A/G agarose. PCAF, p65, and KLF2 were identified by western blot. Lanes 1 and 4 show input control, respectively. Schematic model of KLF2-mediated NF-κB activity inhibition is shown on the right panel. (E,F) NF-κB luciferase activity of KLF2-silenced (shKLF2) Hut78 cells and control cells (Ctrl); (E) RF1b-overexpressed (RF1b) Hut78 cells and control cells (vector); (F) via NF-κB luciferase reporter assay. (G) Median tumor volume of xenograft tumors (n = 5, each) after subcutaneously injecting PEG10-suppressed (shPEG10) HH cells, PEG10 and KLF2-suppressed (shPEG10 + shKLF2) HH cells were measured over time. (H,I) Specific apoptosis induced by 1 μM SAHA (H) and 12.5 nM bortezomib (I) for 48 hours, respectively, in different transduced HH cells. Ctrl indicates scrambled shRNA controls; shPEG10 and shKLF2 indicate shRNA sequences targeting PEG10 and KLF2, respectively. (J) RIP assay was executed in cell lysates from PEG10-RF1b overexpressed Hut78 cells using anti-Flag or anti-IgG, then the enrichment of KLF2 was detected by RT-PCR and qRT-PCR. (K) RNA stability assays were performed in PEG10-RF1b overexpressed Hut78 cells and control cells using Actinomycin D to disrupt RNA synthesis, and the degradation levels of the KLF2 mRNA were measured over 0, 20, 40, and 60 minutes. Data are represented as the mean standard deviation. *P < .05; **P < .01; ***P < .001; ns, no significance.
PEG10 confers growth advantage and HDACi/Pi resistance via a KLF2/NF-κB axis in CTCL cells. (A) Spearman correlation analysis of gene expression from control (Ctrl) as well as PEG10-silenced (shPEG10) HH cells with MF-LCT samples. The 2 dots on each line represent the correlation coefficients between each MF-LCT sample with a Ctrl as well as a shPEG10 sample, respectively. Paired P = 5 x 10⁻⁸. (B) Volcano plot of upregulated (red) and downregulated (blue) DEGs (fold change ≥2 or ≤−2 and P < .05) between PEG10-suppressed (shPEG10) and control (Ctrl) HH cells and KLF2 gene pointed out in green color. (C) KLF2 mRNA and protein levels of PEG10-suppressed (shPEG10-1, shPEG10-2) HH cells, RF1b-overexpressed (RF1b) Hut78 cells, and their control cells (Ctrl; vector). (D) Coimmunoprecipitation of nuclear extracts from control (Ctrl) and KLF2-suppressed (shKLF2) Hut78 cells using a PACF antibody (lane 2 and 5) or normal rabbit IgG (lane 3 and 6) with protein A/G agarose. PCAF, p65, and KLF2 were identified by western blot. Lanes 1 and 4 show input control, respectively. Schematic model of KLF2-mediated NF-κB activity inhibition is shown on the right panel. (E,F) NF-κB luciferase activity of KLF2-silenced (shKLF2) Hut78 cells and control cells (Ctrl); (E) RF1b-overexpressed (RF1b) Hut78 cells and control cells (vector); (F) via NF-κB luciferase reporter assay. (G) Median tumor volume of xenograft tumors (n = 5, each) after subcutaneously injecting PEG10-suppressed (shPEG10) HH cells, PEG10 and KLF2-suppressed (shPEG10 + shKLF2) HH cells were measured over time. (H,I) Specific apoptosis induced by 1 μM SAHA (H) and 12.5 nM bortezomib (I) for 48 hours, respectively, in different transduced HH cells. Ctrl indicates scrambled shRNA controls; shPEG10 and shKLF2 indicate shRNA sequences targeting PEG10 and KLF2, respectively. (J) RIP assay was executed in cell lysates from PEG10-RF1b overexpressed Hut78 cells using anti-Flag or anti-IgG, then the enrichment of KLF2 was detected by RT-PCR and qRT-PCR. (K) RNA stability assays were performed in PEG10-RF1b overexpressed Hut78 cells and control cells using Actinomycin D to disrupt RNA synthesis, and the degradation levels of the KLF2 mRNA were measured over 0, 20, 40, and 60 minutes. Data are represented as the mean standard deviation. *P < .05; **P < .01; ***P < .001; ns, no significance.
NF-κB signaling, enriched in MF-LCT samples, is a critical antiapoptosis and proproliferation pathway in CTCL.52 Inhibition of NF-κB-dependent signaling has been reported to inhibit cell survival53 and overcome resistance to Pi and HDACi.54,55 Intriguingly, Kruppel Like Factor 2 (KLF2), a known NF-κB negative regulator, was the top-ranked gene regulated by PEG10 (derepressed upon PEG10 silencing and downregulated upon PEG10 overexpression) (Figure 5B,C, supplemental Table 8). Previously annotated KLF2 target genes were upregulated upon PEG10 silencing in HH cells56 (Figure S5C), suggesting KLF2 may act as a key downstream effector of PEG10. KLF2 inhibits NF-κB activity by competitively combining critical NF-κB transcriptional coactivators p300/PCAF and disturbing the recruitment of this complex to the promoter of downstream genes.57 Therefore, we assumed that PEG10 may activate NF-κB signaling by reducing KLF2 levels and facilitating the p300/PCAF/NF-κB interaction and their recruitment to NF-κB target genes. Coimmunoprecipitation confirmed the physical interaction between KLF2 and PCAF in CTCL cells. KLF2 silencing enhanced the interaction between PCAF and p65 in Hut78 cells (Figure 5D, S5D). Further NF-κB luciferase reporter assay indicated that either KLF2 silencing or PEG10-RF1b overexpression in Hut78 cells facilitated NF-κB transcriptional activity (Figure 5E,F). To validate this PEG10/KLF2/NF-κB regulating axis in PEG10-silenced CTCL cells, we overexpressed KLF2 in 2 CTCL cell lines with low intrinsic KLF2 levels, Hut78 and Myla, and performed NF-κB luciferase reporter assays, since HH cells (the PEG10-silence cell model) are resistant to electroporation.58,59 KLF2 overexpression inhibited NF-κB transcriptional activity in both cell lines (Figure S5E,F), confirming the results in PEG10-overexpressed cells. Next, we silenced KLF2 in PEG10-silenced HH cells (Figure S5G) and confirmed that KLF2 suppression could rescue the growth inhibition (Figure 5G) and increased sensitivity to SAHA or bortezomib mediated by PEG10 suppression (Figure 5H,I).
We next aimed to explore the mechanisms of how PEG10 regulates KLF2 expression in CTCL. As a cytoplasmic protein, PEG10 has a conserved CCHC-type zinc finger motif,41 which may bind to and affect the stabilization of cellular RNAs in the cytoplasm.60 Therefore, we performed RNA immunoprecipitation (RIP) assays and RNA stability assays in Hut78 cells with PEG10-RF1b overexpression and showed that PEG10 binds to KLF2 mRNA in the cytoplasm and promotes its degradation (Figure 5J,K). Our findings suggested that the overexpressed PEG10 in LCT samples may inhibit KLF2 expression by binding to KLF2 mRNA and affecting its stabilization.
Collectively, these results indicate that PEG10 reprograms the transcriptional profiles of MF and facilitates cell proliferation and drug resistance via a PEG10/KLF2/NF-κB axis, thereby driving the LCT in MF.
Transcriptionally repressing PEG10 with HLM006474 decreases CTCL cell survival and synergizes with HDAC and proteasome inhibitors
Considering that PEG10 was dysregulated in large-transformed T cells by genetic amplification-induced transcriptional upregulation, we aim to find ways to repress PEG10 expression for CTCL-LCT treatment. Transcription factors E2F1 and E2F4 have been demonstrated to bind directly to the promoter of PEG10,61 and a small molecule, HLM006474, designed for melanoma treatment, was shown to inhibit the DNA-binding activity of E2Fs.62 We observed that HLM006474 potently repressed PEG10 expression and increased KLF2 expression in a dose-dependent manner in HH and SZ4 cells with 7q21.3 amplification and high PEG10 expression (Figure 6A and S6A). HLM006474 induced remarkable apoptosis and decreased viability in PEG10-high CTCL lines (HH and SZ4), compared with PEG10-low lines (MJ and Myla), while their E2F1 and E2F4 expression levels were comparable (Figure S6B). Consistently, HH cells with PEG10 silencing showed less apoptosis upon HLM006474 treatment (Figure 6B, S6C). This effect was validated in xenograft models in vivo. Tumor growth was markedly reduced in the HLM006474 treatment group (Figure 6C,D), while the body weights of the mice were not affected (Figure 6E).
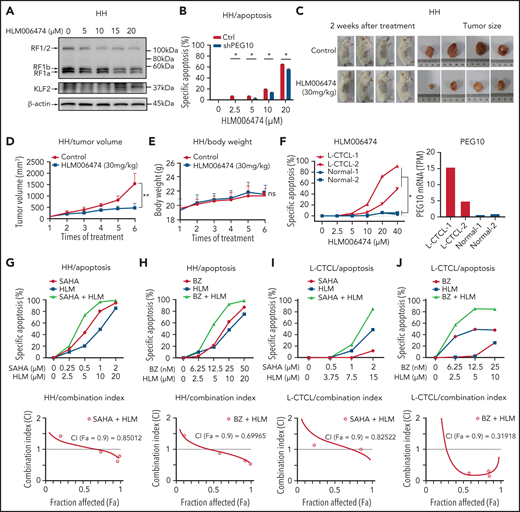
HLM006474 inhibits cell survival and synergizes with HDACi and Pi in vitro and vivo as well as patient-derived CTCL cells. (A) Protein levels of PEG10 and KLF2 in HH cells treated with increasing concentration of HLM006474 for 72 hours. (B) Specific apoptosis of PEG10-suppressed (shPEG10) and control (Ctrl) HH cells under exposure to different-dose HLM006474 for 48 hours. (C) Macroscopic pictures of xenograft tumors after subcutaneously injecting HH cells. Tumor-bearing animals were randomized into 2 groups (n = 4, each) and intraperitoneally injected with either 20% captisol as vehicle control or 30 mg/kg HLM006474 3 times a week for 2 weeks. (D,E) Median tumor volume (D) and body weights (E) in control and treated xenograft mice were measured over treatment times. (F) Specific apoptosis of PBMCs from 2 leukemic CTCL patients (L-CTCL) and healthy donors (Normal) under exposure to increasing concentration of HLM006474 for 24 hours. PEG10 mRNA expression levels (TPM) are shown on the right panel. (G,H) Specific apoptosis and combination index for the combination of HLM006474 (HLM) with SAHA (G) and with bortezomib (BZ) (H) in HH cells. (I,J) Specific apoptosis and combination index for the combination of HLM006474 (HLM) with SAHA (I) and with bortezomib (BZ) (J) in PBMCs from L-CTCL patients. Data are represented as the mean standard deviation. *P < .05; **P < .01. ns, no significance; CI, combination index; Fa, fraction affected.
HLM006474 inhibits cell survival and synergizes with HDACi and Pi in vitro and vivo as well as patient-derived CTCL cells. (A) Protein levels of PEG10 and KLF2 in HH cells treated with increasing concentration of HLM006474 for 72 hours. (B) Specific apoptosis of PEG10-suppressed (shPEG10) and control (Ctrl) HH cells under exposure to different-dose HLM006474 for 48 hours. (C) Macroscopic pictures of xenograft tumors after subcutaneously injecting HH cells. Tumor-bearing animals were randomized into 2 groups (n = 4, each) and intraperitoneally injected with either 20% captisol as vehicle control or 30 mg/kg HLM006474 3 times a week for 2 weeks. (D,E) Median tumor volume (D) and body weights (E) in control and treated xenograft mice were measured over treatment times. (F) Specific apoptosis of PBMCs from 2 leukemic CTCL patients (L-CTCL) and healthy donors (Normal) under exposure to increasing concentration of HLM006474 for 24 hours. PEG10 mRNA expression levels (TPM) are shown on the right panel. (G,H) Specific apoptosis and combination index for the combination of HLM006474 (HLM) with SAHA (G) and with bortezomib (BZ) (H) in HH cells. (I,J) Specific apoptosis and combination index for the combination of HLM006474 (HLM) with SAHA (I) and with bortezomib (BZ) (J) in PBMCs from L-CTCL patients. Data are represented as the mean standard deviation. *P < .05; **P < .01. ns, no significance; CI, combination index; Fa, fraction affected.
Next, to interrogate the clinical application of HLM006474, PBMCs from 4 leukemic CTCL patients and 4 healthy donors were treated with HLM006474. All the CTCL samples showed remarkable elevated PEG10 expression compared with control cells, while their E2F1 and E2F4 expressions were comparable with control cells (Figure 6F, S6D,E). HLM006474 induced remarkable apoptosis in primary CTCL cells, while control cells were well tolerated, indicating that HLM006474-induced apoptosis was specific for PEG10-high malignant cells in primary CTCL samples.
Moreover, HLM006474 sensitized CTCL cell lines to HDACis (Figure 6G, S6F) and Pis (Figure 6H, S6G), respectively, and achieved significant synergistic effects with these drugs, as evaluated by drug combination studies. The synergistic effects were confirmed in primary CTCL cells (Figure 6I,J). Collectively, targeting PEG10 transcription with HLM006474 inhibits CTCL cell survival and synergizes with HDACis and Pis, serving as a promising treatment of late-stage CTCLs.
Discussion
LCT represents the highly aggressive status of CTCL and the most challenging clinical situation in the management of CTCL.5,63 With a large cohort of MF patients and integrated transcriptomic and genomic analyses, we identified genomic 7q21.3 gains and ectopic PEG10 expression in the large-transformed MF cells. We demonstrated the critical roles of PEG10 in driving LCT, discovered the downstream effectors of PEG10, and identified approaches to pharmacologically repress PEG10 and reverse the aggressive phenotypes in CTCL (visual abstract).
Tumor development is a multistep process. Tumor cells acquire accelerated evolution by accumulating genomic aberrations due to chromosomal instability.64 Our results shed light on the molecular mechanisms of the LCT development in CTCL. Our data, demonstrating enriched genes in multiple regions of chr7q in LCT samples, was highly consistent with the results from previous aCGH studies.8,9 With a cohort of 22 tumor-stage MF patients, Van Doorn et al showed that the most highly recurrent CNVs were gains of regions on chr7, including 7q36, 7q21-7q22, 7q32-7q35, 7q11.2, and 7p14-7p13, observed in 59%, 55%, 55%, 50%, and 45% of MF samples, respectively, while gains of 7q21-22 also occurred in 20% of Sézary syndromes.8 This consistency revealed the high validity of our approach to infer CNVs from RNA-seq data. Moreover, these data suggested that 7q gain was a late-onset process during MF progression, and 7q21-22 appeared as a critical region common to MF and Sézary syndrome during this process. This hypothesis was further supported by 7q21.3 gains after tumor progression in patients with 2 biopsied samples. 7q21.3 is a well-known imprinted cluster.65 LOI refers to loss of monoallelic gene regulation, which is seen frequently and precociously in multiple human cancers and leads to tumorigenesis.46 Interestingly, our data showed that LOI of PEG10 occurred in only a minority of MF-LCT patients, while monoallelic expression of PEG10 was observed in most of the MF-LCT patients with 7q21.3 gains, consistent with a recent report showing that cancer cell tends to maintain the correct imprinting profiles if it carries CNVs.66
Although the expressions of PEG10 mRNA or its long noncoding RNA have been reported in lymphocyte-derived tumors, such as B-cell chronic lymphocytic leukemia,67 diffuse large B-cell lymphoma,68 T-cell lymphoblastic lymphoma,69 and Sézary syndrome,70 little is known about the biological roles of PEG10 in these malignancies. Here we identified a PEG10/KLF2/NF-κB axis in driving LCT in CTCL. Aberrant or constitutive NF-κB activation has been associated with many human malignancies, especially T-cell malignancies.71 Moreover, HDACis and Pis exert their antitumor roles by suppressing NF-κB activation.72-74 In CTCLs, NF-κB plays vital roles in cell survival and apoptosis resistance.59,75 Our results unraveled a previously unreported mechanism of aberrant NF-κB activation, driven by ectopic PEG10 expression and a PEG10/KLF2/NF-κB axis. Here we demonstrated that PEG10-mediated NF-κB activation is a crucial mechanism mediating cell growth and HDACi/Pi resistance in CTCL. Either overexpressing PEG10 or suppressing KLF2 could enhance this process, confirming that KLF2/NF-κB is a major mediator for PEG10 functions in CTCL.
Clinical trials for advanced T-cell lymphoma have yielded predictably unsatisfactory results.76 Given the restricted expression of PEG10 in transformed malignant T cells and limited adult organs, PEG10 may serve as an ideal target for CTCL treatment. However, there is no PEG10 inhibitor available. Alternatively, we showed that E2F inhibitor, HLM006474, effectively blocked PEG10 expression and derepressed KLF2 levels in CTCL cells and showed minimal toxicity on normal cells. Although PEG10 was not the only gene regulated by E2Fs, our data showed decreased sensitivity to HLM006474 in PEG10-silenced cells, suggesting that suppressing PEG10 is one of the major effects of this molecule in CTCL. More intriguingly, HLM006474 showed remarkable synergistic effects with HDACis and Pis in primary CTCL cells and cell lines. The relatively low and unpredictable treatment response of HDACis and Pis is a huge obstacle in clinical settings. Romidepsin77 and SAHA78 are FDA-approved HDACis for CTCL. However, the overall response rate of advanced-stage CTCL patients was 38% for romidepsin and less than 30% for SAHA.21 Bortezomib, a first-generation Pi, showed a 67% overall response rate and 17% complete remission rate in CTCL patients in a phase 2 trial79 but lacked sustainable efficacy. Our results set a stage for the combinative application of PEG10 repression and HDACiPi in future CTCL clinical trials, especially for patients with LCT.
In summary, our study provides novel insights into the molecular pathogenesis of CTCL progression, revealing PEG10 as a potent driver for LCT. These data links 7q21.3 amplification to ectopic PEG10 expression and poor prognosis and provide evidence that PEG10 regulates NF-κB activity in malignant T cells. Our findings set the proof of principle for PEG10 inhibition in the treatment of late-stage CTCLs, which currently lack effective therapies.
Acknowledgments
This study was supported by the National Nature Science Foundation of China (Grant No: 81922058, Yang Wang, 32022016, Xianwen Ren), National Youth Top-Notch Talent Support Program (Yang Wang), and Peking University Medical Cross Research Seed Fund (Yang Wang, Xianwen Ren). UMHS-PUHSC Joint Institute Discovery award (Yang Wang, Lam Tsoi, and Trilokraj Tejasvi). Thanks for the generous gift of PEG10 expression plasmids (RF1b/2+CNF) from Martin E. Gleave, Shusuke Akamatsu, and Fan Zhang (Vancouver Prostate Centre, Department of Urologic Sciences, University of British Columbia, Vancouver, BC, Canada).
Authorship
Contribution: Y.W. and X.R. conceived the study and directed and supervised research; X.R. was responsible for bioinformatics investigation; Y.W. and P.T. reviewed the histopathologic diagnoses; Y.W., P.T., S.Y., and H.L. participated in the preparation of clinical samples; F.L., S.Y., Y.G., and Y.Q. gathered detailed clinical information; F.L., Y.G., B.X., S.X., J.S., Z.C., X.L., Y. Li, Y. Lin, and Y. Wen conducted experiments and interpreted the data; T.T. and L.T. helped with the design of the study as well as provided advice on the analysis of RNA-seq data; all authors contributed to manuscript preparation; F.L. wrote the original manuscript; Y.W. and X.R. reviewed and edited the manuscript; and Y.W. and X.R. are the corresponding authors of this manuscript.
Conflict-of-interest disclosure: The authors declare no competing financial interests.
Correspondence: Yang Wang, Department of Dermatology and Venereology, Peking University First Hospital, No.8 Xishiku Street, District, Beijing 100034, China; e-mail: yangwang_dr@bjmu.edu.cn; Xianwen Ren, Biomedical Pioneering Innovation Center (BIOPIC), Peking University, Beijing 100871, China; e-mail: renxwise@pku.edu.cn.
The RNA-seq data were deposited in the Gene Expression Omnibus database under accession number GSE168508.
For original data, please contact Yang Wang (yangwang_dr@bjmu.edu.cn).
The online version of this article contains a data supplement.
The publication costs of this article were defrayed in part by page charge payment. Therefore, and solely to indicate this fact, this article is hereby marked “advertisement” in accordance with 18 USC section 1734.
