

Key Points
MCT4 or NHE1 proton exporters alkalinize intracellular pH to enhance gatekeeper metabolic enzyme activity and enforce anabolism.
Inhibiting proton export eliminates AML LIC; increasing it enhances normal HSPC growth.

Abstract
Proton export is often considered a detoxifying process in animal cells, with monocarboxylate symporters coexporting excessive lactate and protons during glycolysis or the Warburg effect. We report a novel mechanism by which lactate/H+ export is sufficient to induce cell growth. Increased intracellular pH selectively activates catalysis by key metabolic gatekeeper enzymes HK1/PKM2/G6PDH, thereby enhancing glycolytic and pentose phosphate pathway carbon flux. The result is increased nucleotide levels, NADPH/NADP+ ratio, and cell proliferation. Simply increasing the lactate/proton symporter monocarboxylate transporter 4 (MCT4) or the sodium-proton antiporter NHE1 was sufficient to increase intracellular pH and give normal hematopoietic cells a significant competitive growth advantage in vivo. This process does not require additional cytokine triggers and is exploited in malignancy, where leukemogenic mutations epigenetically increase MCT4. Inhibiting MCT4 decreased intracellular pH and carbon flux and eliminated acute myeloid leukemia–initiating cells in mice without cytotoxic chemotherapy. Intracellular alkalization is a primitive mechanism by which proton partitioning can directly reprogram carbon metabolism for cell growth.
Introduction
Ion partitioning across membranes is a fundamental mechanism by which cells store energy and dynamically respond to their environment. In plants, the acid-growth theory1 invokes auxin-stimulated proton extrusion, causing expansin activation that enables cell growth. There had been no corollary of acid extrusion enabling growth in animal cells until intracellular alkalinization was recently shown to promote nonenzymatic acetylation and activation of β-catenin.2 Rather, H+ ions in the extracellular environment are generally considered a toxic by-product of glycolysis, particularly evident in aerobic glycolysis or the Warburg effect.
Ligand-receptor interactions signaling cell growth are likely much more recent in evolutionary terms than more primitive nutrient-driven mechanisms. Reasoning that cancer coopts both complex and simple growth pathways, we tested whether studying a cancer like acute myeloid leukemia (AML), where known metabolic distinctions with normal myeloid cells have been defined,3-10 might identify novel cell growth control mechanisms. We previously defined an alkaline intracellular pH (pHi) in AML compared with normal blood cells11 and here undertook a more detailed analysis of pH regulator dependence in AML.12 We focused on proton transport across membranes and examined if modifiers of pH could be attractive therapeutic targets in AML. Others have noted that inhibiting acid efflux is toxic to cancer and that oncogenic proteins bearing specific arginine-histidine transitions have enhanced function in increased pHi.13-15 We therefore hypothesized that proton partitioning across membranes may play a central role in cell growth and assessed it in the context of normal and malignant hematopoietic cells.
Ions rarely travel alone in cells and are coupled with other charged entities such as carbon metabolites. Monocarboxylate transporters (MCTs) cotransport protons and monocarboxylates like lactate and pyruvate.16 MCT1 and MCT4 are the major cotransporters for lactate uptake and efflux, respectively. MCT4 is upregulated in glycolytic cells, and its activity is driven by lactate gradients. As such, it limits lactate intracellular accumulation, with a secondary consequence of proton shifting. It can therefore be viewed as a proton exporter whose activity is linked to a glucose-replete environment.
We show that overexpression (OE) of MCT4 in normal myeloid cells increases their proliferation. It does so by elevating pHi, which activates enzymatic activity to increase glycolysis and pentose phosphate pathway (PPP) carbon flux. Particularly augmented was hexokinase, a gatekeeper shown by others to be critical in normal and malignant cells.17 Notably, multiple leukemogenic alleles alter histone signatures at the MCT4 promoter, enforcing gene expression. Reducing MCT4 caused cellular acidification and inhibition of both glycolysis and the PPP. This led to a depletion of leukemia-initiating cells (LICs) in mice. Therefore, proton shifts modulating cell growth are epigenetically coopted in AML to gain a competitive growth advantage. Targeting pHi through MCT4 inhibition may be a therapeutic approach for AML.
Methods
Cell processing
Primary human AML samples from patients were provided by A.Y.H.L. The study was approved by the institutional review board (IRB; IRB #UW05-183) at Queen Mary Hospital, Hong Kong, in accordance with the Declaration of Helsinki. Clinical information is summarized in supplemental Table 2. Mononuclear cells from blood and/or bone marrow (BM) of patients with AML were purified using Ficoll-Paque Plus (Amersham Biosciences) and stored in liquid nitrogen until use. Cord blood (CB) samples were obtained from the Pasquarello Tissue Bank–Cell Manipulation Core Facility, Dana-Farber Cancer Institute (IRB #2010P0002371). CD34+ cells were purified using the EasySep Human Cord Blood CD34 Positive Selection Kit II (STEMCELL Technologies).
Cell culture
Human AML cell lines were purchased from the American Type Culture Collection and cultured in RPMI 1640 media supplemented with 10% fetal bovine serum (FBS) and 1% penicillin/streptomycin (P/S).
A retroviral transduction model of MLL-AF9 or HoxA9-Meis1 AML was generated by infecting normal mouse guanosine monophosphate (GMP; Lin−Kit+Sca-1−CD34+CD16/32+; fluorescence-activated cell-sorted [FACS] antibodies are summarized in supplemental Table 7) by murine stem cell virus constructs. Infected cells were injected into normal C57BL/6J mice. Leukemic BM was harvested and expanded ex vivo in RPMI 1640 media supplemented with 10% FBS, 1% P/S, recombinant interleukin-3 (IL-3; 10 ng/mL), and stem cell factor (SCF; 100 ng/mL). Knock-in PML-RARα (purchased from The Jackson Laboratory) or FLT3ITD/TET2−/− (gift from Francois Mercier, McGill University) was passed in normal C57BL/6J mice. FLT3ITD/TET2−/− BM was harvested and expanded ex vivo in X-VIVO media (Lonza) supplemented with 5% FBS, 1% P/S, recombinant IL-3 (10 ng/mL), IL-6 (10 ng/mL), and SCF (100 ng/mL). A retroviral transduction model of MLL-AF9 or KRASG12D AML was generated by infecting normal CB CD34+ by murine stem cell virus constructs. Infected cells were cultured ex vivo in StemSpan SFEM II (STEMCELL Technologies) with 1% P/S, recombinant IL-3 (20 ng/mL), IL-6 (20 ng/mL), SCF (100 ng/mL), FLT3-L (100 ng/mL), and granulocyte colony-stimulating factor (20 ng/mL).
Normal LKS/Lin− BM cells were cultured in StemSpan SFEM II with 1% P/S, recombinant murine FLT3-L (10 ng/mL), SCF (100 ng/mL), and thrombopoietin (10 ng/mL). As for primary human AML samples from patients and normal human CB CD34+ cells, they were cultured in StemSpanTM SFEM II with 1% P/S, recombinant IL-3 (20 ng/mL), IL-6 (20 ng/mL), SCF (100 ng/mL), FLT3-L (100 ng/mL) and granulocyte colony-stimulating factor (20 ng/mL).
Drug treatment
A number of chemical agents were used in our studies: NHE1 inhibitor (5-[N,N-hexamethylene]amiloride; Cayman Chemical), pan-MCT inhibitor (α-cyano-4-hydroxycinnamic acid; Selleckchem), MCT1 inhibitor (AZD3965; MedChemExpress), MCT1/2 inhibitor (AR-C155858; MedChemExpress), MCT1/4 inhibitor (syrosingopine; MedChemExpress), BRD4 inhibitor (JQ-1; MedChemExpress), DOT1L inhibitor (EPZ5676; Cayman Chemical), menin inhibitor (MI-2-2; Millipore), NF-κB inhibitor (SC75741 and BMS 345541; Selleckchem), and HAT inhibitor (C646 and A-485; MedChemExpress). Also, syrosingopine (7.5 mg/kg; intraperitoneal injection once every 2 days for 2 weeks) and JQ-1 (30 mg/kg; intraperitoneal injection 5 times per week for 2 weeks) treatments were administered to mice in vivo.
Mouse housing
All mice were purchased from The Jackson Laboratory. Mice were maintained in pathogen-free conditions. Experiments involving mice were approved by the Massachusetts General Hospital Institutional Animal Care and Use Committee.
Inducible MCT4 knockdown/knockout systems
An inducible CRISPR-Cas9 system under CreERT2 regulation in MLL-AF9 mouse AML was generated by crossing B6J.129(B6N)-Gt(ROSA)26Sortm1(CAG-cas9*,-EGFP)Fezh/J (#026175; The Jackson Laboratory) with B6.Cg-Ndor1Tg(UBC-cre/ERT2)1Ejb/1J (#007001; The Jackson Laboratory). The GMP from the offspring was infected with MLL-AF9 retrovirus. Established AML cell lines were then infected with guide RNA (gRNA) virus using lentiGuide-Puro plasmid (#52963; Addgene) upon selection with 10 μg/mL of puromycin. Cre expression was induced by 4-hydroxytamoxifen (1 μg/mL) in vitro or tamoxifen (10 mg/kg per day for 4 days) in vivo, confirmed by the presence of GFP+ cells.
An inducible short hairpin RNA (shRNA) system activated by tetracycline/doxycycline was generated. Scrambled or MCT4-targeting shRNAs were cloned into Tet-pLKO-puro plasmid (#21915; Addgene). MLL-AF9 AML cells were infected and selected, and shRNA was induced by doxycycline (2 μg/mL) in vitro or 625 mg of doxycycline hyclate per kilogram diet (Envigo) was fed to AML-engrafted mice at week 3 posttransplantation for 12 days.
An inducible CRISPR-Cas9-GFP system was established in human AML cell lines using TLCV2 (#87360; Addgene). gRNA was cloned into pLKO5.sgRNA.EFS.tRFP657 (#57824; Addgene). The infected cells underwent FACS by tRFP657. Cas9-2A-eGFP was induced by 2 μg/mL of doxycycline. The sequences of shRNA and gRNA are summarized in supplemental Table 6.
Xenotransplantation
Normal mouse hematopoietic stem and progenitor cells (HSPCs) were transplanted into mice for in vivo competitive assays. For mouse cell transplantation, either C57BL/6J or B6.SJL (#000664 or #002014; The Jackson Laboratory) mice as the hosts were lethally irradiated (2× 6 Gy) before IV transplantation. Competitive carrier cells of whole BM (WBM; 200 000) were included according to specific experimental designs. Peripheral blood was drawn retroorbitally every 4 weeks until 16 weeks posttransplantation. After 16 weeks, the mouse BM was harvested. Different HSPC subpopulations were examined by FACS. For the secondary transplantation experiment, 1 million WBM cells from the primary recipients were injected IV into irradiated mice. Peripheral blood was drawn every 4 weeks; the secondary recipients underwent harvesting at 16 weeks posttransplantation, and different HSPC subpopulations were analyzed by FACS.
For AML transplantation experiments, 100 000 to 2 million human AML or 500 000 to 2 million mouse AML cells were injected IV into sublethally irradiated NSG (2 Gy) and B6.SJL (4.5 Gy) mice, respectively. BM aspiration of the femur was performed at various time points according to different experimental designs. The BM-aspirated cells were assayed by FACS, and the level of leukemic engraftment was determined.
Measurement of pHi
pHi was measured by either SNARF-1 (Thermo Fisher Scientific) or pHrodo Red AM pHi indicator (Thermo Fisher Scientific). Hanks balanced salt solution–washed cells were incubated with 2.5 μM SNARF-1 or pHrodo Red AM pHi indicator at 37°C for 20 minutes and then washed with Hanks balanced salt solution. Stained cells were then resuspended in complete culture media for 30 minutes before FACS analysis. A pH reporter, mCherry-SEpHluorin (#32001; Addgene), was also overexpressed in cells of interest for the determination of pHi. Calibration of pHi was achieved by the ionophore nigericin (10 μM) in 100 mM of K+ buffer, with different standard pHs examined either by FACS or in vivo multiphoton fluorescence imaging. Fluorescence intensities from in vivo multiphoton fluorescence imaging were analyzed and quantified by ImageJ.
Analysis of intracellular lactate
Intracellular lactate of AML upon MCT4 inhibition was examined by the Lactate Assay Kit (Sigma-Aldrich) according to the manufacturer’s protocol. Absorbance at 570 nm was measured by the Synergy HTX Multi-Mode Reader (BioTek). The lactate concentration was deduced by the lactate standard curve and normalized by the number of cells.
Analysis of intracellular metabolites
Cells were cultured in the presence of either unlabeled or 13C-labeled substrates such as [1,2-13C2]glucose, [U-13C6]glucose (Cambridge Isotope Laboratories), or sodium L-lactate-13C3 (Sigma-Aldrich) depending on the experimental design. After 15 minutes (flux) or 24 hours (steady), cells were harvested into a microcentrifuge tube and short spun at full speed for 10 seconds at 4°C. Supernatant was removed and washed with ice-cold 0.9% NaCl solution; 80% ice-cold methanol with internal standard (gas chromatography–mass spectrometry, norvaline; liquid chromatography–mass spectrometry [LC-MS], 13C-labeled bacterial extract) was added to quench and extract the cell pellet. For in vivo labeling, [U-13C6]glucose (400 mg/kg) or L-lactate-13C3 (25 mg/kg) was intraperitoneally injected into mice. After 30 minutes, mouse BM cells were harvested and resuspended in ice-cold phosphate-buffered saline buffer with 2% dialyzed FBS. Mouse GFP+ AML cells were sorted by FACS, and the samples were kept on ice throughout the whole sorting process. Sorted cells were harvested and extracted as described.
For gas chromatography–mass spectrometry, the protocol was performed as described previously.18 As for LC-MS, the samples were dried under nitrogen and subsequently resuspended in high-performance LC–grade water for LC-MS analysis. LC-MS was run in the Metabolite Profiling Core Facility at the Whitehead Institute. The Dionex UltiMate 3000 UPLC System (Thermo Fisher Scientific) with a ZIC-pHILIC (5-μm polymer particle) 150 × 2.1 mm column (EMD Millipore) coupled to a QExactive orbitrap mass spectrometer (Thermo Fisher Scientific) was used for analysis. The mobile phase was run at a flow rate of 0.150 mL per minute as a linear gradient from 80% B to 20% B between 0 and 20 minutes, a linear gradient from 20% B to 80% B between 20 and 20.5 minutes, and 80% B held from 20.5 to 28 minutes, where solvent A was 20 mM of ammonium carbonate plus 0.1% ammonium hydroxide and solvent B was acetonitrile. Column and autosampler temperatures were held at 25°C and 4°C, respectively. Metabolites were ionized through electrospray ionization in the mass spectrometer, which operated in polarity-switching mode scanning a range of 70 to 1000 m/z. With retention times determined by authenticated standards, resulting mass spectra and chromatograms were identified and processed using MAVEN software.19
High-performance LC
Culture media was collected at different time points, with cells being filtered using 0.22 μm of filter. For quantification of glucose and lactate, 10 μL of the media sample was injected into an Agilent 1200 high-performance LC system. A Bio-Rad HPX-87H column coupled to a G1362 Refractive Index Detector were used, and the mobile phase was 14 mM of sulfuric acid with a flow rate of 0.7 mL per minute. Standard curves were prepared using authenticated glucose and lactate standards purchased from Sigma-Aldrich.
Library preparation, RNA sequencing, and data analysis
Total RNA was extracted and purified using the RNeasy Plus Mini Kit (Qiagen). Quality of RNA was determined using the Agilent RNA 6000 Nano Kit (Agilent), and only RNA with RNA integrity ≥7.0 was used further. Messenger RNA (mRNA) was isolated from 500 ng of total RNA using the NEBNext Poly(A) mRNA Magnetic Isolation Module (New England Biolabs). The DNA library was generated from the isolated mRNA using the NEBNext Ultra II DNA Library Prep Kit for Illumina (New England Biolabs). Adaptor and specific primer sets were added to each DNA sample using the NEBNext Multiplex Oligo for Illumina (index primer sets 1 and 2; New England Biolabs).
Quality of the DNA library was examined (Tapestation 2200 and Kapa quantitative polymerase chain reaction [PCR]) in the Bauer Core Facility at Harvard University. All samples were combined and sequenced by the Bauer Core Facility at Harvard University using the Illumina Nextseq High Yield 1 × 75 bp Kit. A total of 439 293 612 reads passed filtering, and each sample was sequenced at an average depth of 27 455 851. Those reads were mapped to the mouse genome (GRCm38-vM17) by HISAT2.20 Expression of transcripts was quantified by RSEM software.21 All subsequent analyses were performed using R software. DESeq2 was used to process the raw counts of transcripts for normalization and dispersion estimation.22 DESeq2 negative binomial generalized linear model fitting and Wald tests were used to call differentially expressed genes with multiple test corrections (adjusted P values<.05). The R package clusterProfiler was used for Gene Ontology overrepresentation analysis on significantly differentially expressed genes. Gene set enrichment analysis was also conducted using the R package clusterProfiler, with Broad Institute hallmark gene sets from MSigDB.
Immunoprecipitation and in vitro enzymatic assay
Plasmids expressing different metabolic enzymes conjugated to different protein tags (Sino Biological Laboratory). Purified plasmids were transfected and overexpressed in HEK293FT cells. After 48 hours, cells were harvested and lyzed by NP-40 lysis buffer with protease and phosphatase inhibitors. Total protein was incubated with agarose-conjugated anti-FLAG antibody (Thermo Fisher Scientific) at 4°C overnight. The agarose beads were washed twice. Purified agarose-protein conjugate was then subjected to in vitro enzymatic assay as reported (summary of enzymatic reactions is shown in supplemental Table 8).23-29 For each enzyme, the pH of reaction buffers was titrated and ranged from 7.0 to 7.8. To study the effect of pH on enzyme activity, the substrates were present in an excess amount, whereas enzyme concentration was limited, so the reaction was independent of the substrate concentration. The rate of reaction (at the linear phase of signal changing) was determined by the change of NADH/NAD+ or NADPH/NADP+ measured by the absorbance at 340 nm every 15 seconds for 10 minutes by the Synergy HTX Multi-Mode Reader.
ChIP PCR
Chromatin immunoprecipitation (ChIP) assays were performed in hematopoietic cells as previously described.30 In brief, the cell suspension was fixed with 1% formaldehyde for 7 minutes and then neutralized by glycine. The fixed cells were washed with cold phosphate-buffered saline. The cell pellet was then sonicated in sodium dodecyl sulfate ChIP buffer. The supernatant was collected and precleared with Pierce Protein G Agarose (Thermo Fisher Scientific). After preclearing, a ChIP reaction using different antibodies (1:100; summarized in supplemental Table 7) was added to the lysate and incubated at 4°C overnight. Immunoprecipitated complexes were successively washed with buffers and then eluted using sodium dodecyl sulfate elution buffer at 65°C overnight to reverse crosslink protein-DNA complex. The samples were treated with RNase A and proteinase K and then extracted by phenol-chloroform isoamyl alcohol and precipitated. Finally, the pellet was resuspended in 20 μL of TE buffer.
The DNA was then subjected to quantitative PCR analysis using specific primers (supplemental Table 6). Input genomic DNA was used for the reference sample. Mouse or human Gfi1b was included as a negative control.
Glucose uptake assay
For in vitro assay, the Glucose Uptake-Glo Assay (Promega) was used. The experiment was performed according to the manufacturer’s protocol. In brief, cells were incubated with 2-deoxyglucose (2DG). After incubation, cells were lyzed, and a detection reagent measuring 2DG6P was added. The signal was detected by the Synergy HTX Multi-Mode Reader. For in vivo glucose uptake assay, 2-NBDG (2-[N-(7-nitrobenz-2-oxa-1,3-diazol-4-yl)amino]-2-deoxyglucose; Cayman Chemical) was used; 5 mg/kg of 2-NBDG was injected IV. The mouse cells were harvested after 30 minutes. The level of glucose uptake was determined by the fluorescence intensity of 2-NBDG by FACS.
Glycolysis and Mito stress analysis
Glycolysis stress and Mito stress of normal Lin− BM cells and AML were examined using the Seahorse XF Analyzer (Agilent) according to the manufacturer’s protocol. In brief, the suspension cells were seeded onto a Cell-Tak (Corning)–coated Seahorse XF Microplate in Seahorse XF Base Medium with appropriate supplement (glycolysis stress test, 1 mM of glutamine; Mito stress test, 1 mM of pyruvate, 2 mM of glutamine, and 10 mM of glucose) and centrifuged at 200 × g for 5 minutes. Different compounds were injected for extracellular acidification rate (ECAR) and oxygen consumption rate (OCR) profiling (glycolysis stress test, 10 mM of glucose, 1 μM of oligomycin, and 50 mM of 2DG; Mito stress test, 1 μM of oligomycin, 0.5 μM of FCCP, and 0.5 μM antimycin A). The data were eventually analyzed by Seahorse Wave Desktop 2.6 (Agilent).
In vitro ROS and mitochondrial mass detection
For the investigation of cellular reactive oxygen species (ROS) level, 2 fluorescent dyes were used, CellROX Deep Red Reagent and MitoSOX Red Mitochondrial Superoxide Indicator (Thermo Fisher Scientific). Cells were stained according to the protocol suggested by the manufacturer. The fluorescence signals of CellROX and MitoSOX were excited by 640 and 488 nm and detected by 675 and 575 nm, respectively, using the BD FACSARIA III. For detecting mitochondrial mass, MitoTracker Deep Red FM (Thermo Fisher Scientific) was used. Cells were stained according to the protocol suggested by the manufacturer. The fluorescence signal was excited by 640 nm and detected by 665 nm using the BD FACSARIA III.
In vitro lysosome detection
LysoSensor Yellow/Blue DND-160 (Thermo Fisher Scientific) and LysoTracker Deep Red (Thermo Fisher Scientific) were used to examine the lysosomes in AML. Cells were stained according to the protocol suggested by the manufacturer. LysoSensor and LysoTracker were excited by 405 and 647 nm and detected by 540 and 668 nm, respectively, using Carl Zeiss LSM 880.
In vitro NAD±/NADH detection
The NAD/NADH-Glo Assay (Promega) was used to examine the ratio of NAD+/NADH in AML and CB cells according to the manufacturer’s protocol. Luciferase luminescence was measured by the Synergy HTX Multi-Mode Reader.
Colony forming assay
Clonogenic activity of normal HSPCs and AML cells was evaluated by methylcellulose-based culture (mice, MethoCult M3434; humans, MethoCult H4434; STEMCELL Technologies). A total of 100 to 10 000 cells per mL in triplicate and colonies were examined after 10 days.
In vivo multiphoton fluorescence imaging
The Olympus FVMPE-RS Multiphoton Imaging System was used for intravital imaging of the mice with pH reporter. The detailed protocol of intravital imaging has been described previously.31 In short, the calvarial BM of the mice was accessed optically. Mouse restrainer was used to minimize the motion of the mice during imaging. Two fluorescence detection channels were used to display SEpHluorin (green) and mCherry (red). Second harmonic generation from the collagen fibers in the calvarial bone and 2-photon fluorescence from SEpHluorin were excited by 920-nm femtosecond laser (Mai-Tai HP DS-OL; Spectra Physics), and 1-photon fluorescence from mCherry was excited by 1095-nm femtosecond laser (Insight DS-OL; Spectra Physics). Two lasers were excited to the BM at the same time so that all fluorescences could be acquired simultaneously. For collection of emitted fluorescence, optical band pass filters with the wavelength ranges of 495 to 540 and 575 to 645 nm were used for SEpHluorin and mCherry, respectively. A water immersion objective lens (25×, 1.05 NA, 2-mm walking distance; XLPLN25XWM; Olympus) was used for multiphoton imaging.
Statistical analysis
GraphPad PRISM 7 was used to perform statistical analyses. Paired Student t test was used for analyzing pairwise comparisons of experiments. Kaplan-Meier survival analysis was used for the survival curves analyses. Mann-Whitney U test was used for comparisons of primary AML experiments. Linear regression was used for the correlation between MCT4 expression and histone mark enrichment. P values < .05 were considered statistically significant. At least 3 independent experiments were performed for each analysis. Data are presented as mean ± standard error of the mean (*P < .05, **P < .01, ***P < .001).
Human participants and samples were obtained after patient consent according to IRB-approved protocols at the Queen Mary Hospital, Hong Kong, and Dana-Farber Cancer Institute, Boston, Massachusetts, in accordance with the Declaration of Helsinki.
Results
pHi in hematopoietic cells
The pH indicator SNARF-1 was used to determine the pHi of normal and malignant mouse blood cells (Figure 1A; supplemental Table 1). Normal HSPC pHi was 7.2 to 7.4, while AML was ∼7.6. Among HSPCs, there was considerable variability among cell subsets, with progenitors generally having a higher pHi (Figures 1A). In humans, CB HSPC (supplemental Table 1) pHi was ∼7.2, and in human AML cell lines (Figure 1B), primary human AML, and their CD34+CD38− population (Figure 1C), pHi was ≥7.6 (genetic/clinical information summarized in supplemental Tables 2 and 3). pHi in vivo was evaluated with the fluorescence pH reporter mCherry-SEpHluorin (supplemental Figure 1A),32 transduced into cells before transplantation and evaluated in the BM by calibrated reporter fluorescence (supplemental Figure 1C) using intravital microscopy (Figure 1D-E). The in vivo pHis of normal blood and AML were ∼7.0 and ∼7.5, respectively (Figure 1A). These results confirm a more alkaline pHi in leukemia compared with normal blood cells that is not an artifact of the isolation procedure but is present in vivo where the cells reside.
![Alkaline pHi and MCT4 upregulation is common in AML. (A) Ex vivo pHi of mouse hematopoietic malignancies and normal blood cells examined using SNARF-1 by FACS (n = 3-9). Statistical comparisons between different groups were performed (progenitors/differentiated cells vs long-term hematopoietic stem cells [LT-HSCs]; AML LICs vs LT-HSCs; AML vs LKS). (B) Ex vivo pHi of human AML cell lines and CB CD34+ and normal BM mononuclear cells (BMMCs) examined using SNARF-1 by FACS (n = 3). Statistical comparisons between AML cell lines and CB were performed. (C) Ex vivo pHi of primary human AML (n = 12) and primary AML CD34+CD38− (n = 7) with CB HSC1 (n = 3), CB HSC2 (n = 3), CB (n = 7), and BMMCs (n = 7) examined using SNARF-1 by FACS. (D) In vivo pHi of 100 normal blood cells and 100 MLL-AF9 AML cells (from 3 mice) imaged by multiphoton fluorescence microscope were analyzed by ImageJ. pHi was determined based on the calibrated standard cell (supplemental Figure 1C). (E) Representative images examined by in vivo multiphoton fluorescence microscope showing that mouse MLL-AF9 AML was more greenish in color, whereas normal blood cells were more reddish in mouse calvarial BM cavity. (F) Quantitative PCR (qPCR) analysis of transcriptional expression of MCT4 in mouse LT-HSCs (n = 6), short-term HSCs (ST-HSCs; n = 6), MLL-AF9 AML LICs (n = 3), HoxA9-Meis1 AML LICs (n = 3), and FLT3ITD/TET2−/− AML LICs (n = 4). (G) qPCR analysis of transcriptional expression of MCT4 in human CB HSC1 (n = 3), CB HSC2 (n = 3), CB multipotential progenitors (MPPs; n = 3), CB progenitors (n = 3), primary AML CD34+CD38− (n = 6), and primary bulk AML (n = 6). (H) Western blot of MCT4 protein in primary human AML (n = 16) and CB CD34+ (n = 3). (I) Western blot of MCT4 protein in the subpopulation of different pHi of primary human AML (n = 3; number showed the intensity of MCT4 in pHhigh (H) cells normalized by that in pHlow (L) cells]. *P < .05, **P < .01, ***P < .001. ns, not significant.](https://ash.silverchair-cdn.com/ash/content_public/journal/blood/139/4/10.1182_blood.2021011563/3/m_bloodbld2021011563f1.png?Expires=1768042560&Signature=dYsjOvsJeMSxoC-HM5~sHfWdgg2rcJ4j8XSpM6WmL0WNfvcH3~zNAkYR5uLawaQbrJsAj1mSgfYlSeI6sa5XyAsnov-AlOCoSLgS8HpH2mcoYE-crgTVLehtl5SVuqZddNZRKhHExgN1W9M18bqBUK4~z6695NkN~SN9G6cgMA-~OCIdB7v2vC3QKtZ76dvU8rmv9w2EHoQaJAa7FujDppWvLs~GWhrlP9fuFLIlqqvaEAiMzyeHv6mQQk2aFCSJA-VkHmEGU72A6wfTY05nFSX~HAhZB0Nroi5PmyYE2CxzFqf1oBxdIypz2H-aWnfgwK-OSR0Jhx7p6JcCmIp6AQ__&Key-Pair-Id=APKAIE5G5CRDK6RD3PGA)
Alkaline pHi and MCT4 upregulation is common in AML. (A) Ex vivo pHi of mouse hematopoietic malignancies and normal blood cells examined using SNARF-1 by FACS (n = 3-9). Statistical comparisons between different groups were performed (progenitors/differentiated cells vs long-term hematopoietic stem cells [LT-HSCs]; AML LICs vs LT-HSCs; AML vs LKS). (B) Ex vivo pHi of human AML cell lines and CB CD34+ and normal BM mononuclear cells (BMMCs) examined using SNARF-1 by FACS (n = 3). Statistical comparisons between AML cell lines and CB were performed. (C) Ex vivo pHi of primary human AML (n = 12) and primary AML CD34+CD38− (n = 7) with CB HSC1 (n = 3), CB HSC2 (n = 3), CB (n = 7), and BMMCs (n = 7) examined using SNARF-1 by FACS. (D) In vivo pHi of 100 normal blood cells and 100 MLL-AF9 AML cells (from 3 mice) imaged by multiphoton fluorescence microscope were analyzed by ImageJ. pHi was determined based on the calibrated standard cell (supplemental Figure 1C). (E) Representative images examined by in vivo multiphoton fluorescence microscope showing that mouse MLL-AF9 AML was more greenish in color, whereas normal blood cells were more reddish in mouse calvarial BM cavity. (F) Quantitative PCR (qPCR) analysis of transcriptional expression of MCT4 in mouse LT-HSCs (n = 6), short-term HSCs (ST-HSCs; n = 6), MLL-AF9 AML LICs (n = 3), HoxA9-Meis1 AML LICs (n = 3), and FLT3ITD/TET2−/− AML LICs (n = 4). (G) qPCR analysis of transcriptional expression of MCT4 in human CB HSC1 (n = 3), CB HSC2 (n = 3), CB multipotential progenitors (MPPs; n = 3), CB progenitors (n = 3), primary AML CD34+CD38− (n = 6), and primary bulk AML (n = 6). (H) Western blot of MCT4 protein in primary human AML (n = 16) and CB CD34+ (n = 3). (I) Western blot of MCT4 protein in the subpopulation of different pHi of primary human AML (n = 3; number showed the intensity of MCT4 in pHhigh (H) cells normalized by that in pHlow (L) cells]. *P < .05, **P < .01, ***P < .001. ns, not significant.
Alkaline pHi and MCT4 upregulation is common in AML. (A) Ex vivo pHi of mouse hematopoietic malignancies and normal blood cells examined using SNARF-1 by FACS (n = 3-9). Statistical comparisons between different groups were performed (progenitors/differentiated cells vs long-term hematopoietic stem cells [LT-HSCs]; AML LICs vs LT-HSCs; AML vs LKS). (B) Ex vivo pHi of human AML cell lines and CB CD34+ and normal BM mononuclear cells (BMMCs) examined using SNARF-1 by FACS (n = 3). Statistical comparisons between AML cell lines and CB were performed. (C) Ex vivo pHi of primary human AML (n = 12) and primary AML CD34+CD38− (n = 7) with CB HSC1 (n = 3), CB HSC2 (n = 3), CB (n = 7), and BMMCs (n = 7) examined using SNARF-1 by FACS. (D) In vivo pHi of 100 normal blood cells and 100 MLL-AF9 AML cells (from 3 mice) imaged by multiphoton fluorescence microscope were analyzed by ImageJ. pHi was determined based on the calibrated standard cell (supplemental Figure 1C). (E) Representative images examined by in vivo multiphoton fluorescence microscope showing that mouse MLL-AF9 AML was more greenish in color, whereas normal blood cells were more reddish in mouse calvarial BM cavity. (F) Quantitative PCR (qPCR) analysis of transcriptional expression of MCT4 in mouse LT-HSCs (n = 6), short-term HSCs (ST-HSCs; n = 6), MLL-AF9 AML LICs (n = 3), HoxA9-Meis1 AML LICs (n = 3), and FLT3ITD/TET2−/− AML LICs (n = 4). (G) qPCR analysis of transcriptional expression of MCT4 in human CB HSC1 (n = 3), CB HSC2 (n = 3), CB multipotential progenitors (MPPs; n = 3), CB progenitors (n = 3), primary AML CD34+CD38− (n = 6), and primary bulk AML (n = 6). (H) Western blot of MCT4 protein in primary human AML (n = 16) and CB CD34+ (n = 3). (I) Western blot of MCT4 protein in the subpopulation of different pHi of primary human AML (n = 3; number showed the intensity of MCT4 in pHhigh (H) cells normalized by that in pHlow (L) cells]. *P < .05, **P < .01, ***P < .001. ns, not significant.
Proton transporter regulates pHi
There are several classes of intracellular proton regulators.33 MCT4 was distinctive among them because it was consistently upregulated in both mouse (supplemental Figure 1D-E) and human AML (Figure 1H; supplemental Figure 1F-G), particularly the CD34+CD38- subpopulation, compared with normal hematopoietic stem cells (Figure 1F-G). Basigin is a transmembrane glycoprotein associated with and necessary for MCT434,35 activity. Its mRNA expression was also increased in AML (supplemental Figure 1D). Upregulation of MCT4 was found in AML gene expression databases36,37 and The Cancer Genome Atlas (TCGA)–LAML, but not in multiple myeloma (supplemental Figure 1F), despite an elevated pHi; therefore, elevated pHi in malignancy is not synonymous with MCT4 OE.
Although MCT4 expression did not correlate with pHi in mouse normal hematopoiesis (P = .227) or primary human AML samples (P = .154), the pHhigh subpopulation of primary AML samples examined by the pHrodo Red AM intracellular pH indicator (supplemental Figure 1H) expressed higher levels of MCT4 compared with pHlow cells (Figure 1I), and pHhigh cells proliferated faster (supplemental Figure 1I). Finally, clinical data suggest that MCT4 levels in patient samples may correlate with adverse outcomes (TCGA-LAML, P = .0395); Beat-AML, P = .0740).
MCT4 regulates cell growth
To examine whether modifying MCT4 alters pHi and growth in AML, MCT4 was knocked out in murine MLL-AF9 AML (supplemental Figure 2A). MCT4 knockout (KO) decreased pHi (Figure 2A), increased intracellular lactate (Figure 2B), and reduced extracellular lactate (supplemental Figure 2B). Notably, MCT4 KO did not affect lactate uptake, confirming the lactate export–only function of MCT4 in AML (Figure 2C). The results also suggested a lack of compensation by other transporters. More importantly, MCT4 KO in AML restored the aberrant pHi (∼7.6) to normal HSPC pHi (∼7.2), implying that MCT4 upregulation in AML might be crucial to aberrant alkalization upon transformation from normal hematopoiesis. In consequence, MCT4 KO reduced growth and clonogenicity of MLL-AF9 AML in vitro (Figure 2D; supplemental Figure 2C). Similar in vitro effects of MCT4 inhibition on pHi and growth were also observed in murine FLT3ITD/TET2−/− AML (supplemental Figure 2D-F). The changes in pHi and growth were more significant in low O2 (supplemental Figure 2G-I). MCT4, a downstream target of HIF-1α,38 was induced in 2% O2 (supplemental Figure 2J), accompanied by increased glucose uptake (supplemental Figure 2K-L) and extracellular lactate (supplemental Figure 2B), suggesting that dependency on MCT4 may be pronounced in the low O2 levels we previously reported to be present in BM.39

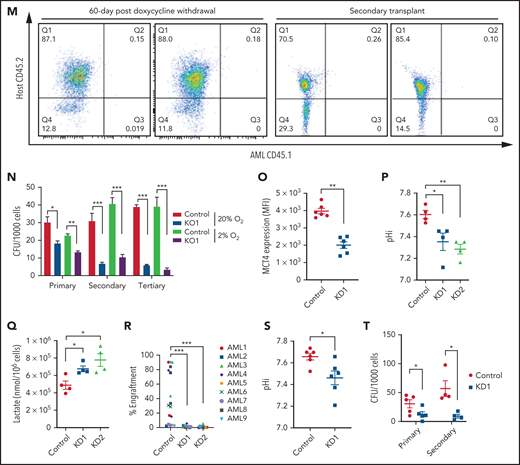
Genetic inhibition of MCT4 reverted aberrant alkaline pHi and suppressed cellular growth in AML. (A-B) pHi (A) and intracellular lactate (B) in mouse MLL-AF9 AML with MCT4 KO in vitro (n = 4). (C) Ten-minute 10-mM 13C lactate flux and analysis of 13C-labeled metabolites in MLL-AF9 AML in vitro with MCT4 KO by gas chromatography–mass spectrometry (GC-MS; n = 4). (D) In vitro growth of MLL-AF9 AML upon MCT4 KO (n = 4). (E) In vitro apoptosis assay of MLL-AF9 AML upon MCT4 KO (n = 4). (F) BrdU incorporation assay in MCT4 KO AML in vitro (n = 4). (G) Distribution of cell populations in G1, S, and G2/M phase in cell cycle upon MCT4 KO in MLL-AF9 AML in vitro (n = 4). (H) Western blot of cell cycle–related proteins in MCT4 KO AML. (I) In vivo pHi of MLL-AF9 AML with scrambled shRNA control (n = 70) and MCT4 knockdown (KD; n = 70; from 3 mice) imaged by multiphoton fluorescence microscope was determined based on the calibrated standard cell (supplemental Figure 1C). (J) Representative images of multiphoton fluorescence microscope showing in vivo pHi from pH reporter expressing AML 2 days after in vivo–induced MCT4 KD by shRNA. (K) Thirty-minute 25-mg/kg 13C lactate flux and analysis of 13C-labeled metabolites in MLL-AF9 AML in vivo with MCT4 KO by GC-MS (n = 4). (L) Kaplan-Meier survival analysis of mice transplanted with MLL-AF9 AML upon in vivo–induced MCT4 (n = 8 of 9) or scrambled shRNA (n = 8). Red area indicates doxycycline induction. (M) Representative FACS plots showing the proportion of host leukocytes (CD45.2) and AML (CD45.1) in recipient BM at 60 days after doxycycline withdrawal and 24 weeks after secondary transplantation. (N) Serial colony-forming assay of mouse cKit+ MLL-AF9 AML with MCT4 KO (n = 3; triplicate wells for each experiment). (O) FACS analysis of MCT4 protein expression in primary human AML samples (n = 6) with MCT4 KD by shRNA and scrambled shRNA control. (P-Q) pHi (P) and intracellular lactate (Q) in primary human AML with MCT4 KD (n = 4) ex vivo. (R) In vivo engraftment of primary human AML with MCT4 KD by shRNA or scrambled shRNA in NSG (9 individual AML patient samples; 1-2 mice per each sample). (S) pHi in human CD34+CD38− primary AML with MCT4 KD (n = 6) ex vivo. (T) Serial colony-forming assay of human CD34+CD38− primary AML with MCT4 KO (5 individual AML patient samples; triplicate wells for each experiment). *P < .05, **P < .01, ***P < .001. CFU, colony-forming unit; MFI, mean fluorescence intensity; ns, not significant.
Genetic inhibition of MCT4 reverted aberrant alkaline pHi and suppressed cellular growth in AML. (A-B) pHi (A) and intracellular lactate (B) in mouse MLL-AF9 AML with MCT4 KO in vitro (n = 4). (C) Ten-minute 10-mM 13C lactate flux and analysis of 13C-labeled metabolites in MLL-AF9 AML in vitro with MCT4 KO by gas chromatography–mass spectrometry (GC-MS; n = 4). (D) In vitro growth of MLL-AF9 AML upon MCT4 KO (n = 4). (E) In vitro apoptosis assay of MLL-AF9 AML upon MCT4 KO (n = 4). (F) BrdU incorporation assay in MCT4 KO AML in vitro (n = 4). (G) Distribution of cell populations in G1, S, and G2/M phase in cell cycle upon MCT4 KO in MLL-AF9 AML in vitro (n = 4). (H) Western blot of cell cycle–related proteins in MCT4 KO AML. (I) In vivo pHi of MLL-AF9 AML with scrambled shRNA control (n = 70) and MCT4 knockdown (KD; n = 70; from 3 mice) imaged by multiphoton fluorescence microscope was determined based on the calibrated standard cell (supplemental Figure 1C). (J) Representative images of multiphoton fluorescence microscope showing in vivo pHi from pH reporter expressing AML 2 days after in vivo–induced MCT4 KD by shRNA. (K) Thirty-minute 25-mg/kg 13C lactate flux and analysis of 13C-labeled metabolites in MLL-AF9 AML in vivo with MCT4 KO by GC-MS (n = 4). (L) Kaplan-Meier survival analysis of mice transplanted with MLL-AF9 AML upon in vivo–induced MCT4 (n = 8 of 9) or scrambled shRNA (n = 8). Red area indicates doxycycline induction. (M) Representative FACS plots showing the proportion of host leukocytes (CD45.2) and AML (CD45.1) in recipient BM at 60 days after doxycycline withdrawal and 24 weeks after secondary transplantation. (N) Serial colony-forming assay of mouse cKit+ MLL-AF9 AML with MCT4 KO (n = 3; triplicate wells for each experiment). (O) FACS analysis of MCT4 protein expression in primary human AML samples (n = 6) with MCT4 KD by shRNA and scrambled shRNA control. (P-Q) pHi (P) and intracellular lactate (Q) in primary human AML with MCT4 KD (n = 4) ex vivo. (R) In vivo engraftment of primary human AML with MCT4 KD by shRNA or scrambled shRNA in NSG (9 individual AML patient samples; 1-2 mice per each sample). (S) pHi in human CD34+CD38− primary AML with MCT4 KD (n = 6) ex vivo. (T) Serial colony-forming assay of human CD34+CD38− primary AML with MCT4 KO (5 individual AML patient samples; triplicate wells for each experiment). *P < .05, **P < .01, ***P < .001. CFU, colony-forming unit; MFI, mean fluorescence intensity; ns, not significant.
MCT4 KO modestly induced apoptosis (Figure 2E) but significantly reduced proliferation (Figure 2F) with G1/S arrest (Figure 2G-H). Cell-cycle arrest was not accompanied by altered differentiation (supplemental Figure 2M), but RNA sequencing showed decreased proliferation terms (supplemental Tables 4 and 5) in AML.
The in vivo biologic significance of MCT4 suppression was assessed by inducible MCT4 shRNAs in MLL-AF9 AML (supplemental Figure 2N). Growth inhibition by MCT4 KD was completely rescued by MCT4 OE (supplemental Figure 2O), verifying the specificity of MCT4 shRNAs. Upon AML engraftment confirmed by intrafemoral BM aspiration, shRNAs were induced in vivo by 12-day doxycycline. Intracellular acidification was observed at day 6 postinduction (Figure 2I-J). Notably, MCT4 KO did not affect lactate uptake in AML in vivo (Figure 2K), reiterating the H+/lactate export–only function of MCT4 in AML. The median survival of MCT4 KD animals was extended (40-50 days) compared with control (28 days; Figure 2L). Notably, 6 of 17 mice with MCT4 KD survived beyond 90 days posttransplantation, and AML was absent in BM (Figure 2M), whereas all mice with control shRNA died by day 40. Secondary recipients transplanted with WBM from the surviving 4 mice were followed for 24 weeks without any sign of AML, demonstrating a functional loss of LICs upon MCT4 inhibition (Figure 2M). To verify this, MCT4 KD markedly inhibited serial clonal plating capacity of MLL-AF9 LICs (Figure 2N). In vivo MCT4 KO in CRISPR-Cas9 MLL-AF9 AML also decreased AML burden and proliferation (supplemental Figure 2P-Q). Dependency on MCT4 in LICs was common in other AML genotypes, including HoxA9-Meis1, PML-RARα, and FLT3ITD/TET2−/−, in vivo (supplemental Figure 2R). Secondary transplantation of FLT3ITD/TET2−/− was further performed, and a similar growth-inhibitory effect of MCT4 KD was observed (supplemental Figure 2S).
The significance of MCT4 was further examined in human AML. MCT4 KD by shRNA suppressed the growth of human AML cell lines but only mildly affected other hematologic malignancies and normal CB, which minimally expressed MCT4 (supplemental Figure 3A). Some T-cell ALL and multiple myeloma cell lines that expressed high levels of MCT4 were also sensitive to MCT4 KD. Using THP-1 as an exemplar, MCT4 shRNA significantly reduced pHi and increased intracellular lactate (supplemental Figure 3B-D). Growth inhibition by MCT4 KD could be rescued by MCT4 OE (supplemental Figure 3E). Antiproliferative effects from CRISPR-Cas9 MCT4 KO were also observed in human AML cell lines, confirming the specificity of MCT4 inhibition in human AML (supplemental Figure 3F-G). Constitutive MCT4 KD suppressed THP-1 and MOLM-14 engraftment (supplemental Figure 3H) and animal survival (supplemental Figure 3I). However, MCT4 KD did not affect MCT1-dependent K56240,41 growth (supplemental Figure 3A) or survival of mice undergoing transplantation (data not shown). In primary patient AML, MCT4 KD decreased pHi and increased intracellular lactate (Figure 2O-Q). Xenogeneic engraftment of 9 of 9 human AMLs of diverse genotypes (supplemental Table 2) was abrogated by MCT4 shRNA (Figure 2R). Notably, MCT4 inhibition reduced pHi and depleted the serial clonogenic capacity of primary human AML CD34+CD38− (Figure 2S-T). These data confirm that human AMLs are also MCT4 and likely alkaline pHi dependent.
MCT4 KO increased both intracellular H+ and lactate. To define if H+ and/or lactate was responsible for growth inhibition, we modified these parameters in vitro (supplemental Figure 4A-C). Extracellular pH (pHe) of 6.8 resulted in pHi of 7.3, comparable to MCT4 KO in AML, and suppressed AML growth (supplemental Figure 4D-E). The antiproliferative effect of MCT4 KO was diminished in alkaline pHe (supplemental Figure 4F) or overexpressing NHE1, a sodium-hydrogen antiporter not involving lactate (supplemental Figure 4G).11 Both approaches alkalize pHi, which abolishes the intracellular acidification and rescues MCT4 loss (supplemental Figure 4H-I). NHE1-OE also rescued the in vivo growth suppression by MCT4 inhibition in AML (supplemental Figure 4J). However, increased extracellular lactate affected neither AML growth nor pHi (data not shown), despite extracellular lactate inducing a comparable lactate increase to MCT4 KO (supplemental Figure 4K). Of note, MCT4 depletion did not affect mTORC activity or lysosomal pH (supplemental Figure 4L-N). These data indicate that growth inhibition by MCT4 KO is due to pHi reduction rather than lactate accumulation or change in the mTORC1 pathway. More importantly, it highlights the essential role of intracellular alkalization for leukemic growth upon activating proton and lactate extrusion.
The therapeutic efficacy of pharmacologic MCT4 inhibition was examined in AML cell lines. Although a specific and potent MCT4 inhibitor is not available, we used a number of MCT inhibitors with various target specificities to determine if targeting MCT4 could potentially suppress AML growth. Syrosingopine (MCT1 and MCT4 inhibitor), AZD3965 (MCT1), and AR-C155858 (MCT1 and MCT2) share overlapping but distinct target specificities. MOLM-14 and MV4-11, which we demonstrated genetically to have dependencies on MCT4 (supplemental Figure 3A), were sensitive to syrosingopine treatment but not to AZD3965 or AR-C155858. MCT1- dependent K562 was mildly affected by syrosingopine but effectively suppressed by AZD3965 and AR-C155858 (supplemental Figure 4O); U937 was affected by all inhibitors. The therapeutic efficacy of syrosingopine against human AML cell lines was further tested in vivo (supplemental Figure 4P), and syrosingopine treatment prolonged the survival of animals engrafted with MOLM-14 and MV4-11, supporting MCT4 as a potential therapeutic target in AML.
MCT4 alters carbon metabolism by pHi modulation
MCT4 inhibition abrogates the export of the terminal glycolytic metabolite lactate (Figure 3A). We previously showed that the enzyme for lactate generation, LDHA, affects leukemic cell function.5 We anticipated that changes in lactate production (LDHA inhibition) and lactate export (MCT4 inhibition) might have similar metabolic consequences. However, pharmacologically inhibiting LDHA decreased basal ECAR and increased basal OCR (supplemental Figure 5A), whereas MCT4 KO suppressed both ECAR and OCR (Figure 3B-C). Also, LDHA KO in AML enhances mitochondrial respiration and generates more ROS,5 but MCT4 KO unexpectedly reduced ROS (supplemental Figure 5B-C). MCT4 affected glycolysis (ECAR) and mitochondrial respiration (OCR and ROS) differently from LDHA; the MCT4 KO changes in ECAR and OCR more resembled 2DG, a global suppressor of glucose utilization (supplemental Figure 5A). Testing MCT4 alteration of glucose handling, MCT KO reduced glucose uptake in MLL-AF9 (Figure 3D-E; supplemental Figure 5D) and FLT3ITD/TET2−/− AML (supplemental Figure 5E). MCT4 KO more potently depressed growth in 2% O2 (Figure 2D) and in the presence of glycolysis activators (supplemental Figure 5F-G) or deprivation of glutamate (Fig.S5h) and was less antiproliferative in glycolytic defective AML (supplemental Figure 5I). Collectively, we suggest MCT4 is an effective regulator of glucose metabolism in addition to its role in H+/lactate transport.

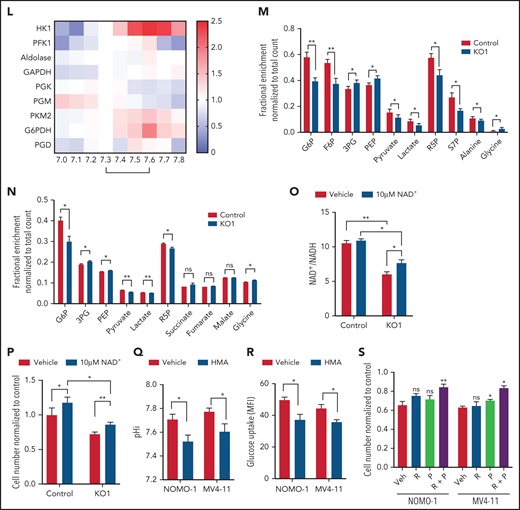
Upregulation of MCT4 is essential in AML-adapted glucose metabolism. (A) An overview of glucose metabolism. (B-C) ECAR (B) and OCR (C) in MLL-AF9 mouse AML upon MCT4 KO in vitro (n = 5). (D-E) In vitro (MCT4 KO by CRISPR-Cas9; n = 3) (D) and in vivo glucose uptake (MCT4 KD by inducible shRNA; n = 6-8) (E) in MLL-AF9 AML. (F) In vitro intracellular metabolite profiling by LC-MS showing the relative levels (normalized to nontargeting gRNA control) of glycolytic and PPP metabolites, ATP/ADP and NADP+/NADPH ratios, and nucleotides in MCT4 KO AML in 20% and 2% O2 (n = 3-5). (G) In vitro cell growth of MCT4 KO AML supplemented with 100 mM of nucleosides (Nu), 10 mM of ribose (R), 2 mM of lactate (L), 0.5 mM of pyruvate (P), or combination of R and P (R+P; n = 3). (H) In vitro glucose uptake of human primary bulk AML blasts and CD34+CD38− with scrambled shRNA (control) or MCT4 KD (6-8 individual AML patient samples). (I) In vitro cell growth of MCT4 KD in primary AML samples supplemented with combination of 10 mM of R and 0.5 mM of P (5 individual AML patient samples). (J) Mitochondrial mass examined by MitoTracker staining in CD34+CD38− upon MCT4 KD (n = 6). (K) Mitochondrial ROS level examined by MitoSOX staining in CD34+CD38− upon MCT4KD (n = 6). (L) In vitro enzymatic activities (normalized to pHi of normal HSPC pH of 7.3) of HK1, PFK1, aldolase, GAPDH, PGK, PGM, PKM2, GAPDH, and PGD at different pHs (n = 3). (M) In vitro 15-minute 13C glucose flux and analysis of 13C-labeled metabolites in glycolytic and PPP metabolites and amino acids (n = 3-4). (N) In vivo 30-minute 13C glucose flux and analysis of 13C-labeled metabolites in glycolysis, PPP, and TCA cycle (n = 4). (O) NAD+/NADH in MLL-AF9 murine AML upon MCT4 KO supplemented with NAD+ (n = 3). (P) In vitro cell growth of MLL-AF9 murine AML upon MCT4 KO supplemented with NAD+ (n = 3). (Q-R) pHi (Q) and glucose uptake (R) of human AML cell lines treated with NHE1 inhibitor (HMA) in vitro (n = 3). (S) In vitro cell growth of AML treated with NHE1 inhibitor (HMA) supplemented with 10 mM of R, 0.5 mM of P, or R+P (n = 3). *P < .05, **P < .01, ***P < .001. AMP, adenosine 5′-monophosphate; MFI, mean fluorescence intensity; ns, not significant; UMP, uridine 5′-monophosphate.
Upregulation of MCT4 is essential in AML-adapted glucose metabolism. (A) An overview of glucose metabolism. (B-C) ECAR (B) and OCR (C) in MLL-AF9 mouse AML upon MCT4 KO in vitro (n = 5). (D-E) In vitro (MCT4 KO by CRISPR-Cas9; n = 3) (D) and in vivo glucose uptake (MCT4 KD by inducible shRNA; n = 6-8) (E) in MLL-AF9 AML. (F) In vitro intracellular metabolite profiling by LC-MS showing the relative levels (normalized to nontargeting gRNA control) of glycolytic and PPP metabolites, ATP/ADP and NADP+/NADPH ratios, and nucleotides in MCT4 KO AML in 20% and 2% O2 (n = 3-5). (G) In vitro cell growth of MCT4 KO AML supplemented with 100 mM of nucleosides (Nu), 10 mM of ribose (R), 2 mM of lactate (L), 0.5 mM of pyruvate (P), or combination of R and P (R+P; n = 3). (H) In vitro glucose uptake of human primary bulk AML blasts and CD34+CD38− with scrambled shRNA (control) or MCT4 KD (6-8 individual AML patient samples). (I) In vitro cell growth of MCT4 KD in primary AML samples supplemented with combination of 10 mM of R and 0.5 mM of P (5 individual AML patient samples). (J) Mitochondrial mass examined by MitoTracker staining in CD34+CD38− upon MCT4 KD (n = 6). (K) Mitochondrial ROS level examined by MitoSOX staining in CD34+CD38− upon MCT4KD (n = 6). (L) In vitro enzymatic activities (normalized to pHi of normal HSPC pH of 7.3) of HK1, PFK1, aldolase, GAPDH, PGK, PGM, PKM2, GAPDH, and PGD at different pHs (n = 3). (M) In vitro 15-minute 13C glucose flux and analysis of 13C-labeled metabolites in glycolytic and PPP metabolites and amino acids (n = 3-4). (N) In vivo 30-minute 13C glucose flux and analysis of 13C-labeled metabolites in glycolysis, PPP, and TCA cycle (n = 4). (O) NAD+/NADH in MLL-AF9 murine AML upon MCT4 KO supplemented with NAD+ (n = 3). (P) In vitro cell growth of MLL-AF9 murine AML upon MCT4 KO supplemented with NAD+ (n = 3). (Q-R) pHi (Q) and glucose uptake (R) of human AML cell lines treated with NHE1 inhibitor (HMA) in vitro (n = 3). (S) In vitro cell growth of AML treated with NHE1 inhibitor (HMA) supplemented with 10 mM of R, 0.5 mM of P, or R+P (n = 3). *P < .05, **P < .01, ***P < .001. AMP, adenosine 5′-monophosphate; MFI, mean fluorescence intensity; ns, not significant; UMP, uridine 5′-monophosphate.
To identify how MCT4 affects glucose metabolism, we quantified glycolytic metabolites and showed that MCT4 KO reduced glucose-6-phosphate (G6P), fructose-6-phosphate (F6P), pyruvate, and ATP/ADP but led to accumulation of phosphoenolpyruvate (PEP) and 3-phosphoglycerate (3PG; Figure 3F) in 20% O2. In 2% O2, fructose 1,6-bisphosphate (FBP), dihydroxyacetone phosphate (DHAP), and 3PG also decreased with MCT4 KO. Additionally, MCT4 KO reduced PPP metabolites, ribose-5-phosphate (R5P), and sedoheptulose-7-phosphate (S7P) and increased NADP+/NADPH (Figure 3F), indicating the inhibition of PPP flux. R5P provides a major substrate for nucleotide biosynthesis, and MCT4 KO markedly reduced adenosine 5′-monophosphate and uridine 5′-monophosphate. These anabolic effects of MCT4 on cell growth were verified when the MCT4 KO growth suppression was rescued by combined ribose and pyruvate (Figure 3G). Similar metabolic effects of MCT4 were observed in human AML cell lines (supplemental Figure 5J-K), primary AML myeloblasts, and CD34+CD38− (Figure 3H); all could be rescued by combined ribose and pyruvate (Figure 3I). Furthermore, MCT4 inhibition reduced mitochondrial mass and mitochondrial ROS in the CD34+CD38− subpopulation of primary human AML (Figure 3J-K). These data demonstrate that MCT4 affects growth by altering carbon handling; it changes not only glycolysis but also the PPP and oxidative phosphorylation (OXPHOS) to affect key anabolic products needed for proliferation.
Testing whether these metabolic effects were pH or lactate driven, cells cultured in acidic pHe (supplemental Figure 5L-M), but not increased lactate (supplemental Figure 5N-O), reproduced the metabolite profile of MCT4 KO. The decrease in glucose uptake upon MCT4 KO was rescued by NHE1-OE (supplemental Figure 5P), further supporting the key role of pHi in remodeling glucose metabolism. We further confirmed the change was not due to altered expression or homopolymer formation of key enzymes (supplemental Figure 5Q-R) by MCT4 inhibition. Therefore, we tested the impact of pH or lactate on purified enzymatic activity. Notably, HK1 (Glu→G6P) and PKM2 (PEP→pyruvate) were more active at pH of 7.6 (AML pHi) compared with pH of 7.3 (normal HSPC pHi; Figure 3L) but unaffected by lactate (supplemental Figure 5S). In contrast, the activity of PFK1 (F6P→FBP), aldolase (FBP→DHAP + G3P), and glyceraldehyde-3-phosphate dehydrogenase (GAPDH; G3P→1,3PG) was stable between pH of 7.3 and 7.6. PGK (1,3PG→3PG) and PGM (3PG→2PG) were less active at pH of 7.6. The PPP rate–determining enzyme G6PDH (G6P→6PGL) was more active at pH of 7.6 (Figure 3L; supplemental Figure 5T), whereas the activity of PGD (6PG→Ru5P) was stable from 7.3 to 7.6. These data indicate that activity of HK1, PKM2, and G6PDH is most responsive to this subtle pHi change. Their activity increased in response to the alkalinizing effect of MCT4 and decreased as MCT4 KO lowered pHi.
The changes in enzymatic activity observed using purified enzymes were tested in intact cells by 13C glucose flux analysis with and without MCT4 KO in vitro (Figure 3M). Acidic pHi upon MCT4 KO with reduced activity of HK1, PKM2, and G6PDH would be expected to decrease the levels of their products while increasing the levels of their substrates. That is indeed what was observed: reduced 13C enrichment in upper (G6P and F6P) and lower glycolytic (pyruvate and lactate) and PPP metabolites (R5P and S7P) with increased 13C enrichment in the intermediate metabolites (3PG and PEP). 13C incorporation into the amino acids derived from glycolytic intermediates (3PG→glycine and pyruvate→alanine) changed accordingly. The changes in 13C glucose labeling were reproduced in vivo (Figure 3N). These data confirm pH-responsive alterations in enzymatic activity in intact cells (supplemental Figure 5U). MCT4-driven proton shifts directly affect carbon metabolism, resulting in altered anabolic products.
Pyruvate reduced to lactate by LDHA is associated with oxidation of NADH to NAD+, which is critical for the activity of GAPDH in glycolysis. Inhibition of MCT4-accumulated lactate might inhibit the activity of LDHA by mass action and therefore limit the recycling of NADH into NAD. Accordingly, we observed a decrease in the ratio of NAD+/NADH upon MCT4 KO. The balance was partially restored by NAD+ supplement (Figure 3O), modestly reverting the growth-inhibitory effect of MCT4 KO (Figure 3P). Therefore, the imbalance of redox as indicated by NAD+/NADH contributes to the growth-inhibitory effect of MCT4 inhibition.
We further tested the impact of pHi by examining pHi regulators with action other than H+/lactate symporter. Pharmacologic suppression of the sodium-hydrogen antiporter NHE1 resulted in intracellular acidification of human AML (Figure 3Q) and decreased glucose uptake in vivo (Figure 3R). The antiproliferative effect of NHE1 inhibition could be rescued by supplementing ribose and pyruvate (Figure 3S). These data indicate that pHi-regulating growth is not MCT4 specific but is a general property accompanying altered proton levels.
Proton export is sufficient to provide growth advantage to normal HSPCs
To test whether the effects of pHi alkalinization were restricted to mutant cancer cells or were a general growth strategy that was exploited by malignancy, we overexpressed MCT4 and NHE1 in normal HSPCs. MCT4 was overexpressed in normal LKS (supplemental Figure 6A), resulting in intracellular alkalization (supplemental Figure 6B) and accompanied by enhanced proliferation in vitro (supplemental Figure 6C-D). Upon competitive transplantation, MCT4 OE increased the chimerism of BM (supplemental Figure 6E). Mature myeloid and T lymphoid cells were also increased in blood, whereas B cells were unaffected (supplemental Figure 6F). Secondary transplantation demonstrated that MCT4 OE increased pHi, chimerism of BM, and proliferation of GMP and CLP (Figure 4A-C). Collectively, MCT4 OE promotes the growth of myeloid and lymphoid progenitors. Notably, MCT4 OE increased glucose uptake of GMP in vivo (Figure 4D). Furthermore, ECAR, OCR (Figure 4E), glycolysis, and the PPP (Figure 4F) were induced upon MCT4 OE. This was apparent in human CB progenitor cells as well, where enhanced growth (Figure 4G; supplemental Figure 6G), intracellular alkalization (Figure 4H), increased BrdU incorporation (Figure 4J), and glucose uptake (supplemental Figure 6H) were observed upon MCT4 OE. The role of MCT4 in redox homeostasis was also demonstrated in normal HSPCs, where MCT4 OE in human CD34+ CB significantly increased the ratio of NAD+/NADH (supplemental Figure 6I). Using a different mechanism of intracellular alkalization, NHE1 OE also increased proliferation associated with increased glucose uptake in normal HSPCs in vivo (Figure 4G-I; supplemental Figure 6J-L). These data indicate a growth-enhancing effect by pH alkalinization that is seen in a number of hematopoietic cell types, particularly progenitor cells. We focused on myeloid cells because of our interest in myeloid malignancies, but similar biology may apply to lymphoid progenitors.
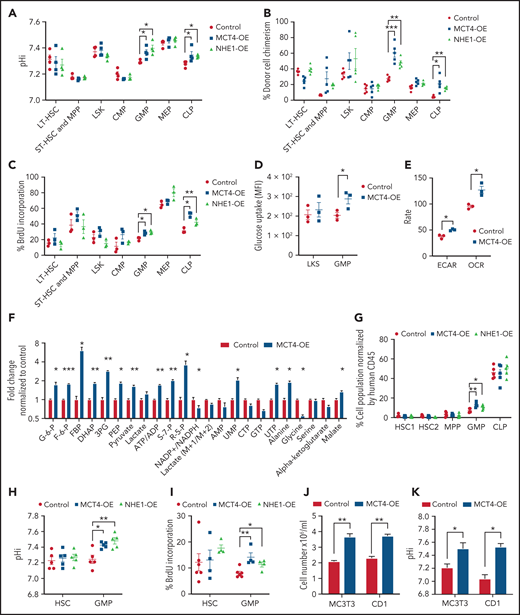
MCT4 upregulation is sufficient to induce normal cell growth. (A-C) Ex vivo pHi analysis by pHrodo Red (A), donor cell chimerism (B), and in vivo BrdU incorporation assay (C) of HSPCs in BM with MCT4 or NHE1 OE at secondary transplantation examined by FACS (n = 3-5). (D) In vivo glucose uptake in mouse HSPCs with MCT4 OE (n = 3). (E) ECAR and OCR of Lin− BM cells with MCT4 OE in vitro (n = 3). (F) In vitro intracellular metabolite profiling by GC/LC-MS showing the relative levels of metabolites in Lin− BM cells with MCT4 OE (n = 3). (G) Percentage of different subpopulations. (H) Ex vivo pHi analysis by pHrodoTM Red and (I) in vivo BrdU incorporation assay of CB HSPC in BM with MCT4- or NHE1-OE (n = 5). (J) In vitro cellular growth of MC3T3 (n = 5) and CD1 (n = 3) upon MCT4-OE. (K) In vitro pHi analysis of MC3T3 (n = 3) and CD1 (n = 3) by SNARF-1 upon MCT4-OE. *P < .05, **P < .01, ***P < .001. AMP, adenosine 5′-monophosphate; HSC, hematopoietic stem cell; UMP, uridine 5′-monophosphate.
MCT4 upregulation is sufficient to induce normal cell growth. (A-C) Ex vivo pHi analysis by pHrodo Red (A), donor cell chimerism (B), and in vivo BrdU incorporation assay (C) of HSPCs in BM with MCT4 or NHE1 OE at secondary transplantation examined by FACS (n = 3-5). (D) In vivo glucose uptake in mouse HSPCs with MCT4 OE (n = 3). (E) ECAR and OCR of Lin− BM cells with MCT4 OE in vitro (n = 3). (F) In vitro intracellular metabolite profiling by GC/LC-MS showing the relative levels of metabolites in Lin− BM cells with MCT4 OE (n = 3). (G) Percentage of different subpopulations. (H) Ex vivo pHi analysis by pHrodoTM Red and (I) in vivo BrdU incorporation assay of CB HSPC in BM with MCT4- or NHE1-OE (n = 5). (J) In vitro cellular growth of MC3T3 (n = 5) and CD1 (n = 3) upon MCT4-OE. (K) In vitro pHi analysis of MC3T3 (n = 3) and CD1 (n = 3) by SNARF-1 upon MCT4-OE. *P < .05, **P < .01, ***P < .001. AMP, adenosine 5′-monophosphate; HSC, hematopoietic stem cell; UMP, uridine 5′-monophosphate.
Notably, the growth induction of MCT4 is not restricted to hematopoietic cells. MCT4 OE in preosteoblasts (MC3T3) and bronchial epithelial cells (CD1) resulted in intracellular alkalization and growth promotion (Figure 4J-K), although this was not seen in mouse embryonic fibroblasts (data not shown). Therefore, the growth-enhancing effect of MCT4 is a more general, although not universal, biologic effect. It is sufficient to enhance cell growth, even in the absence of oncogenic mutations, in association with a stereotypic alteration in carbon metabolism.
Differential dependency of normal and malignant cells on monocarboxylate symporters
Because normal HSPCs express lower levels of MCT4 than AML, we asked whether MCT4 is essential to the function of normal HSPCs. Mouse LKS (CD45.1) cells transduced with MCT4/scrambled shRNA (supplemental Figure 7A) were transplanted in competition with CD45.2 WBM into lethally irradiated recipients. After 16 weeks, MCT4 KD had minimal effects on engraftment and multilineage differentiation of hematopoietic cells (Figure 5A-B), nor did MCT4 KD significantly affect secondary transplantation (Figure 5C-D). MCT4 KD did not affect pH, growth, or proliferation in different immature hematopoietic subpopulations (supplemental Figure 7B-D). Furthermore, in human CB, MCT4 KD did not affect pHi (Figure 5E), growth (Figure 5F), clonogenicity (Figure 5G), or glucose metabolism (Figure 5H-I). Collectively, these data indicate that normal HSPCs are MCT4 independent.
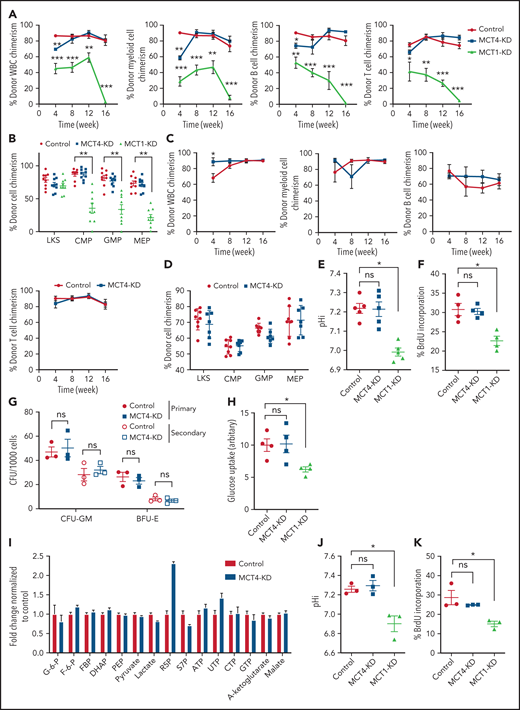

Normal HSPC function is MCT4 independent but MCT1 indispensable. (A) Normal CD45.1 LKS was infected with MCT4/MCT1 shRNA or scrambled shRNA and transplanted into primary recipient mice (n = 8-9) with CD45.2 carrier WBM. Reconstituted CD45.1 and CD45.2 white blood cells (WBCs) and myeloid, B, and Tcells were examined every 4 weeks posttransplantation until week 16, and percentage of CD45.1 chimerism was evaluated (combined data of 2 individual shRNA sequences). (B) At week 16 posttransplantation, mouse BM was harvested. Different HSPCs in BM were examined by FACS. (C) WBM from primary transplantation was injected into secondary recipient mice. WBCs and myeloid, B, and T cells were traced for 16 weeks (n = 7-8). (D) HSPCs in BM were harvested and examined at week 16. (E) pHi analysis in CB CD34+ cells upon MCT1 or MCT4 KD (n = 4). (F) In vitro BrdU incorporation assay in CB CD34+ cells upon MCT1 or MCT4 KD (n = 4). (G) Serial in vitro colony-forming assay of human CB CD34+ cells with MCT4 KD (n = 3; triplicate wells for each experiment). (H) In vitro glucose uptake in CB CD34+ cells with MCT1 or MCT4 KD (n = 4). (I) In vitro intracellular metabolite profiling by LC-MS showing the relative levels of glycolytic, PPP, and TCA metabolites and nucleotides of MCT4 KD CB CD34+ cells in 20% O2 (n = 3). (J-K) In vitro pHi (J) and in vitro BrdU incorporation assay (K) of normal LKS with MCT1 or MCT4 KD (n = 3). (l) In vitro glucose uptake of normal GMP with MCT1 or MCT4 KD (n = 3). (M) Serial in vitro colony-forming assay of human CB CD34+ cells with MCT1 KD (n = 3; triplicate wells for each experiment). (N) Growth of MLL-AF9 AML with KO of different pH regulators in vitro by CRISPR-Cas9 (averaged growth from 3-4 individual gRNA sequences; 4 replicates of experiment). (O) Western blot of MCT1 protein in MLL-AF9 AML with MCT4 KO in vitro. *P < .05, **P < .01, ***P < .001. CFU, colony-forming unit; ns, not significant.
Normal HSPC function is MCT4 independent but MCT1 indispensable. (A) Normal CD45.1 LKS was infected with MCT4/MCT1 shRNA or scrambled shRNA and transplanted into primary recipient mice (n = 8-9) with CD45.2 carrier WBM. Reconstituted CD45.1 and CD45.2 white blood cells (WBCs) and myeloid, B, and Tcells were examined every 4 weeks posttransplantation until week 16, and percentage of CD45.1 chimerism was evaluated (combined data of 2 individual shRNA sequences). (B) At week 16 posttransplantation, mouse BM was harvested. Different HSPCs in BM were examined by FACS. (C) WBM from primary transplantation was injected into secondary recipient mice. WBCs and myeloid, B, and T cells were traced for 16 weeks (n = 7-8). (D) HSPCs in BM were harvested and examined at week 16. (E) pHi analysis in CB CD34+ cells upon MCT1 or MCT4 KD (n = 4). (F) In vitro BrdU incorporation assay in CB CD34+ cells upon MCT1 or MCT4 KD (n = 4). (G) Serial in vitro colony-forming assay of human CB CD34+ cells with MCT4 KD (n = 3; triplicate wells for each experiment). (H) In vitro glucose uptake in CB CD34+ cells with MCT1 or MCT4 KD (n = 4). (I) In vitro intracellular metabolite profiling by LC-MS showing the relative levels of glycolytic, PPP, and TCA metabolites and nucleotides of MCT4 KD CB CD34+ cells in 20% O2 (n = 3). (J-K) In vitro pHi (J) and in vitro BrdU incorporation assay (K) of normal LKS with MCT1 or MCT4 KD (n = 3). (l) In vitro glucose uptake of normal GMP with MCT1 or MCT4 KD (n = 3). (M) Serial in vitro colony-forming assay of human CB CD34+ cells with MCT1 KD (n = 3; triplicate wells for each experiment). (N) Growth of MLL-AF9 AML with KO of different pH regulators in vitro by CRISPR-Cas9 (averaged growth from 3-4 individual gRNA sequences; 4 replicates of experiment). (O) Western blot of MCT1 protein in MLL-AF9 AML with MCT4 KO in vitro. *P < .05, **P < .01, ***P < .001. CFU, colony-forming unit; ns, not significant.
However, normal HSPCs are dependent on glucose/lactate metabolism,5 so we tested whether HSPCs are MCT1 rather than MCT4 dependent. MCT1 KD reduced pHi (Figure 5J), proliferation (Figure 5K), and glucose metabolism (Figure 5L; supplemental Figure 7E) in normal mouse HSPCs in vitro. It also reduced chimerism when the cells were transplanted (Figure 5A-B) compared with scrambled shRNA controls. After 16 weeks, MCT1 KD exhausted HSPCs in BM. MCT1 KD also suppressed pHi (Figure 5E), growth/clonogenicity (Figure 5F,M), and glucose uptake (Figure 5H) of human CB, but only minimally affected AML (Figure 5N). Therefore, proton shifting is universally essential in AML and normal HSPCs; however, they depend on different MCT members, and the extent of MCT activity is different, as indicated by different pHis.41 Distinct MCT use suggests a potential therapeutic opportunity for targeting MCT4 in AML. Notably, MCT4 inhibition did not upregulate MCT1 or other cancer-related pH regulators (Figure 5O; supplemental Figure 7F), indicating that compensation is not likely to offset MCT4 inhibition in AML.
Oncogenic mutations epigenetically upregulate MCT4
Testing whether specific driver leukemic alleles are sufficient to induce MCT4, MLL-AF9, HoxA9-Meis1, and KRASG12D were transduced into normal HSPCs. The leukemic genes upregulated MCT4 and pHi at day 3 postinfection, accompanied by increased growth at day 6 in mouse (Figure 6A-C) and human HSPCs (Figure 6D-F). The biologic changes were abrogated by MCT4 KD, indicating MCT4 upregulation induced by leukemic alleles is important to the transforming phenotypes. Because MCT4 promotor methylation does not correlate with MCT4 expression, and MCT4 copy-number variation is rare in AML (TCGA), we focused on MLL-AF9 and KRASG12D epigenetic alterations.42-45
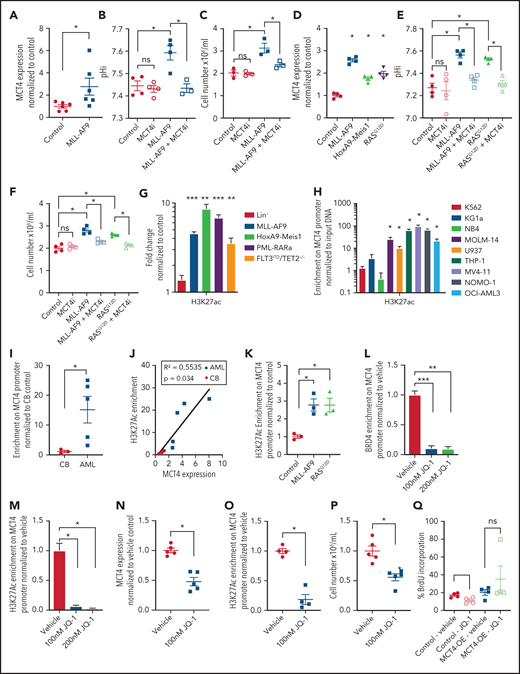

MCT4 expression is induced by AML genes via histone epigenetic modification. (A) Quantitative PCR analysis of MCT4 mRNA expression at day 3 after MLL-AF9 OE in normal LKS in vitro (n = 6). (B) In vitro pHi of normal LKS with MLL-AF9 or MLL-AF9/MCT4 KD at day 3 postinfection (n = 4). (C) In vitro cellular growth of MLL-AF9–induced LKS with scrambled or MCT4 shRNA at day 6 postinfection (n = 3). (D) FACS analysis of MCT4 protein expression in human CB CD34+ cells retrovirally induced with MLL-AF9, HoxA9-Meis1, or KRASG12D (n = 4). (E) In vitro pHi of normal CB transduced with MLL-AF9 or KRASG12D carrying scrambled or MCT4 KD at day 3 postinfection (n = 4). (F) In vitro cellular growth of MLL-AF– or KRASG12D-induced LKS with scrambled/MCT4 shRNA at day 6 postinfection (n = 4). (G) ChIP PCR analysis of enrichment of histone activation mark H3K27ac on MCT4 promoter in mouse AML (MLL-AF9, HoxA9-Meis1, PML-RARα, and FLT3ITD/TET2−/−) and normal Lin− BM cells (n = 3). (H) ChIP PCR analysis of enrichment of H3K27ac on MCT4 promoter in human leukemic cell lines (n = 3). (I) ChIP PCR analysis of enrichment of H3K27ac on MCT4 promoter in primary human AML blasts (n = 5) and CB CD34+ cells (n = 3). (J) Correlation between H3K27ac enrichment on MCT4 promoter with MCT4 expression in primary AML samples (red square; n = 5) and CB CD34+ cells (black dot; n = 3). (K) ChIP PCR analysis of enrichment of H3K27ac on MCT4 promoter in MLL-AF9– or KRASG12D-transformed CB CD34+ cells (n = 3). (L-M) BRD4 (L) and H3K27ac (M) on MCT4 promoter in MLL-AF9 AML upon JQ-1 treatment in vitro (n = 3). (N) JQ-1 treatment on MCT4 expression of primary human AML (5 individual AML patient samples). (O) JQ-1 treatment on enrichment of H3K27ac on MCT4 promoter of primary human AML (4 individual AML patient samples). (P) JQ-1 treatment on growth of primary human AML (5 individual AML patient samples). (Q) In vivo BrdU incorporation assay in THP-1 upon MCT4 OE and JQ-1 treatment (n = 4). (R) Kaplan-Meier survival analysis of mice transplanted with THP-1 upon MCT4 OE and JQ-1 treatment (n = 10). Red area indicates JQ-1 treatment. (S) NF-κB inhibitor treatment on MCT4 expression of AML cell lines and KRASG12D-transformed CB (n = 3). (T) NF-κB inhibitor treatment on H3K27ac enrichment on MCT4 promoter of AML cell lines (n = 3). (U) HAT inhibitor treatment on MCT4 expression of AML cell lines and KRASG12D-transformed CB (n = 3). (V) HAT inhibitor treatment on MCT4 expression of primary human AML (8 individual AML patient samples). *P < .05, **P < .01, ***P < .001. ns, not significant.
MCT4 expression is induced by AML genes via histone epigenetic modification. (A) Quantitative PCR analysis of MCT4 mRNA expression at day 3 after MLL-AF9 OE in normal LKS in vitro (n = 6). (B) In vitro pHi of normal LKS with MLL-AF9 or MLL-AF9/MCT4 KD at day 3 postinfection (n = 4). (C) In vitro cellular growth of MLL-AF9–induced LKS with scrambled or MCT4 shRNA at day 6 postinfection (n = 3). (D) FACS analysis of MCT4 protein expression in human CB CD34+ cells retrovirally induced with MLL-AF9, HoxA9-Meis1, or KRASG12D (n = 4). (E) In vitro pHi of normal CB transduced with MLL-AF9 or KRASG12D carrying scrambled or MCT4 KD at day 3 postinfection (n = 4). (F) In vitro cellular growth of MLL-AF– or KRASG12D-induced LKS with scrambled/MCT4 shRNA at day 6 postinfection (n = 4). (G) ChIP PCR analysis of enrichment of histone activation mark H3K27ac on MCT4 promoter in mouse AML (MLL-AF9, HoxA9-Meis1, PML-RARα, and FLT3ITD/TET2−/−) and normal Lin− BM cells (n = 3). (H) ChIP PCR analysis of enrichment of H3K27ac on MCT4 promoter in human leukemic cell lines (n = 3). (I) ChIP PCR analysis of enrichment of H3K27ac on MCT4 promoter in primary human AML blasts (n = 5) and CB CD34+ cells (n = 3). (J) Correlation between H3K27ac enrichment on MCT4 promoter with MCT4 expression in primary AML samples (red square; n = 5) and CB CD34+ cells (black dot; n = 3). (K) ChIP PCR analysis of enrichment of H3K27ac on MCT4 promoter in MLL-AF9– or KRASG12D-transformed CB CD34+ cells (n = 3). (L-M) BRD4 (L) and H3K27ac (M) on MCT4 promoter in MLL-AF9 AML upon JQ-1 treatment in vitro (n = 3). (N) JQ-1 treatment on MCT4 expression of primary human AML (5 individual AML patient samples). (O) JQ-1 treatment on enrichment of H3K27ac on MCT4 promoter of primary human AML (4 individual AML patient samples). (P) JQ-1 treatment on growth of primary human AML (5 individual AML patient samples). (Q) In vivo BrdU incorporation assay in THP-1 upon MCT4 OE and JQ-1 treatment (n = 4). (R) Kaplan-Meier survival analysis of mice transplanted with THP-1 upon MCT4 OE and JQ-1 treatment (n = 10). Red area indicates JQ-1 treatment. (S) NF-κB inhibitor treatment on MCT4 expression of AML cell lines and KRASG12D-transformed CB (n = 3). (T) NF-κB inhibitor treatment on H3K27ac enrichment on MCT4 promoter of AML cell lines (n = 3). (U) HAT inhibitor treatment on MCT4 expression of AML cell lines and KRASG12D-transformed CB (n = 3). (V) HAT inhibitor treatment on MCT4 expression of primary human AML (8 individual AML patient samples). *P < .05, **P < .01, ***P < .001. ns, not significant.
ChIP PCR revealed that transcriptional activation marks H3K27ac and H3K4me3 were enriched on MCT4 promoter in mouse AML (Figure 6G; supplemental Figure 8A), human AML cell lines (Figure 6H; supplemental Figure 8B), and primary human AML myeloblasts (Figure 6I). These were not observed in normal mouse or human HSPCs. However, only the H3K27ac mark (Figure 6J; supplemental Figure 8C) correlated with MCT4 expression in human AML. Overexpressing MLL-AF9 and KRASG12D in CB enriched the H3K27Ac signature on the MCT4 promoter (Figure 6K), consistent with MCT4 upregulation in transformed CB (Figure 6D).
We further confirmed that MLL-AF9 directly activated MCT4 promoter activity (supplemental Figure 8D). MLL-AF9 epigenetic alterations require chromatin coactivators, such as BRD4 (H3K27Ac reader), DOT1L (H3K79 methyltransferase), and MENIN (H3K4me3 mediator). Pharmacologic BRD4 inhibition in MLL-AF9 reduced MCT4 expression; this was not seen with DOT1L or MENIN inhibitors (supplemental Figure 8E). We performed ChIP PCR and showed that MLL1 and BRD4,46 but not DOT1L or MENIN, overlapped with H3K27ac on the MCT4 promoter in MLL-AF9 AML (supplemental Figure 8F). BRD4 and H3K27ac enrichment were coreduced by pharmacologic BRD4 inhibition (JQ-1) in MLL-AF9– (Figure 6L-M), FLT3ITD/TET2−/−-, and KRASG12D-transformed HSPCs (supplemental Figure 8G-I). JQ-1 also reduced the growth of MLL-AF9 (supplemental Figure 8J). In human AML, JQ-1 suppressed MCT4 expression (Figure 6N; supplemental Figure 8K), H3K27ac marks (Figure 6O), and growth (Figure 6P; supplemental Figure 8L). Furthermore, in vivo efficacy of JQ-1 on MCT4 expression and pHi in human AML were confirmed (supplemental Figure 8M-N). Notably, the in vivo growth-inhibitory effect of JQ-1 could be rescued by MCT4 OE (Figure 6Q-R). The results indicate that BRD4 inhibition can regulate pHi and reduce growth via MCT4 in AML.
NF-κB has been reported to be an essential downstream effector of MLL-AF9 and KRASG12D in AML47,48 and cooperates with BRD4 and p300/CBP for transcriptional activation.49-51 Notably, pharmacologic NF-κB inhibition, SC75741 (impairing DNA binding of p65), and BMS345541 (IKKβ kinase inhibitor) decreased MCT4 expression (Figure 6S) and H3K27ac enrichment (Figure 6T). Pharmacologic inhibition of p300/CBP by C646 and A-485 also reduced MCT4 expression in transformed HSPCs and AML cells (Figure 6U-V). These results indicate that multiple driver leukemic alleles can alter MCT4 expression by modifying histone acetylation.
pHi alkalinization is critical for leukemogenesis
We next tested whether MCT4 upregulation and intracellular alkalization are essential for AML development or only maintenance. Leukemogenesis, including its associated changes in carbon metabolism,5 induced by AML alleles in normal HSPCs was impaired by inhibition of MCT4 (Figure 6A-F; supplemental Figure 9A-B). MCT4/scrambled shRNA LKS transplanted into mice (supplemental Figure 9C) demonstrated a significantly longer latency of preleukemic MLL-AF9 with MCT4 KD (135.5 days) than control (60 days; supplemental Figure 9D). Strikingly, 2 of 6 mice in the MCT4 KD group did not develop leukemia. A similar observation was made in the preleukemic KRASG12D human CB model with MCT4 KD. MCT4 KD significantly abolished the growth-promoting effect of KRASG12D (supplemental Figure 9E-F). These data are consistent with some leukemogenic genotypes depending on MCT4 for leukemic transformation from normal hematopoiesis.
Discussion
In summary, our data support the concept that cellular proton balance (executed by MCT4 or NHE1) directly modifies carbon anabolism to enable a competitive growth advantage (summarized in visual abstract). This is particularly evident in both normal and malignant myeloid cells, but is not restricted to them. Subtle changes (from pH of 7.3 to 7.6) in pHi regulate key steps in carbon metabolism by modifying enzyme activity, including the initiation of glycolysis (HK1), the commitment step of OXPHOS (PKM2), and the rate-determining-step of the PPP (G6PDH). We do not think that the observed pHi change affects general ATP cycling, because significant changes in PGK and PFK1 were not observed. Rather, changes in pHi reprogram key gatekeeper enzymes toward anabolism. We validated that pHi is the driving parameter by demonstrating the metabolic reprogramming by increasing either MCT4 or a distinct proton regulator, NHE1. The latter, Na+/H+ antiporter, also confirms that the effects were not dependent on lactate. However, the reprogramming may be responsive to lactate, because MCT4 symporter activity increases with lactate level.52 We propose a model whereby either glucose abundance and lactate generation in normal cells or mutation-induced MCT4 upregulation in leukemic cells leads to increased lactate export, increased pHi, and a shift to anabolism. The result is essentially the canonic Warburg effect and growth promotion.
In our previous report examining the role of PKM2 and LDHA,5 PKM2 KO and LDHA KO resulted in different metabolic profiles in AML. In PKM2 KO, reexpression of PKM1 might result in a shift of glucose metabolism from aerobic glycolysis to OXPHOS. In LDHA KO, NADH is not effectively recycled to NAD+ in the absence of LDHA; recycling of NADH/NAD+ is only partially maintained by mitochondrial respiration. Therefore, glucose flux was only partially supported, and the upper glycolytic metabolites accumulated, including G6P and F6P. Given that pyruvate could not be converted to lactate, pyruvate fed into the TCA cycle and upregulated OXPHOS resulted. This is very different than MCT4 inhibition, where intracellular acidification inhibited the activity of key glycolytic and PPP enzymes (HK1, PKM2, and G6PDH), causing G6P, F6P, and R5P and carbon flux decrease with no increase in OXPHOS.
Aberrant expression of MCT4 in malignancy may be governed by multiple factors, such as altered DNA methylation seen in renal cell carcinoma.53 However, no correlation of MCT4 expression and DNA methylation or copy-number variation in MCT4 was found in the TCGA-LAML database. Rather, our data indicate that multiple leukemogenic alleles can affect epigenetic regulation of MCT4 either directly, as with MLL-AF9, or indirectly, via the KRASG12D signaling pathway, activating histone acetylation at the MCT4 promoter and eventually inducing MCT4 transcription. The result is a dependency that renders the cells vulnerable to MCT4 inhibition. By reanalyzing previously published ChIP sequencing and RNA sequencing data, H3K27ac activation marks correlating with increased MCT4 expression were also found to be the downstream transcriptional targets of other AML genes, such as ENL, MYB, and CSF3R (GSE80779, GSE94242, and GSE122162).54-56 In addition, ASXL1/2 (GSE84365), DNMT3A (GSE72737), EZH2 (GSE112724), and KRAS (Beat-AML) mutations were also associated with MCT4 upregulation and decreased H3K27me3 repression marks in mouse models.57-60 Moreover, AML with normal karyotype (P < .001), t(11q23)/MLL (P < .001), inv(16) (P < .001), DNMT3A mutation (P = .017), and EZH2 mutation (P < .001) expresses higher levels of MCT4.60 These findings suggest that increased MCT4 expression may be a consequence of multiple leukemogenic mutations. Elevating pHi can shift metabolism to anabolism, providing a basis for the growth advantage seen in epigenetic modifier mutations, where no clear kinase or other driver of proliferation activation is evident. The potential for targeting MCT4 is particularly appealing given the lack of impact on normal HSPC function of MCT4 KD in vivo and the lack of upregulation of compensatory MCT1 when MCT4 was depleted in AML.
Others have noted alkaline pHi in cancer with increased MCT1 in renal cell carcinoma,61 MCT4 in pancreatic cancer,62 and NHE1 in breast cancer.12 A number of cancer-promoting mechanisms have been proposed, including enhanced CDK1 activity63 and destabilized TP53.64 Others have suggested that MCTs permit cells to avoid lactate buildup when increasing glycolysis.35,65 However, rather than MCT4 serving as a compensatory consequence to avoid toxicity, we propose that lactate-driving MCT4 is central to gaining a growth advantage because of the intracellular alkalization that ensues. The result is activated glucose flux generating more lactate, sustaining MCT4 activity, and maintaining alkaline pHi. MCT4 upregulation is a driver of and primary positive selection for the Warburg effect. It shifts glucose flux to give cells an anabolic advantage.
AML LICs have been demonstrated to be dependent on glycolysis,5,66,67 OXPHOS,7,68 and amino acid metabolism.8 These findings are divergent but not mutually exclusive and likely vary depending on the microenvironmental and treatment contexts.8,69-74 Our results indicate that glucose diverts to the PPP and anabolism, perhaps complementing the energy-generating dependence on amino and fatty acids and possibly accounting for prior findings of dependence on glucose flux.66
Although our data focus on the AML-intrinsic changes of MCT4, effects on other cells should be considered. Lactate export affects metabolism in neighboring cells74,75 and alters T/T regulatory/NK cell function, changing immune surveillance.72,73,76 Whether decreased lactate export upon MCT4 suppression disrupts AML-niche lactate shuttling or restores immunologic targeting of AML is unclear. These issues are beyond the focus of this study, but are important in exploring the therapeutic potential of MCT4 inhibition.
In conclusion, proton shifting may be an evolutionarily primitive mechanism by which cells can adjust growth kinetics rapidly and without dependence on complex signaling. As nutrient abundance in the form of glucose increases, the resultant increased lactate enhances symporter activity and proton extrusion. pHi becomes alkaline, directly shifting enzymatic activity to foster anabolism and cell growth. Whether this simple ion-driven process of growth control can be exploited to improve or impair cell growth in therapeutic settings is a topic raised by this study.
Acknowledgments
The authors thank the HSCI/MGH Flow Cytometry Core, CRM Multiphoton Microscopy Core, Bauer Core Facility at Harvard University, and Cell Manipulation Core at Dana-Farber/Harvard Cancer Center for providing cord blood samples and members of the Scadden laboratory, especially Toshihiko Oki, Nick van Gastel, Youmna Kfoury, and Catherine Rhee, who contributed to this work. The authors also thank Caroline Lewis of the Whitehead Institute for help in performing LC-MS metabolite profiling.
D.T.S. received funding from the Gerald and Darlene Jordan Chair in Medicine, the Ludwig Center at Harvard University, and National Institutes of Health grants CA193461 and CA194596 (National Cancer Institute).
Authorship
Contribution: C.H.M. and D.T.S. were responsible for conceptualization of the study; C.H.M., F.E.M., N.L., W.D., Y.J., and D.T.S. were responsible for methodology; C.H.M., N.L., W.D., L.J., and Y.J. performed investigations; G.S., C.P.L., A.Y.H.L., and D.T.S. provided resources; C.H.M., N.L., W.D., and L.J. curated data; C.H.M. and D.T.S. wrote the original draft and reviewed and edited the manuscript; G.S., C.P.L., A.Y.H.L., and D.T.S. acquired funding; and G.S., C.P.L., and D.T.S. supervised the study.
Conflict-of-interest disclosure: D.T.S. is a director and stockholder of Magenta Therapeutics, Agios Pharmaceuticals, Editas Medicine, Clear Creek Bio, and LifeVaultBio; founder and stockholder of Fate Therapeutics; and consultant for FOG Pharma, Inzen, and VCanBio and receives research support from Dianippon Sumitomo Pharma. The remaining authors declare no competing financial interests.
Correspondence: David T. Scadden, Department of Stem Cell and Regenerative Biology, Harvard University, 7 Divinity Avenue, Cambridge, MA 02138; e-mail: david_scadden@harvard.edu.
RNA sequencing data were submitted to the NCBI Gene Expression Omnibus (GEO) GSE124696.
The online version of this article contains a data supplement.
There is a Blood Commentary on this article in this issue.
The publication costs of this article were defrayed in part by page charge payment. Therefore, and solely to indicate this fact, this article is hereby marked “advertisement” in accordance with 18 USC section 1734.

This feature is available to Subscribers Only
Sign In or Create an Account Close Modal