

Key Points
PARP-2 deficiency prevents c-Myc–driven B-cell lymphoma progression, whereas PARP-1 deficiency accelerates lymphomagenesis.
PARP-2 limits replication stress of c-Myc–overexpressing B cells and promotes cell survival, whereas PARP-1 affects regulatory T cells.

Abstract
Dysregulation of the c-Myc oncogene occurs in a wide variety of hematologic malignancies, and its overexpression has been linked with aggressive tumor progression. Here, we show that poly (ADP-ribose) polymerase 1 (PARP-1) and PARP-2 exert opposing influences on progression of c-Myc–driven B-cell lymphoma. PARP-1 and PARP-2 catalyze the synthesis and transfer of ADP-ribose units onto amino acid residues of acceptor proteins in response to DNA strand breaks, playing a central role in the response to DNA damage. Accordingly, PARP inhibitors have emerged as promising new cancer therapeutics. However, the inhibitors currently available for clinical use are not able to discriminate between individual PARP proteins. We found that genetic deletion of PARP-2 prevents c-Myc–driven B-cell lymphoma, whereas PARP-1 deficiency accelerates lymphomagenesis in the Eμ-Myc mouse model of aggressive B-cell lymphoma. Loss of PARP-2 aggravates replication stress in preleukemic Eμ-Myc B cells, resulting in accumulation of DNA damage and concomitant cell death that restricts the c-Myc–driven expansion of B cells, thereby providing protection against B-cell lymphoma. In contrast, PARP-1 deficiency induces a proinflammatory response and an increase in regulatory T cells, likely contributing to immune escape of B-cell lymphoma, resulting in an acceleration of lymphomagenesis. These findings pinpoint specific functions for PARP-1 and PARP-2 in c-Myc–driven lymphomagenesis with antagonistic consequences that may help inform the design of new PARP-centered therapeutic strategies, with selective PARP-2 inhibition potentially representing a new therapeutic approach for the treatment of c-Myc–driven tumors.
Introduction
Poly (ADP-ribose) polymerase 1 (PARP-1) and PARP-2 catalytically cleave β-NAD+ to transfer ADP-ribose moieties onto amino acid residues of proteins, creating long chains of poly (ADP-ribose) (PARylation).1,2 PARP-1, PARP-2, and PARylation play a central role in DNA repair, particularly in single-strand breaks, and mice lacking either enzyme display disturbances in the DNA damage response (DDR).3,4 Considering the critical role of DDR in tumor development and progression, PARP inhibitors have emerged as an important new class of therapeutics in cancer.5,6 However, PARP inhibitors currently in clinical trials or approved for clinical use5 are still unable to discriminate between individual PARP proteins, despite increasing evidence suggesting that PARP-1 and PARP-2 have discrete biologic roles. For instance, PARP-2, but not PARP-1, has been implicated in processes characterized by rapid proliferation, including spermatogenesis,7 T-cell development,8,9 and hematopoiesis.10 Furthermore, PARP-2, but not PARP-1, limits replication stress during erythropoiesis.11 A similar bias toward pathologies associated with tissues exhibiting a high rate of proliferation has also been reported in other mouse models, with a compromised response to replication stress.12
Replication stress, characterized by slowing or stalling of replication fork progression,13 initiates a signaling cascade that protects the arrested replication forks from breakage while simultaneously activating cytostatic or cytotoxic responses, which limit the expansion of the damaged cells.13 Dysregulated expression of oncogenes, such as c-Myc, is a key source of replication stress leading to tumor development.14 c-Myc dysregulation occurs in a wide variety of hematologic malignances, including large B-cell lymphoma, lymphoblastic lymphoma, and multiple myeloma, and its overexpression has been linked to aggressiveness and poor prognosis.15,16 We examined how specific PARP-1 or PARP-2 deficiencies affect c-Myc–driven B-cell lymphoma development. We used the Eμ-Myc mouse model, in which the c-Myc gene driven by the immunoglobulin H enhancer results in tumor development that mimics human Burkitt lymphoma.17 c-Myc overexpression in the Eμ-Myc mouse model results in high proliferation of bone marrow (BM) pre-B cells associated with activation of cell death pathways to control homeostasis.17 However, the appearance of replication stress–associated mutations that block cell death leads to the development of B-cell lymphoma, a process that occurs between 4 to 7 months of age.18,19
In this study, we found that PARP-1 and PARP-2 exert distinct and opposing effects on the development of c-Myc–driven B-cell lymphoma in mice. Loss of PARP-2, but not loss of PARP-1, exacerbates Eμ-Myc–driven replication stress in preleukemic pre-B cells, resulting in the accumulation of DNA damage and concomitant cell death, thereby providing protection against B-cell lymphoma. In contrast, PARP-1 deficiency induces a proinflammatory response and an increase in regulatory T cells (Tregs) that may contribute to an acceleration of tumorigenesis. By elucidating the specific role of PARP-1 and PARP-2 in c-Myc–driven B-cell lymphoma, our results provide crucial information that has implications for the development of PARP inhibition–based therapies, highlighting the need to use selective PARP-2 inhibitors in the treatment of c-Myc–driven tumors.
Methods
Mice
Parp-1−/−, Parp-2−/−, Cd19-creParp-2f/f, and Eμ-Myc transgenic mice have been described elsewhere.20-23 p53−/− mice were from The Jackson Laboratory. B6.SJL-ptprcPep3 mice were from Charles River Laboratories. Mice breeding strategies, genotyping, treatments, and generation of a acute T-cell acute lymphoblastic leukemia (T-ALL) mouse model are detailed in the data supplement. All mice had a C57BL/6J background and were reared under pathogen-free conditions. The Barcelona Biomedical Research Park Institutional Animal Care and Use Committee approved the studies, and all experiments were performed in accordance with relevant guidelines and regulations.
Cell lines and viability assay
Cell lines, selective PARP-2 inhibitor treatment, and viability assay are described in the supplemental Data (available on the Blood Web site).
Whole-blood analysis and histology
Peripheral blood was collected in EDTA and analyzed using a CVM Procell Vet Haematology Blood Analyzer. Histology details are indicated in the data supplement.
Flow cytometry and cell sorting
BM, lymph node, and spleen cell suspensions were washed in phosphate-buffered saline and resuspended in phosphate-buffered saline containing 0.5% bovine serum albumin. Immunostaining, cell acquisition, and analysis details of flow cytometry and cell sorting are available in the data supplement.
Immunofluorescence microscopy and comet assay
Immunofluorescence microscopy and alkaline comet assay on sorted BM pre-B cells was performed as indicated in the data supplement.
BrdU incorporation
Mice received a single intraperitoneal injection of 5-bromo-2′-deoxyuridine (BrdU; BD Biosciences; 1 mg/6 g mouse weight) at 2 hours before euthanasia. Cells were surface stained, fixed, permeabilized, and intracellularly stained using a BrdU Flow Kit (BD Biosciences).
Western blot
Western blot was performed as described in the supplemental Data.
Gene expression
Total RNA isolation, RNA sequencing (RNAseq), and quantitative reverse transcription polymerase chain reaction were performed as indicated in the data supplement. RNAseq data have been deposited into the Gene Expression Omnibus under accession #GSE144050.
Statistical analysis
Data are presented as mean ± standard error of the mean (SEM). The log-rank test was used to determine the significance of animal survival. All other statistical analyses used a Mann-Whitney test. Values of P <.05 were considered significant. Bioinformatic statistical analysis of RNAseq data is indicated in the supplemental Data.
Results
Loss of PARP-2 prevents c-Myc–induced B-cell lymphoma, whereas loss of PARP-1 accelerates tumorigenesis in mice
To evaluate the specific functions of PARP-1 and PARP-2 in c-Myc–driven B-cell lymphoma, we crossed either Parp-2−/− or Parp-1−/− mice with Eμ-Myc transgenic mice and followed spontaneous tumor development for 500 days. Only mice with the c-Myc transgene, inherited paternally, in heterozygous configuration (Eμ-MycT/+) were used in these studies. Comparison of Kaplan-Meier tumor-free survival curves showed that loss of both alleles of Parp-2 in Eμ-Myc mice significantly reduced the incidence of B-cell lymphoma (35% remained lymphoma free vs 6% tumor-free control mice) and enhanced the latency compared with control Eμ-Myc mice (median survival age, 326 vs 127 days; Figure 1A-B). Meanwhile, loss of only 1 allele of Parp-2 did not affect the tumor latency of Eμ-Myc mice (data not shown). PARP-2 deficiency only in B cells23 also delayed lymphoma development in Eμ-Myc mice, suggesting that the lymphoma-promoting role of PARP-2 is due to an intrinsic effect on B cells (supplemental Figure 1). Interestingly, the protection conferred by loss of PARP-2 on Eμ-Myc–driven tumor formation was not observed after deletion of PARP-1. Rather, Eμ-MycT/+Parp-1−/− mice developed terminal lymphoma earlier (median survival age, 90 days) than control Eμ-Myc mice (Figure 1A-B). As expected, we did not detect B-cell lymphoma in either PARP-2– or PARP-1–deficient mice in the absence of c-Myc overexpression (data not shown). Importantly, the absence of either PARP-2 or PARP-1 did not modify the expression of c-Myc in Eμ-Myc BM pre-B cells (Figure 1C).
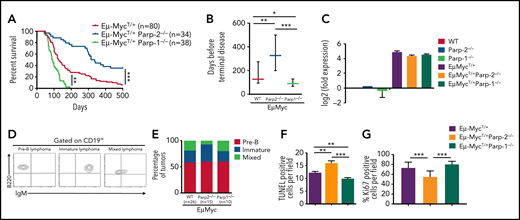
Opposing roles of PARP-1 and PARP-2 in c-Myc–driven B-cell lymphoma. (A) Kaplan-Meier curves comparing B-cell lymphoma–free survival of Eμ-MycT/+, Eμ-MycT/+Parp-1−/−, and Eμ-MycT/+Parp-2−/− mice. Survival was monitored for 500 days. (B) Representation of the median and 25th and 75th percentile survival periods of Eμ-MycT/+, Eμ-MycT/+Parp-1−/−, and Eμ-MycT/+Parp-2−/− mice. (C) Quantitative reverse transcription polymerase chain reaction analysis of c-Myc gene expression in BM pre-B cells. Samples were normalized according to β-actin expression levels. Results are expressed as log2-fold expression compared with levels measured in wild-type (WT) cells. Values represent mean ± SEM obtained from 3 independent experiments. (D) Representative flow cytometric dot plots showing pre-B, immature, and mixed B-cell lymphomas. (E) Bar plot showing the percentage of pre-B, immature, and mixed B-cell lymphoma tumors in each genotype. (F-G) Representation of terminal deoxynucleotidyltransferase-mediated dUTP nick end labeling–positive (TUNEL+) (F) and Ki67+ (G) cells in tumors from the indicated genotypes. Values represent mean ± SEM for 10 randomly selected fields. *P < .05, **P < .01, ***P < .001. Ig, immunoglobulin.
Opposing roles of PARP-1 and PARP-2 in c-Myc–driven B-cell lymphoma. (A) Kaplan-Meier curves comparing B-cell lymphoma–free survival of Eμ-MycT/+, Eμ-MycT/+Parp-1−/−, and Eμ-MycT/+Parp-2−/− mice. Survival was monitored for 500 days. (B) Representation of the median and 25th and 75th percentile survival periods of Eμ-MycT/+, Eμ-MycT/+Parp-1−/−, and Eμ-MycT/+Parp-2−/− mice. (C) Quantitative reverse transcription polymerase chain reaction analysis of c-Myc gene expression in BM pre-B cells. Samples were normalized according to β-actin expression levels. Results are expressed as log2-fold expression compared with levels measured in wild-type (WT) cells. Values represent mean ± SEM obtained from 3 independent experiments. (D) Representative flow cytometric dot plots showing pre-B, immature, and mixed B-cell lymphomas. (E) Bar plot showing the percentage of pre-B, immature, and mixed B-cell lymphoma tumors in each genotype. (F-G) Representation of terminal deoxynucleotidyltransferase-mediated dUTP nick end labeling–positive (TUNEL+) (F) and Ki67+ (G) cells in tumors from the indicated genotypes. Values represent mean ± SEM for 10 randomly selected fields. *P < .05, **P < .01, ***P < .001. Ig, immunoglobulin.
Flow cytometric characterization of PARP-2–deficient tumors revealed that there were no differences in the frequency of pre-B lymphoma or B lymphoma (immature plus mixed) compared with those observed in Eμ-Myc control and Eμ-MycT/+Parp-1−/− mice (Figure 1D-E). Hematoxylin and eosin staining also revealed similar infiltration of malignant B cells in nonlymphoid organs such as liver, lung, and kidney in Eμ-Myc mice in the presence or absence of either PARP-1 or PARP-2 (supplemental Figure 2A). However, B-cell lymphoma in Eμ-MycT/+Parp-2−/− mice showed statistically significant higher levels of cell death, detected by TUNEL assay (Figure 1F; supplemental Figure 2B), and lower proliferation, detected by Ki67 staining, than tumors from Eμ-MycT/+Parp-1−/− and Eμ-Myc control mice (Figure 1G; supplemental Figure 2C).
To determine whether loss of PARP-2 or PARP-1 has an effect on other models of leukemia, we studied their impact on survival in a T-ALL model. Our results indicate that neither PARP-1 deficiency nor PARP-2 deficiency influenced the survival in a mouse model of Notch-1–mediated T-ALL (supplemental Figure 3), suggesting the effect may be specific to c-Myc–driven B-cell lymphoma.
PARP-2 is required for c-Myc–driven expansion of preleukemic pre-B cells
To further determine the mechanisms underlying the protective effect of PARP-2 deficiency on c-Myc–driven lymphomagenesis, we analyzed preleukemic B cells in BM from tumor-free 4-week-old mice. Overall, BM cellularity was not altered in Eμ-Myc mice compared with wild-type mice as previously described.24 However, in Eμ-Myc mice, a significant decrease in total BM cells was observed in the absence of PARP-2, whereas PARP-1 deficiency significantly increased total BM cell number (Figure 2). As expected, at this pretumoral stage, the BM of Eμ-MycT/+ mice displayed a significant expansion of the pre-B cell compartment and a concomitant reduction of immature B cell numbers compared with nontransgenic control mice. Interestingly, PARP-2 deficiency significantly reduced the expansion of the pre-B cell compartment induced by c-Myc overexpression, whereas PARP-1 deficiency increased the expansion of pre-B cells (Figure 2A-B). A slight reduction in pre-B cells was also observed in the spleen of Eμ-MycT/+Parp-2−/− compared with Eμ-MycT/+ control and Eμ-MycT/+Parp-1−/− mice. Neither PARP-1 nor PARP-2 deficiency modified the marginal zone or follicular B-cell population in Eμ-Myc mice (Figure 2C-D).
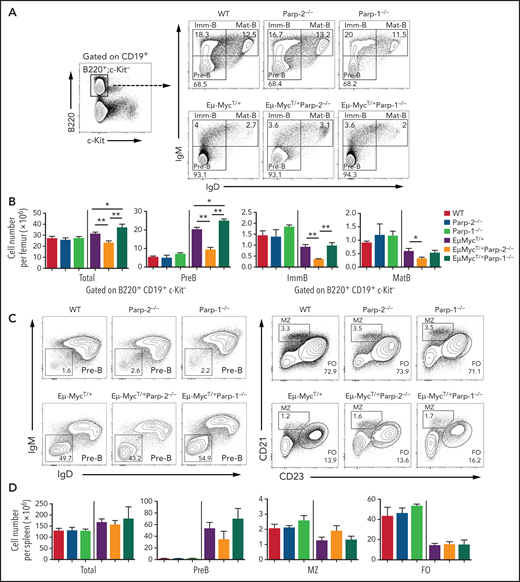
PARP-2 is required for c-Myc–driven expansion of preleukemic pre-B cells. (A) Representative flow cytometric density plots showing pre-B (CD19+B220+c-kit−IgD−IgM−), immature (CD19+B220+c-kit−IgD−IgM+), and mature (CD19+B220+c-kit−IgD+IgM+) BM B cells from mice of the indicated genotypes. Percentage of cells in the individual subpopulations with regard to each gate is indicated in each quadrant. Values represent the mean of ≥ 8 mice of each genotype. (B) Bar plot displaying total number of BM cells and absolute number of pre-B, immature (ImmB), and mature (MatB) BM B cells. The number of cells in each population was calculated by multiplying the percentage of each population by the total number of BM cells. (C) Representative flow cytometric density plots showing pre-B (CD19+B220+c-kit−IgD−IgM−), marginal zone (MZ; CD19+B220+c-kit−CD21highCD23low), and follicular (FO) B cells (CD19+B220+c-kit−CD21lowCD23high) from spleens of mice of the indicated genotypes. Percentage of cells in the individual subpopulations with regard to each gate is indicated in each quadrant. Values represent the mean of ≥ 8 mice of each genotype. (D) Bar plot showing total number of spleen cells and the absolute number of pre-B, MZ, and FO B cells. The number of cells in each population was calculated by multiplying the percentage of each population by the total number of splenocytes. Values represent mean ± SEM of ≥ 8 mice of each genotype. Only P values between groups either containing or not the EμMyc transgene are represented in the graph for clarity. *P < .05, **P < .01. Ig, immunoglobulin; WT, wild type.
PARP-2 is required for c-Myc–driven expansion of preleukemic pre-B cells. (A) Representative flow cytometric density plots showing pre-B (CD19+B220+c-kit−IgD−IgM−), immature (CD19+B220+c-kit−IgD−IgM+), and mature (CD19+B220+c-kit−IgD+IgM+) BM B cells from mice of the indicated genotypes. Percentage of cells in the individual subpopulations with regard to each gate is indicated in each quadrant. Values represent the mean of ≥ 8 mice of each genotype. (B) Bar plot displaying total number of BM cells and absolute number of pre-B, immature (ImmB), and mature (MatB) BM B cells. The number of cells in each population was calculated by multiplying the percentage of each population by the total number of BM cells. (C) Representative flow cytometric density plots showing pre-B (CD19+B220+c-kit−IgD−IgM−), marginal zone (MZ; CD19+B220+c-kit−CD21highCD23low), and follicular (FO) B cells (CD19+B220+c-kit−CD21lowCD23high) from spleens of mice of the indicated genotypes. Percentage of cells in the individual subpopulations with regard to each gate is indicated in each quadrant. Values represent the mean of ≥ 8 mice of each genotype. (D) Bar plot showing total number of spleen cells and the absolute number of pre-B, MZ, and FO B cells. The number of cells in each population was calculated by multiplying the percentage of each population by the total number of splenocytes. Values represent mean ± SEM of ≥ 8 mice of each genotype. Only P values between groups either containing or not the EμMyc transgene are represented in the graph for clarity. *P < .05, **P < .01. Ig, immunoglobulin; WT, wild type.
Peripheral blood analysis also revealed that PARP-2 deficiency, but not loss of PARP-1, mitigated the expansion of the white blood cell compartment in young preleukemic Eμ-Myc mice (supplemental Figure 4A), mainly at the level of preventing the expansion of pre-B cells (supplemental Figure 4B).
Altogether, these results suggest that PARP-2 favors the earliest stages of transformation initiated by c-Myc overexpression in pre-B cells.
Transcriptome analysis of preleukemic Eμ-Myc BM pre-B cells
To gain further insights into the distinct roles of PARP-1 and PARP-2 in the development of Myc-driven B-cell lymphoma, we performed transcriptomic analysis of purified BM pre-B cells from 4-week-old tumor-free Eμ-MycT/+ wild-type, Eμ-MycT/+ Parp-1−/−, and Eμ-MycT/+Parp-2−/− mice. Bioinformatic analyses showed that, with a false discovery rate cutoff of 1%, 53 genes were upregulated and 72 genes were downregulated in Eμ-MycT/+Parp-2−/− compared with Eμ-MycT/+ control pre-B cells. In contrast, as many as 1191 genes were upregulated and 1334 genes were downregulated in Eμ-MycT/+Parp-1−/− compared with Eμ-MycT/+ control pre-B cells (supplemental Tables 1-4).
Gene set enrichment analysis (GSEA) showed that PARP-2 deficiency resulted in an enrichment of pathways involved in the DDR, including DNA replication, ATR pathway, DNA repair, G2/M checkpoints, cell cycle mitotic and intrinsic apoptotic signaling pathways (supplemental Figure 5). In contrast, PARP-1 deficiency led to an enrichment of chemotaxis, inflammatory response, and transforming growth factor β (Tgfb1) receptor binding pathways (supplemental Figures 5 and 6).
PARP-2 mitigates DNA damage accumulation in preleukemic Eμ-Myc BM pre-B cells
The enrichment of pathways involved in the DDR in preleukemic BM pre-B cells observed in Eμ-MycT/+Parp-2−/− mice suggests an accumulation of DNA damage. Accordingly, we monitored the phosphorylation of histone H2AX (γH2AX), a sensitive indicator of DNA injury.25 Preleukemic BM pre-B cells from Eμ-MycT/+Parp-2−/− mice exhibited increased phosphorylation of H2AX compared with control Eμ-Myc and Eμ-MycT/+Parp-1−/− pre-B cells (Figure 3A-B). The increase in γH2AX was mainly localized in S/G2 cells, suggesting replication stress.26,27 These results were confirmed by immunostaining of γH2AX and immunofluorescence microscopy (Figure 3C-D). Notably, pre-B cells from Eμ-MycT/+Parp-2−/− mice displayed a significantly higher percentage of cells with pannuclear γH2AX staining, characteristic of replication stress,28 than control Eμ-Myc and Eμ-MycT/+Parp-1−/− pre-B cells (Figure 3C,E). We next subjected BM pre-B cells to an alkaline comet assay to assess induction and repair of DNA breaks independently of their signaling and processing markers. We observed a significant increase in Eμ-MycT/+Parp-2−/− pre-B cells displaying a comet shape compared with control Eμ-Myc and Eμ-MycT/+Parp-1−/− pre-B cells (Figure 3F-G).
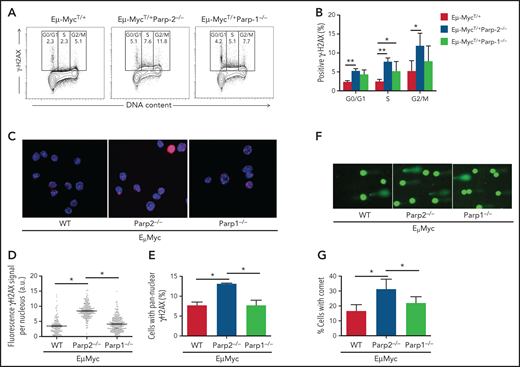
PARP-2 mitigates DNA damage accumulation in preleukemic Eμ-Myc pre-B cells. (A) Representative flow cytometric staining profiles of γH2AX in BM pre-B cells derived from mice of the indicated genotypes. (B) Graph depicting the percentage of positive γH2AX cells. Bars represent mean ± SEM obtained from ≥ 5 mice per genotype. (C) Representative microscopic images depicting immunofluorescence staining of γH2AX in fixed BM pre-B cells. Microscopy was performed by using a Leica TCS SP5 confocal microscope. Red indicates γH2AX; blue indicates DAPI. Original magnification: x63. (D) High-throughput microscopy of γH2AX levels per individual nucleus. At least 2000 nuclei were quantified per condition. Horizontal lines represent median values for each genotype. (E) Graph depicting the percentage of cells showing a pannuclear distribution of γH2AX. (F) Representative images showing DNA damage in BM pre-B cells, visualized by alkaline comet assay, from mice of the indicated genotypes. Original magnification: x10. (G) Graph showing the percentage of pre-B cells with comet. An average of 100 cells was scored for each genotype. Bars represent mean ± SEM obtained from 3 mice per genotype from independent experiments. *P < .05, **P < .01. a.u., arbritary units; WT, wild type.
PARP-2 mitigates DNA damage accumulation in preleukemic Eμ-Myc pre-B cells. (A) Representative flow cytometric staining profiles of γH2AX in BM pre-B cells derived from mice of the indicated genotypes. (B) Graph depicting the percentage of positive γH2AX cells. Bars represent mean ± SEM obtained from ≥ 5 mice per genotype. (C) Representative microscopic images depicting immunofluorescence staining of γH2AX in fixed BM pre-B cells. Microscopy was performed by using a Leica TCS SP5 confocal microscope. Red indicates γH2AX; blue indicates DAPI. Original magnification: x63. (D) High-throughput microscopy of γH2AX levels per individual nucleus. At least 2000 nuclei were quantified per condition. Horizontal lines represent median values for each genotype. (E) Graph depicting the percentage of cells showing a pannuclear distribution of γH2AX. (F) Representative images showing DNA damage in BM pre-B cells, visualized by alkaline comet assay, from mice of the indicated genotypes. Original magnification: x10. (G) Graph showing the percentage of pre-B cells with comet. An average of 100 cells was scored for each genotype. Bars represent mean ± SEM obtained from 3 mice per genotype from independent experiments. *P < .05, **P < .01. a.u., arbritary units; WT, wild type.
The accumulation of DNA damage in PARP-2–deficient Eμ-Myc B cells could stem from impaired DNA strand break repair, increased generation of intrinsic DNA damage, or both. Accordingly, to measure DNA break repair, we monitored the kinetics of H2AX phosphorylation after irradiation (1 Gy) in pre-B cells from preleukemic mice cultured on MS-5 stromal cells in the presence of recombinant interleukin-7. Although both Eμ-MycT/+Parp-2−/− and control Eμ-Myc cells displayed a similar decay of γH2AX signal over time, deficiency of PARP-1 delayed loss of γH2AX (Figure 4A), consistent with ineffective DNA strand break repair in the absence of PARP-1 but not in the absence of PARP-2. Furthermore, we analyzed the total nuclear fluorescence intensity of RAD51 and 53BP1 foci in preleukemic BM pre-B cells as markers of homologous recombination and nonhomologous end joining pathways, respectively. A slight increase in RAD51 staining was observed in Eμ-MycT/+Parp-2−/− with respect to control Eμ-Myc cells, whereas RAD51 staining was decreased in Eμ-MycT/+Parp-1−/− pre-B cells (Figure 4B). We also observed an increase in 53BP1 staining in Eμ-Myc pre-B cells deficient in PARP-2 with respect to control cells and those deficient in PARP-1 (Figure 4C).
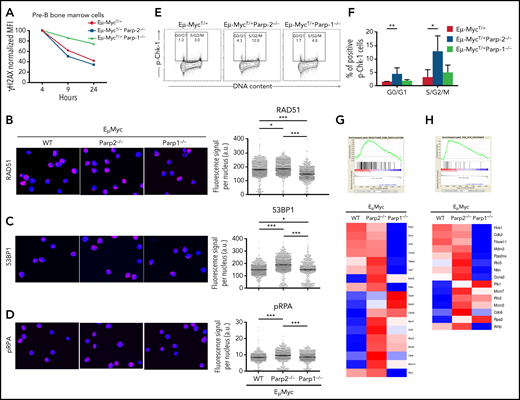
DNA break repair in preleukemic BM pre-B cells. (A) Kinetics of H2AX phosphorylation after irradiation (1 Gy) in BM pre-B cells from preleukemic Eμ-MycT/+, Eμ-MycT/+Parp-1−/−, and Eμ-MycT/+Parp-2−/− mice. (B-D) Representative microscopic images showing immunofluorescence staining of Rad51 (B), 53BP1 (C), and phospho-RPA (pRPA) (D) foci in BM pre-B cells derived from mice of the indicated genotype (left) and high-throughput microscopy of Rad51 (B), 53BP1 (C), and pRPA (D) fluorescence levels per individual nucleus (right). Red indicates Rad51 or 53BP1 or pRPA; blue indicates 4′,6-diamidino-2-phenylindole. At least 2000 nuclei were quantified per condition. Horizontal lines represent median values for each genotype. Original magnification: x63. (E) Representative flow cytometric dot plots of phosphorylated Chk-1 (pChk-1) in BM pre-B cells of each genotype. (F) Graph showing the percentage of pChk-1+ cells in different cell cycle phases. Bars represent mean ± SEM obtained from at least 6 mice per genotype. (G-H) Large-scale gene expression and GSEA showed a significant enrichment for DNA replication (G) and ATR (H) pathways in pre-B cells from Eμ-MycT/+Parp-2−/− mice compared with Eμ-MycT/+ wild-type (WT) control cells. At the top is the GSEA enrichment plot; at the bottom, the normalized gene expression heatmap of genes involved in those pathways. *P < .05, **P < .01, ***P < .001. a.u., arbritary units.
DNA break repair in preleukemic BM pre-B cells. (A) Kinetics of H2AX phosphorylation after irradiation (1 Gy) in BM pre-B cells from preleukemic Eμ-MycT/+, Eμ-MycT/+Parp-1−/−, and Eμ-MycT/+Parp-2−/− mice. (B-D) Representative microscopic images showing immunofluorescence staining of Rad51 (B), 53BP1 (C), and phospho-RPA (pRPA) (D) foci in BM pre-B cells derived from mice of the indicated genotype (left) and high-throughput microscopy of Rad51 (B), 53BP1 (C), and pRPA (D) fluorescence levels per individual nucleus (right). Red indicates Rad51 or 53BP1 or pRPA; blue indicates 4′,6-diamidino-2-phenylindole. At least 2000 nuclei were quantified per condition. Horizontal lines represent median values for each genotype. Original magnification: x63. (E) Representative flow cytometric dot plots of phosphorylated Chk-1 (pChk-1) in BM pre-B cells of each genotype. (F) Graph showing the percentage of pChk-1+ cells in different cell cycle phases. Bars represent mean ± SEM obtained from at least 6 mice per genotype. (G-H) Large-scale gene expression and GSEA showed a significant enrichment for DNA replication (G) and ATR (H) pathways in pre-B cells from Eμ-MycT/+Parp-2−/− mice compared with Eμ-MycT/+ wild-type (WT) control cells. At the top is the GSEA enrichment plot; at the bottom, the normalized gene expression heatmap of genes involved in those pathways. *P < .05, **P < .01, ***P < .001. a.u., arbritary units.
Of note, we also observed an increased level of replication protein A (RPA) phosphorylation on S4/S8 (Figure 4D), triggered by ATM and DNA-PK kinases in response to replication stress,29 in PARP-2–deficient Eμ-Myc pre-B cells compared with the other 2 genotypes. In addition, we monitored the phosphorylation status of Chk1 on S345, a target of ATR, that coordinates the response to replication stress.30 This revealed an increased percentage of pChk1+ pre-B cells, mainly at the S/G2/M phase of the cell cycle, from PARP-2–deficient Eμ-Myc mice compared with Eμ-Myc control and Eμ-MycT/+Parp-1−/− pre-B cells (Figure 4E-F). Accordingly, GSEA showed an enrichment of DNA replication and ATR pathways in the absence of PARP-2 (Figure 4G-H).
Together, our data indicate that DNA strand break repair pathways are not significantly compromised in the absence of PARP-2 in Eμ-Myc pre-B cells. Most likely, the PARP-2 deficiency leads to elevated single-strand breaks, which are rapidly converted to double-strand breaks (DSB) in the S phase instead of a decrease in DSB repair per se.
PARP-2 attenuates the death of preleukemic B cells overexpressing c-Myc
DNA damage activates cytostatic and cytotoxic responses, which limit the expansion of the damaged cells. One or both of these responses may be responsible for the reduced c-Myc–driven expansion of the BM pre-B cell compartment observed in the absence of PARP-2. To evaluate cell proliferation, mice were treated with a single intraperitoneal injection of BrdU for 2 hours. Proliferating BrdU+ pre-B cells from the BM of Eμ-MycT/+Parp-2−/− mice were slightly increased, whereas control Eμ-Myc and Eμ-MycT/+Parp-1−/− mice exhibited comparable frequencies of BrdU+ pre-B cells (Figure 5A-B). We also evaluated the cell cycle status in BM pre-B cells by Ki67 staining to identify cycling cells and 4′,6-diamidino-2-phenylindole to measure the amount of DNA content, which distinguishes G0, G1, S, and G2/M phases of the cell cycle. A significant increase of Eμ-MycT/+Parp-2−/− pre-B cells were found in S phase of the cell cycle as compared with control Eμ-Myc and Eμ-MycT/+ Parp-1−/− pre-B cells (Figure 5C-D). Of note, GSEA on purified Eμ-MycT/+Parp-2−/− BM pre-B cells showed enrichment for G2/M checkpoint pathway compared with Eμ-MycTg/+ control pre-B cells (Figure 5E). Together, these data reveal an S/G2/M arrest in Eμ-MycT/+Parp-2−/− compared with control Eμ-Myc pre-B cells, which may be reminiscent of increased replication stress in the absence of PARP-2.
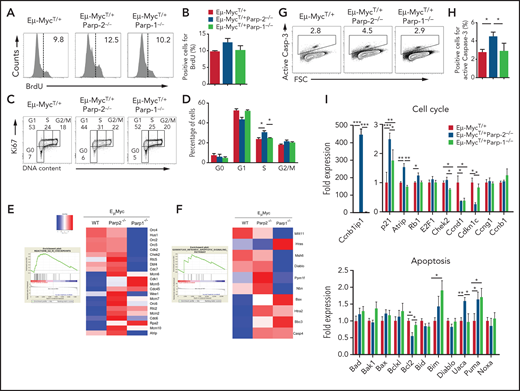
Effect of PARP-2 and PARP-1 deficiency on Eμ-Myc BM pre-B cell proliferation, cell cycle, and apoptosis. (A-B) In vivo BM pre-B cell proliferation was determined by intraperitoneal injection of 5-week-old mice of the indicated genotypes with BrdU (1 mg/6 g mouse weight). BM cells were harvested at 2 hours after the onset of injection, and BrdU incorporation on pre-B cells was analyzed by flow cytometry. Representative histograms (A) from 2 independent experiments including ≥ 2 mice from each genotype are shown. Numbers indicate percentage of proliferating (BrdU+) cells. (B) Bars represent mean ± SEM (SEM) values of the percentage of BrdU+ cells. (C) Representative flow cytometric dot plots showing the cell cycle status of BM pre-B cells in mice from the indicated genotypes. BM pre-B cells were stained with Ki67 to identify cycling cells and 4′,6-diamidino-2-phenylindole to measure DNA content. The percentage of cells in each quadrant represents the mean from ≥ 6 mice in each group. (D) Graph showing the percentage of BM pre-B cells for each genotype that are in G0, G1, S, and G2/M phases of the cell cycle. (E-F) Large-scale gene expression and GSEA showed a significant enrichment for G2/M checkpoint (E) and intrinsic apoptotic signaling (F) pathways in pre-B cells from Eμ-MycT/+Parp-2−/− mice compared with Eμ-MycT/+ wild-type (WT) control cells. At the left is the GSEA enrichment plot; at the right, the normalized gene expression heatmap of genes involved in that pathways. (G) Representative dot plots showing active caspase-3 staining in BM pre-B cells for each genotype. (H) Bars represent the percentage of cells positive for active caspase-3. Values represent mean ± SEM obtained from ≥ 6 mice per genotype. (I) Quantitative reverse transcription polymerase chain reaction analysis in BM pre-B cells of genes involved in cell cycle and apoptosis. Samples were normalized according to β-actin expression levels. Results are expressed as fold expression compared with levels measured in WT cells. Values represent mean ± SEM obtained from 3 independent experiments. *P < .05, **P < .01, ***P < .001.
Effect of PARP-2 and PARP-1 deficiency on Eμ-Myc BM pre-B cell proliferation, cell cycle, and apoptosis. (A-B) In vivo BM pre-B cell proliferation was determined by intraperitoneal injection of 5-week-old mice of the indicated genotypes with BrdU (1 mg/6 g mouse weight). BM cells were harvested at 2 hours after the onset of injection, and BrdU incorporation on pre-B cells was analyzed by flow cytometry. Representative histograms (A) from 2 independent experiments including ≥ 2 mice from each genotype are shown. Numbers indicate percentage of proliferating (BrdU+) cells. (B) Bars represent mean ± SEM (SEM) values of the percentage of BrdU+ cells. (C) Representative flow cytometric dot plots showing the cell cycle status of BM pre-B cells in mice from the indicated genotypes. BM pre-B cells were stained with Ki67 to identify cycling cells and 4′,6-diamidino-2-phenylindole to measure DNA content. The percentage of cells in each quadrant represents the mean from ≥ 6 mice in each group. (D) Graph showing the percentage of BM pre-B cells for each genotype that are in G0, G1, S, and G2/M phases of the cell cycle. (E-F) Large-scale gene expression and GSEA showed a significant enrichment for G2/M checkpoint (E) and intrinsic apoptotic signaling (F) pathways in pre-B cells from Eμ-MycT/+Parp-2−/− mice compared with Eμ-MycT/+ wild-type (WT) control cells. At the left is the GSEA enrichment plot; at the right, the normalized gene expression heatmap of genes involved in that pathways. (G) Representative dot plots showing active caspase-3 staining in BM pre-B cells for each genotype. (H) Bars represent the percentage of cells positive for active caspase-3. Values represent mean ± SEM obtained from ≥ 6 mice per genotype. (I) Quantitative reverse transcription polymerase chain reaction analysis in BM pre-B cells of genes involved in cell cycle and apoptosis. Samples were normalized according to β-actin expression levels. Results are expressed as fold expression compared with levels measured in WT cells. Values represent mean ± SEM obtained from 3 independent experiments. *P < .05, **P < .01, ***P < .001.
In addition, GSEA showed an enrichment of the intrinsic apoptotic signaling pathway in the absence of PARP-2 (Figure 5F). Accordingly, Eμ-MycT/+Parp-2−/− BM pre-B cells exhibited a significantly higher percentage of active caspase-3+ cells than pre-B cells from either Eμ-MycT/+ control or Eμ-MycT/+ Parp-1−/− mice, indicating increased apoptosis (Figure 5G-H). Quantitative reverse transcription polymerase chain reaction showed expression level changes in genes involved in cell cycle and apoptosis, including p53-dependent genes (Ccnb1ip1, p21, Rb1, Bcl2, Puma), on purified Eμ-MycT/+Parp-2−/− preleukemic BM pre-B cells compared with Eμ-MycTg/+ control pre-B cells (Figure 5I).
c-Myc–driven B-cell lymphoma arises once other mutations, often affecting p53, overcome the ability of c-Myc to induce apoptosis. Of note, mutations in Trp53, indicated by high p53 expression, were observed in B-cell lymphoma from Eμ-MycT/+ control and Eμ-MycT/+Parp2−/− mice (supplemental Figure 7).
p53 haploinsufficiency overcomes the delay in c-Myc–driven B-cell lymphoma development caused by loss of PARP-2
The involvement of p53-mediated pathways in c-Myc–driven lymphoma is well established as deficiency of 1 allele of p53 accelerates the development of B-cell lymphoma in the Eμ-MycT/+ model.31 To address whether the delay in c-Myc–driven lymphoma in PARP-2–deficient mice was p53 dependent, we incorporated p53 haploinsufficiency into the crosses to address the epistatic relationship between p53 haploinsufficiency and PARP-2 deficiency. The median survival of 37 days observed in Eμ-MycT/+Parp-2+/+p53+/− mice was similar to the median survival of 39 days found in Eμ-MycT/+Parp-2−/−p53+/− mice (Figure 6A), suggesting that protection against B-cell lymphoma development mediated by PARP-2 deficiency takes place in a p53-dependent manner. Of note, p53 haploinsufficiency in Eμ-MycT/+Parp-2−/− mice restored BM B cell number, avoided S/G2/M arrest, and reduced apoptosis to similar levels found in Eμ-MycT/+Parp-2+/+p53+/− control mice (Figure 6B-D). Similarly, the changes of cell cycle– and apoptosis-related genes observed in pre-B cells from Eμ-MycT/+Parp-2−/− mice relative to Eμ-MycT/+ control mice were no longer observed between pre-B cells from Eμ-MycT/+Parp-2−/−p53+/− mice and Eμ-MycT/+ Parp-2+/+p53+/− mice (supplemental Figure 8).
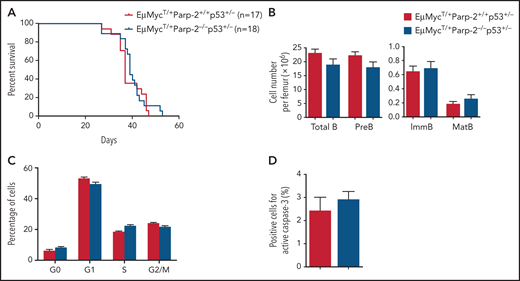
p53 haploinsufficiency abolishes the protective effect of PARP-2 deficiency in the development of B lymphomas in Eμ-MycT/+ mice. (A) Kaplan-Meier curves comparing B-cell lymphoma–free survival of Eμ-MycT/+Parp-2+/+p53+/− and Eμ-MycT/+Parp-2−/−p53+/− mice. (B) Bar graph displaying absolute number of total, pre-B, immature (ImmB), and mature (MatB) BM B cells in Eμ-MycT/+Parp-2+/+p53+/− and Eμ-MycT/+Parp-2−/−p53+/− mice. (C) Graph showing the percentage of BM pre-B cells for each genotype in G0, G1, S, and G2/M phases of the cell cycle. (D) Bar graph showing the percentage of cells positive for active caspase-3 for each genotype. Values represent mean ± SEM obtained from at least 6 mice per genotype.
p53 haploinsufficiency abolishes the protective effect of PARP-2 deficiency in the development of B lymphomas in Eμ-MycT/+ mice. (A) Kaplan-Meier curves comparing B-cell lymphoma–free survival of Eμ-MycT/+Parp-2+/+p53+/− and Eμ-MycT/+Parp-2−/−p53+/− mice. (B) Bar graph displaying absolute number of total, pre-B, immature (ImmB), and mature (MatB) BM B cells in Eμ-MycT/+Parp-2+/+p53+/− and Eμ-MycT/+Parp-2−/−p53+/− mice. (C) Graph showing the percentage of BM pre-B cells for each genotype in G0, G1, S, and G2/M phases of the cell cycle. (D) Bar graph showing the percentage of cells positive for active caspase-3 for each genotype. Values represent mean ± SEM obtained from at least 6 mice per genotype.
Together, our data suggest that PARP-2 deficiency triggers, in response to DNA damage accumulation, a p53-dependent DNA damage response, resulting in cell cycle arrest and impaired survival of c-Myc–overexpressing pre-B cells as the major intrinsic tumor-suppressor mechanism in Eμ-MycT/+Parp-2−/− mice.
PARP-2 inhibition impairs the proliferation of established human B-cell lymphoma cell lines
To determine whether the growth of established c-Myc–driven B-cell lymphoma is dependent on PARP-2 function, we treated a panel of 4 established human B-cell lymphoma cell lines (SU-DHL-10, SU-DHL-5, DoHH-2, and OCI-Ly3) with increasing doses of a selective PARP-2 inhibitor (UPF-1069).32 We found that this compound inhibited the proliferation of the 4 tested cell lines in a dose-dependent manner (supplemental Figure 9A). This indicates that the growth of frank human B-cell lymphoma with rearranged Myc gene is in fact dependent on PARP-2 function, demonstrating the effectiveness of selective PARP-2 inhibitors for therapeutic purposes in c-Myc–driven B-cell lymphoma. In addition, we found that genetic loss of PARP-2, but not PARP-1 (supplemental Figure 9B), led to reduces proliferation of SU-DHL-10 cells (supplemental Figure 9C).
Increased Tregs in lymphoma-infiltrated spleen and lymph node of diseased Eμ-MycT/+Parp-1−/− mice
Previous work has demonstrated that Tregs suppress antitumor response in endogenous B-cell lymphoma.33 Accordingly, we analyzed the frequency of Tregs in preleukemic and tumor-infiltrated spleens and lymph nodes of diseased Eμ-MycT/+, Eμ-MycT/+Parp-2−/−, and Eμ-MycT/+Parp-1−/− mice. In preleukemic spleens, we observed an increased frequency of Tregs in Eμ-MycT/+Parp-1−/− mice compared with Eμ-MycT/+ mice, in agreement with previous results found in Parp-1−/− mice.34,35 Flow cytometric analysis revealed an even greater increase in frequency of Tregs in lymphoma-infiltrated spleens and lymph nodes from Eμ-MycT/+Parp-1−/− mice compared with Eμ-MycT/+ control and Eμ-MycT/+Parp-2−/− mice (Figure 7A-B). These results were confirmed by immunostaining of FoxP3+ and microscopic analysis in tumor-infiltrated lymph nodes of diseased mice (Figure 7C-D). Interestingly, we observed an increased expression of Tgfb1, which has been demonstrated to promote the induction of Tregs,36 in Eμ-MycT/+Parp-1−/− compared with control and Eμ-MycT/+Parp-2−/− B cells (Figure 7E; supplemental Figure 6). Our results suggest that increased levels of Tregs in Eμ-MycT/+Parp-1−/− mice could block the immune response to B-cell lymphoma and thus contribute, at least in part, to the acceleration of tumorigenesis.
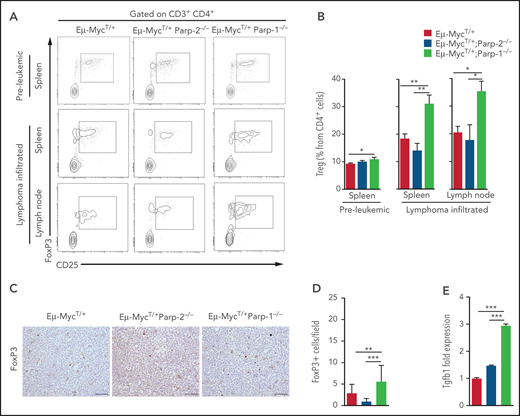
Increased Tregs in preleukemic and tumor-bearing Eμ-MycT/+Parp-1−/− mice. (A) Representative flow cytometric density plots showing Tregs (CD3+CD4+CD25+FoxP3+). (B) Bar plot displaying the frequency of Tregs in preleukemic and lymphoma-infiltrated spleens and lymph nodes of mice of the indicated genotype. Values represent mean ± SEM of at least 6 mice of each genotype. (C) Immunohistochemical staining for FoxP3 of lymphoma-infiltrated lymph nodes of the indicated genotypes. (D) Quantification of FoxP3+ infiltrating cells determined by microscopic analysis. (E) Quantitative reverse transcription polymerase chain reaction analysis of Tgfb1 gene expression in BM pre-B cells. Samples were normalized according to β-actin expression levels. *P < .05, **P < .01, ***P < .001.
Increased Tregs in preleukemic and tumor-bearing Eμ-MycT/+Parp-1−/− mice. (A) Representative flow cytometric density plots showing Tregs (CD3+CD4+CD25+FoxP3+). (B) Bar plot displaying the frequency of Tregs in preleukemic and lymphoma-infiltrated spleens and lymph nodes of mice of the indicated genotype. Values represent mean ± SEM of at least 6 mice of each genotype. (C) Immunohistochemical staining for FoxP3 of lymphoma-infiltrated lymph nodes of the indicated genotypes. (D) Quantification of FoxP3+ infiltrating cells determined by microscopic analysis. (E) Quantitative reverse transcription polymerase chain reaction analysis of Tgfb1 gene expression in BM pre-B cells. Samples were normalized according to β-actin expression levels. *P < .05, **P < .01, ***P < .001.
Discussion
We have shown an opposite role for PARP-1 and PARP-2 in c-Myc–driven B-cell lymphoma, providing the first evidence for a specific role of PARP-2 in supporting c-Myc–driven tumorigenesis. A key finding of our study is that loss of PARP-2 delays tumor onset and prolongs survival in Eμ-Myc transgenic mice, whereas loss of PARP-1 accelerates tumorigenesis. In the Eμ-Myc mouse model, overexpression of c-Myc in the B-cell lineage leads to a rapid expansion of BM pre-B cells associated with additional mutations that prevent cell death, such as inactivation of ARF and p53, leading to tumor development.17-19 Our data indicate that PARP-2 deficiency, but not loss of PARP-1, prevents the expansion of the pre-B cell compartment in Eμ-Myc mice without affecting their proliferation rate. On the contrary, pre-B cells deficient in PARP-2 show increased cell death, which might explain the protection to develop B-cell lymphoma.
Eμ-MycT/+Parp-2−/− mice are more sensitive to alkylating agent treatment than Eμ-MycT/+ control mice (supplemental Figure 10), in agreement with the role of PARP-2 in maintaining genome stability.1,21 Accordingly, we found that PARP-2 limits c-Myc–driven genomic instability.37,38 Of note, PARP-2 deficiency in Myc-overexpressing B cells results in DNA damage accumulation, mainly in replicating cells, as indicated by the accumulation of γH2AX in S phase39-42 and the increased phosphorylation of Chk1, indicative of an active replication stress-driven ATR response.30 This signaling cascade is linked with a transcriptional activation of p53-dependent cytostatic and apoptotic signals to prevent tumourigeneis. Indeed, loss of proapoptotic genes directly (Puma)43 or indirectly (Bim)44 regulated by p53 has been show to increase survival of B cells45,46 and accelerate cMyc-driven lymphomagenesis.47-49 The expression of p53-dependent apoptotic genes was modified in pre-B cells from Eμ-MycT/+ Parp-2−/− mice compared with control cells, with upregulation of proapoptotic genes (Puma and Bim) and downregulation of antiapoptotic genes (Bcl2), tipping the balance toward a proapoptotic state, which may be critical for preventing tumorigenesis. In fact, we found that the prevention of Myc-induced B-cell lymphoma by loss of PARP-2 was dependent on the presence of p53, in agreement with previous data showing a synergistic interaction between PARP-2 and p53 in tumor suppression.9 However, we cannot rule out a direct role of PARP-2 in transcription regulation.50 Indeed, PARP-2, but not PARP-1, has been shown to be a critical component in the androgen receptor transcriptional complex by interacting with FOXA1 favoring prostate cancer development, suggesting that selective inhibition of PARP-2 could be a therapeutic approach to treat prostate cancer.32
Replication stress, a major driver of genomic instability mediated by c-Myc,51 is exacerbated by PARP-2 deficiency, but not by loss of PARP-1. Of note, a critical role of PARP-2, but not PARP-1, in limiting replication stress has previously been noted in another model of high proliferative index as erythropoiesis.11 Stalled replication forks, the major source of genome instability in proliferating cells,52 contain extensive single-strand DNA (ssDNA), which needs to be protected by the binding of RPA.53 Interestingly, it has been reported that ssDNA breaks trigger the recruitment of PARP-2, and its specific activation leads to the subsequent recruitment of RPA.54 Accordingly, PARP-2 deficiency in highly proliferating Eμ-Myc cells might impair RPA-mediated ssDNA protection required for replication fork stabilization.53 Moreover, PARP-2 is also required for stabilizing replication forks through stabilization of RAD51,55 which is required for replication fork reversal to facilitate fork repair.53
Inflammation has been associated with initiation of tumor development, and increased levels of inflammatory mediators have been linked to poor prognosis.56 Remarkably, PARP-1 deficiency accelerates c-Myc–driven tumorigenesis associated with enrichment in inflammatory response pathways, including upregulation of cytokine and chemokine genes. This finding was somewhat unexpected, because previous work has shown that PARP-1 contributes to inflammation mainly through its modulatory function on the proinflammatory transcription factor NF-κB.57 However, PARP-1 does not always correlate with upregulation of NF-κB target genes. Indeed, silencing and enhancing transcription of NF-κB target inflammatory genes by PARP-1 have been previously described,58 suggesting that the effect of PARP-1 on the NF-κB–dependent inflammatory gene expression may be dependent on the tissue and development stage.57 Moreover, a recent report showed that PARP-1 promotes inflammation-driven colorectal tumor progression.59
Additional events associated with the acceleration of tumorigenesis in PARP-1–deficient Eμ-Myc mice could involve immunosuppressive mechanisms, including upregulation of the suppressive cytokine Tgfb160 and increased levels of Tregs. Of note, Tregs impaired immune response to tumors61 and have been demonstrated to play a critical role in suppressing antitumor response in endogenous B-cell lymphoma.33 Altogether, our data suggest that PARP-1 affects cross-talk between the tumor cells and their microenvironment, with the net effect of suppressing tumorigenesis.
Currently, there is great interest in the use of PARP inhibitors for the treatment of different types of cancer, including diffuse large B-cell lymphoma.62 However, none of these inhibitors is specific, and all of them inhibit both PARP-1 and PARP-2. However, our data indicate opposing roles of these 2 proteins in the progression of tumors driven by the c-Myc oncogene, with the inactivation of PARP-2 having a clear protective effect and PARP-1 ablation benefiting tumor progression. Collectively, these findings have potentially significant therapeutic implications, highlighting the importance of developing selective PARP-2 inhibitors to treat c-Myc–driven tumors.
Acknowledgments
The authors thank Raul Gomez-Riera for assistance with microscopic analysis, María Luisa Toribio for providing the HRSIN-ICN1 plasmid, Jessica Gonzalez for technical assistance, and the Flow Cytometry Unit and the Genomics Unit at the Centre for Genomic Regulation for assistance with Aseq at the Barcelona Biomedical Research Park.
The J.Y. laboratory is funded by the Spanish Ministerio de Economía, Industria y Competitividad (grant SAF2017-83565-R), Spanish Ministerio de Ciencia e Innovación (grant PID2020-112526RB-I00), and Fundación Científica de la Asociación Española Contra el Cáncer (grant PROYEI6018YÉLA). Work in the J.E.S. laboratory is supported by a core grant to the Laboratory of Molecular Biology from the Medical Research Council (U105178808). The F.D. laboratory is supported by a Laboratory of Excellence grant (ANR-10-LABX-0034_Medalis) to Strasbourg University, Centre National de la Recherche Scientifique. The P.N. laboratory is supported by grants from the Spanish Ministry of Economy and Competitiveness/Instituto de Salud Carlos III–Fondo Europeo de Desarrollo Regional (FEDER; PI17/00199 and PI20/00625) and the Generalitat de Catalunya (2017-SGR-225). The P.M. laboratory acknowledges support from Centres de Recerca de Catalunya/Generalitat de Catalunya and Fundació Josep Carreras-Obra Social la Caixa for core support, the Spanish Ministry of Economy and Competitiveness (grant SAF-2019-108160-R), the Fundación Uno entre Cienmil, the Obra Social La Caixa (grant LCF/PR/HR19/52160011), and the German Josep Carreras Leukamie Stiftung. Work at the G.R. and P.M. laboratories are cofinanced by the European Regional Development Fund through the Interreg V-A Spain-France-Andorra Program (project PROTEOblood; grant EFA360/19). The O.F.-C. laboratory is funded by grants from the Spanish Ministry of Science, Innovation and Universities (RTI2018-102204-B-I00; cofinanced with European FEDER funds) and the European Research Council (ERC-617840). T.V.-H. was supported by a Marie Sklodowska Curie fellowship (GA792923). The A.B. laboratory is supported by the Spanish Ministry of Economy and Competitiveness (grant PID2019-104695RB-I00).
Authorship
Contribution: M.A.G.-C. and N.L. contributed to generation and characterization of the mouse models and B-cell studies; S.B. carried out bioinformatic analysis; C.M. carried out pathology experiments; J.M.-C. contributed to generation of mouse models; M.M. and O.F.-C. contributed to characterization of mouse models; T.V.-H., V.G.-H., P.M., and A.B. contributed to generation and characterization of an acute T lymphocyte leukemia mouse model; C.A. provided technical assistance; R.G., L.C., G.R., and F.D. provided reagents and biologic resources; G.G. and J.E.S. contributed to planning replication stress studies and editing the manuscript. P.N. designed experiments; J.Y. planned, designed, and performed experiments and wrote the manuscript; and all authors discussed the results and commented on the manuscript.
Conflict-of-interest disclosure: The authors declare no competing financial interests.
Correspondence: José Yélamos, Cancer Research Program, Hospital del Mar Medical Research Institute, Barcelona Biomedical Research Park, C/Dr. Aiguader, 88, 08003-Barcelona, Spain; e-mail: jyelamos@imim.es.
The online version of this article contains a data supplement.
The publication costs of this article were defrayed in part by page charge payment. Therefore, and solely to indicate this fact, this article is hereby marked “advertisement” in accordance with 18 USC section 1734.

This feature is available to Subscribers Only
Sign In or Create an Account Close Modal