

Key Points
A pathology review of 553 lymphoid neoplasm cases among atomic bomb survivors provides WHO classification subtype distribution.
Significant radiation dose response observed for precursor lymphoid neoplasms but not for mature lymphoid neoplasms or HL.

Abstract
Epidemiological data have provided limited and inconsistent evidence on the relationship between radiation exposure and lymphoid neoplasms. We classified 553 lymphoid neoplasm cases diagnosed between 1950 and 1994 in the Life Span Study cohort of atomic bomb survivors into World Health Organization subtypes. Mature B-cell neoplasms represented 58%, mature T-cell and natural killer (NK)-cell neoplasms 20%, precursor cell neoplasms 5%, and Hodgkin lymphoma (HL) 3%, with the remaining 15% classified as non-Hodgkin lymphoid (NHL) neoplasms or lymphoid neoplasms not otherwise specified. We used Poisson regression methods to assess the relationship between radiation exposure and the more common subtypes. As in earlier reports, a significant dose response for NHL neoplasms as a group was seen for males but not females. However, subtype analyses showed that radiation dose was strongly associated with increased precursor cell neoplasms rates, with an estimated excess relative risk per Gy of 16 (95% Confidence interval: 7.0, >533) at age 50. The current data based primarily of tissue-based diagnoses suggest that the association between radiation dose and lymphoid neoplasms as a group is largely driven by the radiation effect on precursor cell neoplasms while presenting no evidence of a radiation dose response for major categories of mature cell neoplasms, either B- or T-/NK-cell, or more specific disease entities (diffuse large B-cell lymphoma, plasma cell myeloma, adult T-cell leukemia/lymphoma) or HL.
Introduction
The relationship between radiation exposure and hematological malignancies is complicated by variations in the carcinogenic potential of radiation exposure across disease categories and uncertainties about classification of certain categories. In contemporary World Health Organization (WHO) classification of tumors of hematopoietic and lymphoid tissues, lymphomas and corresponding lymphoid leukemias are recognized as presenting different phases of cell differentiation (precursor or mature cell neoplasms). Lymphoid neoplasms are also subclassified by lineage (B- or T-/NK-cell neoplasms), with distinct diseases (subtypes) defined by morphological, phenotypic, genotypic, and clinical features.1 Population differences in the subtype incidence patterns suggest variation in etiology and pathogenesis.2,3
Most epidemiological studies of radiation-exposed populations began before the development of the current WHO classification. Consequently, radiation risk estimates have largely been limited to broadly categorized lymphoma types and regarded lymphoid leukemias as distinct from lymphomas. While a strong radiation effect on leukemias other than chronic lymphocytic leukemia is widely accepted, evidence to support radiation effects on non-Hodgkin lymphoma (NHL), Hodgkin lymphoma (HL), or multiple myeloma (MM) is limited and inconsistent.4-7
In the Life Span Study (LSS) of Hiroshima and Nagasaki atomic bomb survivors, a significant radiation dose response relationship has been found for NHL in males but not females, while there have been no indications of a radiation effect for adult T-cell leukemia, MM, or HL.5,6 Here, we examine radiation exposure effects on the rates of lymphoid neoplasm subtypes derived from reclassification of lymphoid neoplasms diagnosed between 1950 and 1994.
Materials and methods
Detailed materials and methods are provided in supplemental Materials.
Life Span Study and follow-up
As described previously,6,7 the LSS cohort includes 120 321 persons consisting of 93 741 atomic bomb survivors of Hiroshima and Nagasaki and 26 580 individuals who were “not in city” at the time of the bombing. In recent LSS studies of hematological malignancies, incident cases were ascertained from both the leukemia and cancer registries, enabling the follow-up from the inception of the LSS cohort in 1950, albeit without detailed subtype-specific analysis of lymphoid neoplasms.5,8
The Leukemia Registry (LR) ascertained incident cases using diagnostic information from clinical and laboratory records and, if possible, blood smears or other biological specimens that were reviewed by LR hematologists to develop a consensus diagnosis.8 In the mid-1980s, LR materials were rereviewed and 60% of the leukemia diagnoses reclassified using the French-American-British system.9,10 The Tumor Registries (TRs) in Hiroshima and Nagasaki, established in 1957 to 1958, actively ascertain cases, abstracting relevant data from medical records at hospitals in the 2 cities and outlying areas.11
Case ascertainment for the present study
We identified lymphoid neoplasm cases for the 1950-1994 period using the LR, TR, and additional sources. Briefly, we searched the Radiation Effects Research Foundation (RERF) databases for the LR, TR, death certificates, and pathology programs. Using source-specific diagnostic classifications, including various versions of the International Classification of Diseases and the ad hoc coding schemes developed for the LR cases, a principal study pathologist (M.F.) classified the potential cases into 3 groups with different likelihoods of being lymphoid neoplasms (supplemental Table 1).
Pathology panel review
For 857 cases (859 lesions including 2 double primary neoplasms) from the above selection process, we obtained copies of hospital medical records, including pathology, hematology, and other clinical laboratory reports including histochemistry results as well as archived tissue specimens, when available. For 575 (67%) of these lesions, tissue samples were available for immunohistochemistry and other tests (see below). These results were examined by the study pathology panel (M.F., Hiroshima Red Cross and Atomic-bomb Survivor Hospital, Koji Nanba, Rokumeiso, Research Institute of Pathology, and Osamu Takahara, Red Cross Nagasaki Atomic Bomb Hospital) to classify cases based on the 2008 WHO classification.12 For the 284 lesions without tissue samples, the panel reviewed medical records and developed consensus diagnoses and subtypes (medical record review). In these reviews, 730 legions were identified as lymphoid neoplasms and 129 were rejected for reasons indicated in supplemental Table 2. The proportions of accepted and histologically-verified cases were similar for the 2 cities and sexes (supplemental Table 3).
Histological verification
Histological diagnosis was primarily based on immunohistochemistry results. We performed immunohistochemistry staining for 436 cases using the antibody markers listed in supplemental Table 4. Elevated soluble IL-2 receptor levels and flow cytometry findings were used for the confirmation. Because few immunostaining assays were available for diagnosis of plasma cell myeloma, we used alternative clinical assays, such as immuno-electrophoresis using immunoglobulin and Bence-Jones protein, for diagnosis of plasma cell myeloma. For 153 potential lymphoid neoplasm cases confirmed by immunostaining, we performed polymerase chain reaction (PCR) analysis for Tax to ascertain proviral human T-cell lymphotropic virus type 1 (HTLV-1) DNA integration. Cases for which HTLV-1 was ascertained were diagnosed as adult T-cell leukemia/lymphoma (ATLL). For negative cases, diagnosis of ATLL required the presence of other findings.
Dose response analysis
Follow-up data were tabulated by city, sex, in city or not in city at the time of bombing, age at exposure, attained age, follow-up period, and bone marrow dose (supplemental Materials and methods).
Background rates of plasma cell myeloma and ATLL varied by calendar year rather than birth cohort and therefore were adjusted for period (ρ) instead of birth year.
Linear () and linear quadratic () models were used to describe the radiation dose response [ρ(d)]. The relative risk (RR) was computed as RR = 1 + ERR.
We tested effect modification of the radiation effect by sex, age at exposure (e), attained age, and time since exposure (t). Because the estimates of radiation doses for subjects with weighted shielded kerma estimates of >4 Gy are likely to be in error, their impact on the magnitude of the risk estimate was limited by inclusion of an indicator (hi) for these subjects as effect modifier.
Fits were compared using likelihood ratio tests (significance level α = 0.05) for nested models and the Akaike Information Criteria for non-nested models. Parameter estimation and testing were carried out using the AMFIT program in Epicure.14
Radiation dose
Dosimetry System 2002 provided estimated individual organ-specific Dosimetry System 2002 Revision 1 doses received from the bombings.15 We used weighted absorbed bone marrow dose calculated as the γ-ray dose plus 10 times the neutron dose.
Ethical considerations
This study was approved by the Human Investigation Committee of the RERF. The Hiroshima and Nagasaki prefectures approved the linkage between the LSS cohort and their cancer registry data.
Results
Of the 730 cases accepted by the pathology review, 553 cases were eligible for analysis of radiation effects (first primary lymphoid neoplasm, diagnosed in Hiroshima or Nagasaki during 1950-1994, and radiation dose estimates available) (Table 1). By broader cell categories, 427 (77%) were mature cell lymphoid neoplasms, including 319 (75%) of B-cell origin and 108 (25%) of T-cell origin; 22 (5%) had undetermined cell lineage. Precursor cell neoplasms were much less frequent (n = 30, 5%) and HLs were even rarer (n = 15, 3%). Specific subtypes could not be determined for 15% (n = 81, NHL or malignant lymphoid neoplasm, not otherwise specified [NOS]).
Eligible and ineligible cases by exclusion reasons, LSS 1950 to 1994
| Lymphoid neoplasm category | Eligible, total | Ineligible* | Total | |||
|---|---|---|---|---|---|---|
| Not first primary | Nonresident | Unknown dose | <1950 or >1995 | |||
| Hodgkin lymphoma | 15 | 1 | 2 | 0 | 2 | 20 |
| Mature B-cell neoplasms | 319 | 31 | 11 | 28 | 29 | 405 |
| Mature T-cell and NK-cell neoplasm | 108 | 3 | 7 | 10 | 6 | 134 |
| Lymphoid neoplasms, non-Hodgkin, NOS | 22 | 0 | 3 | 5 | 1 | 29 |
| Precursor cell neoplasms, B/T/unknown cell lineage | 30 | 2 | 6 | 8 | 6 | 47 |
| Lymphoid neoplasms, NOS | 59 | 3 | 22 | 5 | 9 | 95 |
| Total | 553 | 40 | 51 | 56 | 53 | 730 |
Some cases have more than 1 exclusion reason, NOS; not otherwise specified.
The 2 most common mature B-cell neoplasm subtypes were plasma cell myeloma (PCM) and diffuse large B-cell lymphoma (DLBCL), making up 39% and 36%, respectively, in this group (Table 2). ATLL was the most common mature T-/NK-cell neoplasm subtype (35%) while peripheral T-cell lymphoma, not otherwise specified (PTCL-NOS) and angioimmunoblastic T-cell lymphoma (AITL) represented 22% and 21%, respectively. Cell lineage could not be determined for half of the 30 precursor cell neoplasm cases, and here we accepted “acute lymphoblastic lymphoma/leukemia” as precursor cell lymphoid neoplasms.
Distribution of lymphoid neoplasms by category, diagnostic basis, city and sex, LSS 1950 to 1994
| Cases (%) | ||||||
|---|---|---|---|---|---|---|
| Lymphoid neoplasm category | Total | City | Sex | |||
| Histologically verified | Nagasaki | Hiroshima | Female | Male | ||
| Hodgkin lymphoma | 15 (2.7) | 10 (66.7) | 5 (2.8) | 10 (2.7) | 9 (2.9) | 6 (2.4) |
| Mature B-cell neoplasms | 319 (57.7) | 242 (75.8) | 72 (40.2) | 247 (66.0) | 178 (57.9) | 141 (57.3) |
| CLL/SLL | 10 (1.8) | 4 | 1 (0.6) | 9 (2.4) | 3 (1.0) | 7 (2.8) |
| Mantle cell lymphoma | 5 (0.9) | 5 | 1 (0.6) | 4 (1.1) | 1 (0.3) | 4 (1.6) |
| Lymphoplasmacytic/Waldenstrom (LPL/Wald) | 3 (0.5) | 2 | — | 3 (0.8) | 3 (1.0) | — |
| Diffuse large B-cell lymphoma (DLBCL) | 116 (21.0) | 116 | 19 (10.6) | 97 (25.9) | 60 (19.5) | 56 (22.8) |
| Burkitt lymphoma (BL) | 4 (0.7) | 4 | — | 4 (1.1) | 3 (1.0) | 1 (0.4) |
| Marginal-zone lymphoma, nodal and extranodal (MZL) | 26 (4.7) | 26 | 5 (2.8) | 21 (5.6) | 15 (4.9) | 11 (4.5) |
| Follicular lymphoma (FL) | 22 (4.0) | 22 | 4 (2.2) | 18 (4.8) | 15 (4.9) | 7 (2.8) |
| Hairy cell leukemia (HCL) | 1 (0.2) | 1 | — | 1 (0.3) | — | 1 (0.4) |
| Plasma cell myeloma (PCM) | 124 (22.4) | 54 | 39 (21.8) | 85 (22.7) | 72 (23.5) | 52 (21.1) |
| Mature B-cell neoplasm, NOS | 8 (1.4) | 8 | 3 (1.7) | 5 (1.3) | 6 (2.0) | 2 (2.2) |
| Mature T-cell and NK-cell neoplasms | 108 (19.5) | 98 (90.7) | 61 (34.1) | 47 (12.6) | 57 (18.6) | 51 (20.7) |
| Mycosis fungoides/Sezary syndrome (MF/SS) | 4 (0.7) | 4 | 2 (1.1) | 2 (0.5) | 4 (1.3) | — |
| Peripheral T-cell lymphomas, not otherwise specified (PTCL, NOS) | 24 (4.3) | 24 | 15 (8.4) | 9 (2.4) | 13 (4.2) | 11 (4.5) |
| Angioimmunoblastic T-cell lymphoma (AITL) | 23 (4.2) | 23 | 5 (2.8) | 18 (4.8) | 12 (3.9) | 11 (4.5) |
| Enteropathy-associated T-cell lymphoma | 2 (0.4) | 2 | — | 2 (0.5) | 1 (0.3) | 1 (0.4) |
| Anaplastic large cell lymphoma, ALK positive and negative (ALCL) | 5 (0.9) | 5 | 1 (0.6) | 4 (1.1) | 1 (0.3) | 4 (1.6) |
| Adult T-cell leukemia/lymphoma (ATLL) | 38 (6.9) | 29 | 32 (17.9) | 6 (1.6) | 22 (7.2) | 16 (6.5) |
| T-cell large granular lymphocytic leukemia (LGL) | 2 (0.4) | 2 | 1 (0.6) | 1 (0.3) | 2 (0.7) | — |
| T-cell prolymphocytic leukemia (T-PLL) | 5 (0.9) | 5 | 2 (1.1) | 3 (0.8) | — | 5 (2.0) |
| Extranodal NK/T-cell lymphoma, nasal type | 1 (0.2) | 1 | — | 1 (0.3) | 1 (0.3) | — |
| Mature T-cell neoplasm, NOS | 4 (0.7) | 3 | 3 (1.7) | 1 (0.3) | 1 (0.3) | 3 (1.2) |
| Precursor cell neoplasms | 30 (5.4) | 18 (60.0) | 5 (2.8) | 25 (6.7) | 14 (4.6) | 16 (6.5) |
| B-cell | 7 (1.3) | 7 | 1 (0.6) | 6 (1.6) | 5 (1.6) | 2 (0.8) |
| T-cell | 8 (1.4) | 8 | 1 (0.6) | 7 (1.9) | 3 (1.0) | 5 (2.0) |
| Unknown lineage | 15 (2.7) | 3 | 3 (1.7) | 12 (3.2) | 6 (2.0) | 9 (3.7) |
| Malignant lymphoid neoplasm, non-Hodgkin, NOS | 22 (4.0) | 17 (77.3) | 9 (5.0) | 13 (3.5) | 12 (3.9) | 10 (4.1) |
| Malignant lymphoid neoplasm, NOS | 59 (10.7) | 3 (5.1) | 27 (15.1) | 32 (8.6) | 37 (12.1) | 22 (8.9) |
| Total | 553 (100) | 388 (70.2) | 179 (100) | 374 (100) | 307 (100) | 246 (100) |
Overall, 70% of the cases had histologically verified diagnoses. Due to the low ratio of histological verification for PCMs (44%), the proportion with histological verification was lower for mature B-cell neoplasms (76%) than mature T-/NK-cell neoplasms (91%) (Table 2). Sixty percent of precursor cell neoplasms were histologically verified (18 of 30 cases). Only 5% of malignant lymphoid neoplasm-NOS cases (n = 59) were based on histological review; the remaining cases were based on information from death certificates or clinical records.
Mature T-/NK-cell neoplasms were more frequent in Nagasaki (34%) than Hiroshima (13%), reflecting the high frequency of ATLL (18%), which is endemic in Nagasaki (Table 2).16 Several PTCL-NOS cases were suspected to be ATLL based on clinical and histological findings, but they were kept in the PTCL-NOS category because ATLL diagnosis could not be established in the absence of information regarding proviral DNA of HTLV-1 and anti-HTLV-1 antibodies. This may have contributed to the slightly higher frequency of PTCL-NOS in Nagasaki (8%) than Hiroshima (2%).
Table 3 presents demographic and radiation-dose characteristics for 5 major lymphoid neoplasm categories: HL, mature B-cell, mature T-/NK-cell, precursor cell neoplasms, and the mixed group of non-Hodgkin lymphoid neoplasm, NOS and lymphoid neoplasms, NOS. The larger proportion of cases from Hiroshima reflects the composition of the LSS (∼70% from Hiroshima), with the exception of mature T-/NK-cell neoplasms, which includes a sizable proportion of ATLLs endemic in Nagasaki. The higher proportion of female cases also reflects cohort composition (∼60% females).
Case counts and crude rates by city, sex, age at exposure, attained age, calendar year of diagnosis and radiation dose: Hodgkin lymphoma, mature B-cell neoplasms, mature T-/NK-cell neoplasms, precursor cell neoplasms and other subtypes, LSS, 1950 to 1994
| Hodgkin lymphoma | Mature B-cell neoplasms | Mature T-cell and NK-cell neoplasms | Precursor cell neoplasms | Lymphoid neoplasm, non-Hodgkin lymphoma and NOS | ||
|---|---|---|---|---|---|---|
| Person-years (x100 000) | 15 Cases (%) | 319 Cases (%) | 108 Cases (%) | 30 Cases (%) | 81 Cases (%) | |
| City | ||||||
| Hiroshima | 23.2 | 10 (66.7) | 247 (77.4) | 47 (43.5) | 25 (83.3 | 4 (55.6) |
| Nagasaki | 9.4 | 5 (33.3) | 72 (22.6) | 61 (56.5) | 5 (16.7) | 36.(44.4) |
| Sex | ||||||
| Female | 20.2 | 9 (60.0) | 141 (44.2) | 57 (52.8) | 14 (46.7) | 32 (39.5) |
| Male | 12.5 | 6 (40.0) | 178 (55.8) | 51 (47.2) | 16 (53.3) | 49 (60.5) |
| Crude rates per 100 000 person-y (no. of cases) | ||||||
| Age at exposure, y | ||||||
| <20 | 15.1 | 0.4 (6) | 3.7 (56) | 2.1 (31) | 1.2 (18) | 1.1 (16) |
| 20-39 | 10.6 | 0.5 (5) | 14.9 (157) | 4.2 (44) | 0.8 (8) | 2.9 (31) |
| 40+ | 6.7 | 0.6 (4) | 15.8 (106) | 4.9 (33) | 0.6 (4) | 5.1 (34) |
| Attained age, y | ||||||
| <20 | 2.2 | 0.5 (1) | 0.0 (0) | 0.5 (1) | 2.7 (6) | 0.9 (2) |
| 20-39 | 8.2 | 0.6 (5) | 0.7 (6) | 1.0 (8) | 0.9 (7) | 1.2 (10) |
| 40-59 | 12.3 | 0.2 (2) | 5.0 (62) | 3.3 (41) | 0.7 (9) | 1.5 (19) |
| 60+ | 9.7 | 0.7 (7) | 25.8 (251) | 6.0 (58) | 0.8 (8) | 5.1 (50) |
| Calendar period, y | ||||||
| 1950-1959 | 7.2 | 0.1 (1) | 2.5 (18) | 0.8 (7) | 1.3 (12) | 1.6 (14) |
| 1960-1969 | 8.6 | 0.8 (7) | 4.3 (37) | 3.4 (28) | 0.7 (6) | 2.5 (21) |
| 1970-1979 | 7.2 | 0.7 (5) | 11.4 (82) | 3.6 (25) | 0.7 (5) | 2.3 (16) |
| 1980-1989 | 6.0 | 0.2 (1) | 20.1 (120) | 5.7 (33) | 0.9 (5) | 2.7 (16) |
| 1990-1994 | 3.4 | 0.4 (1) | 18.1 (62) | 6.3 (15) | 0.8 (2) | 5.9 (14) |
| Bone marrow dose, Gy | ||||||
| NIC | 7.6 | 0.4 (3) | 9.7 (74) | 2.5 (19) | 0.3 (2) | 2.2 (17) |
| <0.005 | 10.7 | 0.4 (4) | 9.5 (102) | 3.9 (42) | 0.5 (5) | 3.4 (36) |
| 0.005 to <1.0 | 8.5 | 0.6 (5) | 9.9 (84) | 3.1 (26) | 0.5 (4) | 2.0 (17) |
| 0.1 to <0.03 | 2.7 | 0.0 (0) | 11.6 (31) | 3.4 (9) | 0.7 (2) | 0.7 (2) |
| 0.3 to <1.0 | 2.1 | 1.4 (3) | 9.6 (20) | 5.3 (11) | 2.9 (6) | 1.9 (4) |
| 1.0 to <2.0 | 0.5 | 0.0 (0) | 5.5 (3) | 1.8 (1) | 5.5 (3) | 7.3 (4) |
| 2.0+ | 0.2 | 0.0 (0) | 23.1 (5) | 0.0 (0) | 36.9 (8) | 4.6 (1) |
The crude rates for mature cell neoplasms increased monotonically with age but more rapidly for B-cell than for T-/NK-cell neoplasms, with the highest rates for mature B-cell neoplasms in the oldest age group (>60 years). By contrast, the highest rate for precursor cell neoplasms was observed for the youngest age group (<20 years). The rates for mature cell neoplasms increased, while the rates for precursor cell neoplasms decreased, with increasing age at exposure. The rates increased steadily over the follow-up period, with the notable exception of precursor cell neoplasms, which showed the highest rate during the earliest follow-up period (1950-1959). Precursor cell neoplasm rates, though based on small numbers of cases, were markedly high in the highest marrow dose category, suggesting a radiation effect. Also, for the lymphoid neoplasms-NOS group, the highest rate was found in the highest dose category.
Radiation effects
We analyzed the radiation dose response for a number of outcomes including HL, total non-Hodgkin lymphoid neoplasm, and 4 non-Hodgkin subgroups: mature B-cell, mature T-/NK-cell, precursor cell neoplasms, plus others (non-Hodgkin lymphoid neoplasms, NOS, and lymphoid neoplasms, NOS). We also examined the dose response separately for DLBCL, other mature B-cell neoplasms, ATLL and other mature T-/NK-cell neoplasms.
Hodgkin lymphoma
In the dose response analysis of 15 HL cases (including 10 histologically verified cases), the estimated ERR/Gy of 0.61 (95% confidence interval [CI]: less than −0.09, 7.17) was not statistically significant from 0.
All non-Hodgkin lymphoid neoplasms
We found a significant linear dose response for all non-Hodgkin lymphoid neoplasms as a group, with an ERR/Gy estimate of 0.54 (95% CI: 0.14; 1.09, P < .001) (Table 4); the results based on histologically verified cases were essentially the same (ERR/Gy = 0.50; 95% CI: 0.06, 1.10). Linear and linear quadratic models fit the data similarly well (Figure 1A). The estimated ERR/Gy of 0.60 (95% CI; < 0.33, 1.26) for Hiroshima was larger than that for Nagasaki (0.28; 95% CI; less than −0.06, 1.22), but this difference was not statistically significant (P = .44). As previously noted in this cohort,5 we found a significant dose response for males with an ERR/Gy of 0.95 (95% CI: 0.25, 1.93) but not for females (0.05; 95% CI: less than −0.10, 0.63); the male/female difference was significant (P = .02). When modifying effects were considered individually, the ERR significantly decreased with attained age (proportional to age to the power −5.2, 95% CI: −8.1, −3.2, P < .001), age at exposure (P < .001), and time since exposure (P < .001). However, in the model that allowed the ERR to vary with attained age, neither age at exposure (P = .86) nor time since exposure (P = .35) had a statistically significant effect on the ERR.
Excess relative risk estimates for Hodgkin lymphoma, mature B-cell neoplasms, mature T-cell neoplasms and precursor lymphoid neoplasms, LSS, 1950 to 1994
| Cases | n | ERR at 1Gy | RR at 1Gy | Model | |
|---|---|---|---|---|---|
| Hodgkin lymphoma | All | 15 | 0.61 (less than −0.09, 7.17) | 1.61 | Linear, high-dose adjustment |
| All non-Hodgkin lymphoid neoplasms | All | 479 | 0.54 (0.14, 1.09) | 1.54 | Linear, high-dose adjustment Male ERR (0.95) >Female ERR (0.05); ERR decreasing with increasing attained age |
| HV | 375 | 0.50 (0.06, 1.10) | 1.50 | Linear, high-dose adjustment | |
| Mature B-cell neoplasms | All | 319 | 0.04 (-0.24, 0.52) | 1.04 | Linear, high-dose adjustment |
| HV | 242 | 0.07 (NA, 0.69) | 1.07 | Linear | |
| PCM | All | 124 | −0.02 (less than −0.23, 0.62) | 0.08 | Linear |
| HV | 54 | 0.36 (−0.28, 1.96) | 1.36 | Linear, high-dose adjustment | |
| DLBCL | All | 116 | 0.14 (less than −0.18, 1.07) | 1.14 | Linear |
| Others | All | 79 | 0.42 (−0.30, 1.95) | 1.42 | Linear, high-dose adjustment |
| Mature T-cell and NK-cell neoplasms | All | 108 | −0.19 (NA, 0.78) | 0.81 | Linear |
| HV | 98 | −0.18 (NA, 10.84) | 0.82 | Linear | |
| ATLL | All | 32 | −0.30 (NA, 1.19) | 0.70 | Linear, among Nagasaki subjects |
| HV | 23 | −0.30 (NA, 1.01) | 0.70 | Linear, among Nagasaki subjects | |
| Others | All | 70 | 0.42 (less than -0.24, 2.21) | 1.42 | Linear, high-dose adjustment |
| Precursor cell neoplasms | All | 30 | Male: (L) 6.43 (0.96, 25.4), (Q) 48.6 (9.07, 330); Female: (L) 6.43 (0.96, 25.4) | Male: 56 Female: 7.43 | Male: Linear-quadratic (LQ). Female: Linear (L), high-dose adjustment; ERR decreasing with increasing attained age |
| Lymphoid neoplasms, NOS | All | 81 | 0.48 (−0.22, 1.79) | 1.48 | Linear, high-dose adjustment |
ERR, excess relative risk; RR, relative risk (calculated from ERR by using the definition ERR = RR - 1); HV, histologically verified; NA, not available; PCM, plasma cell myeloma; DLBCL, diffuse large B-cell lymphoma; ATLL, adult T-cell leukemia/lymphoma.
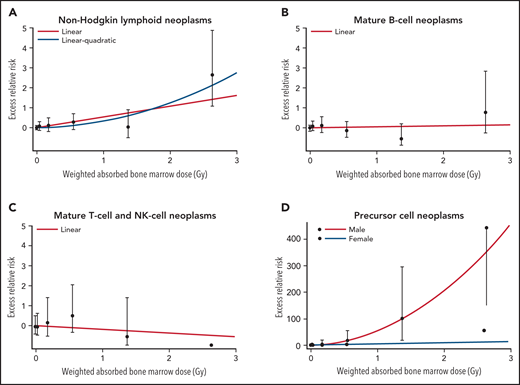
Dose response for non-Hodgkin lymphoid neoplasms, mature B-cell, T-/NK-cell neoplasms and Precursor cell neoplasms, LSS, 1950-1994. Fitted radiation dose responses for (A) NHL, (B) Mature B-cell neoplasms, (C) Mature T-cell and NK-cell neoplasms and (D) Precursor cell neoplasms. In panels A-C, the line displays the best-fitted linear dose response function, and the dashed line in panel A represents linear-quadratic dose response function. In panel D, the line indicates the best-fitted dose response in male (linear-quadratic), and the dashed line represents those in female (linear).
Dose response for non-Hodgkin lymphoid neoplasms, mature B-cell, T-/NK-cell neoplasms and Precursor cell neoplasms, LSS, 1950-1994. Fitted radiation dose responses for (A) NHL, (B) Mature B-cell neoplasms, (C) Mature T-cell and NK-cell neoplasms and (D) Precursor cell neoplasms. In panels A-C, the line displays the best-fitted linear dose response function, and the dashed line in panel A represents linear-quadratic dose response function. In panel D, the line indicates the best-fitted dose response in male (linear-quadratic), and the dashed line represents those in female (linear).
Mature B-cell neoplasms
Using a linear model, we found no evidence of a dose response for mature B-cell neoplasms regardless of whether analysis considered all cases or was restricted to historically verified cases. An estimated ERR/Gy was 0.04 (95% CI: −0.24, 0.52, P = .78) for all cases and 0.07 (95% CI: not available, 0.69) for histologically verified cases (Table 4; Figure 1B).
PCM was 1 of the 2 most common types of B-cell neoplasms. Baseline rates for PCM varied markedly by period with little difference by birth cohort. Age-specific rates in Nagasaki showed an increasing trend prior to 1975 but decreased in later years; a similar pattern was seen in Hiroshima, although age-specific incidence rates peaked in approximately 1980 and declined rapidly thereafter. This may partially be due to a special cross-sectional survey of monoclonal gammopathy conducted among participants of the clinical subcohort during 1979-1981 and 1985-1987.17 For all cases (n = 124), the ERR/Gy was −0.02 (95% CI: < −0.23, 0.62). The ERR/Gy of 0.36 (95% CI: −0.28, 1.96) was larger for histologically verified cases (n = 54, 44% of all cases), but was not significantly different from that for all cases.
There was no evidence of a radiation effect for another most common type, DLBCL, which was all histologically verified, with the ERR/Gy of 0.14 (95% CI: < −0.18, 1.07). For the remaining group of other and miscellaneous types of mature B-cell neoplasms, the ERR/Gy of 0.42 (95% CI: −0.30, 1.95) was not significant.
Mature T-cell and NK-cell neoplasms
For mature T-/NK-cell neoplasm, the ERR/Gy was estimated to be −0.19 (95% CI: not available, 0.78) (Figure 1C); this was similar to the estimate (−0.18; 95% CI: not available, 0.84) for histologically verified cases. Neither estimates were statistically significantly different from 0. The risk for ATLL was estimated only for Nagasaki subjects (n = 32) because there were too few cases (n = 6) among Hiroshima subjects. There was no evidence of a radiation effect on ATLL regardless of whether all or histologically verified cases were considered, with the ERRs/Gy of −0.30 (95% CI: NA, 1.19) and −0.30 (95% CI: NA, 1.01), respectively (Table 4). The ERR/Gy for all other mature T-/NK-cell subtypes together was 0.42 (95% CI: −0.24, 2.21) and not statistically significant.
Precursor cell neoplasms
This small group of lymphoid neoplasms is of special interest because of the strong radiation effect for acute lymphoblastic leukemia (ALL), as previously reported.5 Because of the relatively high proportion of cases without histological verification (40%) we present results of analysis of all cases combined. We found the linear dose response to differ significantly by sex (P = .007) with the ERR/Gy for males being 17 times higher than that for females. There was a statistically significant (P = .05) decrease in the ERR with increasing attained age (proportional to attained age to the power −2.5, 95% CI: −5.1, −0.02). The sex-averaged linear ERR/Gy was 16 (95% CI: 2.7, 449) at age 50; it was 58 and 6.9 at ages 30 and 70, respectively. While the ERR appeared to decrease sharply with increasing age at exposure at −13% per decade, this trend was not statistically significant (P = .6). The slight decrease in the ERR with increasing time since exposure (proportional to time since exposure to the power −0.13) was not significant (P = .80). The model fit significantly better when a quadratic term was included (P = .002). By sex, the dose-response for males was best described as linear-quadratic (P for curvature = 0.02) while for females, there was no indication of significant non-linearity (Figure 1D). Using a linear-quadratic model for males and a linear model for females, the sex-specific ERRs at 1 Gy were 55 (6.43 + 48.6) for males (95% CI: 9.5, 620) and 6.4 (95% CI: 0.96, 25.4) for females (Table 4).
Lymphoid neoplasms, NOS
There was no evidence of a radiation effect for this mixed group, with an ERR/Gy of 0.48 (95% CI: −0.22, 1.79), which was similar in magnitude to that for all non-Hodgkin lymphoid neoplasms as a group.
Non-Hodgkin lymphoid neoplasms excluding precursor cell neoplasms
We estimated radiation risks for non-Hodgkin lymphoid neoplasms after excluding major subtypes sequentially. The purpose was to evaluate which subtype(s) contributed to the significant dose radiation dose response observed for all non-Hodgkin lymphoid neoplasms as a group. The ERR/Gy estimates were not significantly affected by excluding any of the major subtypes in Table 4 except for precursor cell neoplasms. After excluding precursor cell neoplasms, the ERR/Gy decreased to 0.07 (95% CI: −0.21, 0.51) and was no longer significant (P = .49).
Relation to the Hsu study
The current data include 491 cases diagnosed between 1950 and 1994 that were used in the analyses of Hsu et al5 (supplemental Table 5). Of the 390 mature lymphoid neoplasms (B- and T-/NK-cell) in the present study, 57% were reported as non-Hodgkin lymphoma in the Hsu study; 25% as MM; 8% as ATL, 5% as HL, and 2% as CLL; a few were reported as leukemia, including ALL (1%), acute myeloid leukemia, and acute leukemia, NOS (<1% each). A large proportion (80%) of precursor cell neoplasms (n = 30) were reported as ALL in the Hsu study while 13% were classified as non-Hodgkin lymphoma (n = 4), and 1 each as AML and chronic myeloid leukemia. While 80% of HL (n = 10) were reported as such in the Hsu study, only 25% of HLs (n = 31) in the Hsu study were classified as HL in the current study; the remaining 75% were classified as mature cell lymphoid neoplasms. There was a good agreement between the 2 studies for PCMs, with 98 of 99 PCM’s classified as MM in the Hsu study. Sixty-eight percent of ATLLs in the present study were reported as ATLs in the Hsu study.
Discussion
We classified 553 lymphoid neoplasm cases in the LSS for the period 1950-1994 into WHO subtypes. Although the current data from the cohort are limited in size and more heavily influenced by the rates among the elderly than cross-sectional population data, the rate-patterns in this cohort are largely consistent with what is known about the general features of the subtype rates: ie increasing age-specific incidence rates with advancing age for mature cell neoplasms and increased rates at children/adolescents/young adults for precursor cell neoplasms. The proportion of mature T/NK-cell neoplasms (20%) in the LSS is higher than in the US (5%) and reflects the high frequency of ATLL endemic to Kyushu area, which includes Nagasaki (12% in Kyushu and 18% in the Nagasaki LSS) (supplemental Table 6).3,18 Consequently, the relative frequency of mature B-cell neoplasms in the LSS is somewhat lower in Nagasaki (40%) than in Hiroshima (66%), and this trend is consistent with regional data compiled by the Lymphoma Study Group of Japanese Pathologists (Kyushu vs Kinki/Chugoku/Shikoku areas) (supplemental Table 6). The relatively high frequency of PCM (22%) is consistent with previously reported incidence and mortality data5,6 (∼20% of all lymphoid malignancies), largely reflecting the aging cohort population.
There is evidence of the presence of subtle, long-term T-cell immune dysfunction associated with radiation exposure in this population of atomic bomb survivors.19,20 Severe immunosuppression has been associated with a range of malignancies, including NHL, in studies of transplant patients and HIV patients, and most posttransplant NHLs have been of B-cell origin.2 However, we did not find a statistically significant radiation dose response for either mature B-cell or mature T-/NK-cell neoplasms or for most of the specific disease entities that we analyzed. However, given the small number of cases, statistical power may have been insufficient for detecting subtle differences in subtype specific rates.
It is reported that mutation frequency is lower in precursor than mature cell lymphoid neoplasms.21 It may be that a driver gene(s) is powerful enough to drive the development of precursor cell neoplasms, while combination of several genetic alterations may be necessary for development of mature cell neoplasms. In addition to genetic alterations, tumor-micro-environmental cells may play critical roles in development and pathophysiology of mature cell neoplasms.22 On the other hand, precursor cell neoplasms harbor genetic alterations, including NOTCH1 mutation in T-cell precursor neoplasms,23 that cause autonomous proliferation without depending on the tumor micro-environmental cells. The development of precursor cell neoplasm may need only a simpler but more efficient genetic alteration than mature cell neoplasms. This may be associated with the findings that the radiation dose response was observed for precursor but not for mature cell neoplasms.
The difference in the proportions of T-/NK-cell and B-cell neoplasms between Nagasaki and Hiroshima in this study partially reflects the well-known differences in the distribution of HTLV-1 in the 2 areas.16 Although we examined the integration of the HTLV-1 Tax gene by PCR in 51 of the 70 cases with T-/NK-cell neoplasm, including clinically-suspected ATLL in Nagasaki, PCR failed to prove the presence of the viral genome for a definitive diagnosis of ATLL, even in those cases which appeared clinically and histologically pleomorphic. Application of a new diagnostic strategy for ATLL using a combination of RNA in situ hybridization and quantitative PCR24 is likely to improve diagnostic precision and may reveal more details concerning the incidence of ATLL in this cohort. On the other hand, the proportion of AITL was lower in Nagasaki (2.8%) than in Hiroshima (4.8%), indicating a low probability of HTLV-1 involvement in this subtype of PTCL.
An important limitation of the present study is that our case ascertainment depended primarily on histological verification using tissue specimens available for immunohistochemical staining. Although we feel that leukemia cases coincident with lymphoid neoplasms were adequately represented in this study, leukemic-only cases may have been less well-represented because their diagnoses were verifiable only when results from bone marrow aspiration were available. In addition, because diagnoses of PCM were usually made without biopsy, this resulted in the lower proportion of histologically verified PCM cases compared with other subtypes. This, in addition to the large proportion of elderly subjects on this cohort, may be related to the higher proportion of PCM observed in the current study (supplemental Table 6). However, the higher ERR for histological verified PCM, though not statistically significant, suggests the need for further in-depth review to establish diagnosis of PCM, and that is currently underway.
Previous LSS data have shown a strong dose response for ALL, with the ERR declining sharply with increasing attained age and being higher for males than for females.5 The large majority (24) of the 30 precursor cell neoplasm cases in the present study were previously classified as ALL (supplemental Table 3). While we previously found a significant dose response for NHL for males only (including both mature and precursor cell neoplasms), in the present study the dose response for non-Hodgkin lymphoid neoplasms was no longer significant after excluding precursor cell lymphoid neoplasms.
This is the first LSS report on radiation risk for lymphoid neoplasms using histological subtypes. The results demonstrate the feasibility of incorporating the contemporary lymphoid neoplasms classification scheme in the LSS incidence follow up data. The current study provides evidence of the strong radiation effect on precursor cell lymphoid neoplasms, but there remain uncertainties associated with the use of mostly immunostaining-based histology data, as there is potential bias related to tumors for which tissue specimens and data are limited or lacking. We will address this concern in our new LSS follow-up, now underway, updating both lymphoid and myeloid malignancies.
Acknowledgments
The authors wish to acknowledge the major contributions of Koji Nanba, Osamu Takahara, and Shoji Tokuoka (deceased). This project was initiated by Masayoshi Tokunaga, together with Tokuoka, who were instrumental in the planning, development, and implementation of this project. Without their involvement in the review process, this study would not have been possible.
The Radiation Effects Research Foundation (RERF), Hiroshima and Nagasaki, Japan, is a public interest incorporated foundation funded by the Japanese Ministry of Health, Labor, and Welfare, and the US Department of Energy. This research was also supported by the National Institutes of Health (NIH), National Cancer Institute contract N02-CO-2009-0005, and in part by the Intramural Research Program of the NIH Division of Cancer Epidemiology and Genetics. This publication was supported by RERF Research Protocol 3-94. The views of the authors do not necessarily reflect those of the 2 governments.
Authorship
Contribution: M.F. designed, and executed pathological review; R.S. designed, and executed statistical analysis; N.Y., K.O. assisted with analysis; D.L.P. and K.M. designed and analyzed the data; and M.F., N.Y., R.S., D.L.P., K.M. cowrote the manuscript.
Conflict-of-interest disclosure: The authors declare no competing financial interests.
Correspondence: Ritsu Sakata, Department of Epidemiology, Radiation Research Foundation, 5-2 Hijiyama Park, Minami-ku, Hiroshima 732-0815, Japan; e-mail: rsakata@rerf.or.jp.
The online version of this article contains a data supplement.
The publication costs of this article were defrayed in part by page charge payment. Therefore, and solely to indicate this fact, this article is hereby marked “advertisement” in accordance with 18 USC section 1734.

This feature is available to Subscribers Only
Sign In or Create an Account Close Modal