

Key Points
MEKK3-KLF2/4 signaling is required for EHT in the yolk sac and AGM.
MEKK3 mediates both inflammatory and hemodynamic stimuli during developmental hematopoiesis.

Abstract
The hematopoietic stem cells (HSCs) that produce blood for the lifetime of an animal arise from RUNX1+ hemogenic endothelial cells (HECs) in the embryonic vasculature through a process of endothelial-to-hematopoietic transition (EHT). Studies have identified inflammatory mediators and fluid shear forces as critical environmental stimuli for EHT, raising the question of how such diverse inputs are integrated to drive HEC specification. Endothelial cell MEKK3-KLF2/4 signaling can be activated by both fluid shear forces and inflammatory mediators, and it plays roles in cardiovascular development and disease that have been linked to both stimuli. Here we demonstrate that MEKK3 and KLF2/4 are required in endothelial cells for the specification of RUNX1+ HECs in both the yolk sac and dorsal aorta of the mouse embryo and for their transition to intraaortic hematopoietic cluster (IAHC) cells. The inflammatory mediators lipopolysaccharide and interferon-γ increase RUNX1+ HECs in an MEKK3-dependent manner. Maternal administration of catecholamines that stimulate embryo cardiac function and accelerate yolk sac vascular remodeling increases EHT by wild-type but not MEKK3-deficient endothelium. These findings identify MEKK-KLF2/4 signaling as an essential pathway for EHT and provide a molecular basis for the integration of diverse environmental inputs, such as inflammatory mediators and hemodynamic forces, during definitive hematopoiesis.
Introduction
Hematopoietic stem and progenitor cells (HSPCs) differentiate from hemogenic endothelial cells (HECs) in the embryo through an endothelial-to-hematopoietic transition (EHT). All HECs express and require the transcription factor RUNX1 to undergo EHT.1 HSPCs form in several anatomic locations, starting in the mouse yolk sac at embryonic day (E)7.25 with the generation of progenitors for primitive erythrocytes, macrophages, and megakaryocytes, followed at E8.5 by erythromyeloid progenitors (EMPs) and B-1 lymphocyte progenitors and at E9.5 by lymphomyeloid biased progenitors.2-5 Hematopoietic progenitor cell formation from HECs in the yolk sac coincides with the onset of cardiac contraction and blood flow, which in the mouse embryo begins at the 5 to 7 somite pair stage (∼E8).6 Peak flow velocity steadily increases from E8.5 through E10.5,6 overlapping the period when a subset of endothelial cells in the major arteries (dorsal aorta, vitelline, and umbilical) begin to express RUNX1 and undergo EHT. HECs in the major arteries give rise to lymphoid progenitors, lymphomyeloid biased progenitors (LMPs), true hematopoietic stem cells (HSCs), and precursors of HSCs called pre-HSCs.3,7,8
In addition to canonical developmental signaling pathways such as Notch, Wnt, and transforming growth factor family signaling, environmental stimuli of EHT have been identified in zebrafish and mouse embryos.9 These include hemodynamic forces associated with blood flow, such as shear and cyclic stress, which stimulate RUNX1 expression and blood cell formation.10,11 Flow-induced endothelial nitric oxide production and vascular tone also promote blood cell formation in both zebrafish and mouse embryos.12 Ex vivo studies of mammalian Flk1+ cells derived from embryonic stem cells and from cells isolated from the aorta-gonad-mesonephros (AGM) region of mouse embryos correlated fluid shear forces with induction of the transcription factors KLF2 and RUNX1,13 and in vivo studies identified a role for the KLF2 homolog klf2a in HSPC formation in zebrafish embryos.14 Zebrafish and mouse embryos in which cardiac contraction and blood flow were blocked by a mutation in Ncx1, which encodes a sodium-calcium exchanger, generated greatly reduced numbers of HSPCs in the dorsal aorta. However, EHT was preserved in the yolk sac of E9.5 mouse NCX1 mutant embryos,15,16 suggesting that blood flow is not essential for EHT at all sites of hematopoietic ontogeny.
An unexpected second environmental input for EHT identified by recent studies is inflammatory signals, including tumor necrosis factor (TNF),17 interleukin-1β (IL-1β),18 toll-like receptor 4 (TLR4),19 and types I and II interferons (IFN-α and IFN-γ)20-22 (reviewed by Clapes et al23). This new paradigm, more established in fish than in mammals, is consistent with a model in which multiple inflammatory signaling inputs are somehow integrated by endothelial cells to promote HSPC formation. One study showed that overexpression of IFN-γ and its receptor partially restored HSPC emergence in zebrafish embryos lacking a heartbeat and blood flow.21 Whether and how hemodynamic and inflammatory signals are integrated remains unclear.
The mitogen-activated protein kinase kinase kinase 3 (MEKK3) and its downstream transcription factor effectors KLF2 and KLF4 have been identified as a key pathway by which endothelial cells transduce both hemodynamic shear forces and inflammatory signals. In vitro studies demonstrated that fluid shear force potently stimulates the expression of Klf2 and Klf4,24-26 whereas in vivo studies correlated their expression with sites of high shear forces and demonstrated functional roles in shear-dependent cardiovascular remodeling.27-30 MEKK3 has been strongly linked to inflammatory signaling downstream of interleukin and toll-like receptors31,32 and shown to be required for cardiovascular development.33,34 The existence of a linear MEKK3-KLF2/4 signaling pathway in endothelial cells that mediates both hemodynamic and inflammatory signals has been most clearly established by studies of mice lacking the cerebral cavernous malformation complex that negatively regulates MEKK3 activity.35-38 Precisely how MEKK3 is coupled to KLF2 and KLF4 in this pathway is not yet fully established, but the MAP2K MEK5 and the MAPK ERK5 are thought to establish this link.39,40
The studies described below identify MEKK3-KLF2/4 signaling as a central mechanism by which environmental stimuli as diverse as inflammatory mediators and hemodynamic forces are integrated to stimulate definitive hematopoiesis in the developing embryo.
Materials and methods
Colony-forming assays
Single-cell suspensions from the yolk sacs were plated on methylcellulose and cultured for 5 days (primitive, E8.5) or 6 to 7 days (EMPs, E9.5). Hematopoietic colonies were identified as described.41,42
Flow cytometry and endothelial cell sorting
AGMs were dissociated with 0.125% collagenase, and endothelial cells were sorted on a BD Influx.
Single-cell RNA sequencing
Sorted cells were processed for library preparation using the 10× Genomics Chromium Single Cell 3′ Reagent Kit version 3. Bioinformatic analysis is described in online methods.
Embryo explant culture
The embryo body trunk was cultured in DMEM + 1% fetal bovine serum in a 24-well plate on a rocker. Embryo viability was determined by the presence of a beating heart at 40 hours.
Statistical analysis
The significance of multivariable comparisons throughout the study was determined by an unpaired 2-tailed Student t test or χ2 tests (http://graphpad.com/quickcalcs/chisquared1.cfm).
Results
Endothelial MEKK3 promotes the specification of RUNX1+ HECs in the yolk sac
To examine the role of MEKK3 (encoded by Map3k3) in yolk sac hematopoiesis, we generated Tie2-Cre;Map3k3fl/− embryos lacking MEKK3 function in endothelial cells (hereafter called EC MEKK3KO embryos). Map3k3f/f and Map3k3f/+ embryos were used as controls (control). Tie2-Cre is expressed in the yolk sac mesoderm and endothelial cells from which both primitive and definitive hematopoietic progenitors in the yolk sac are derived43 and thus will delete in both lineages.44 E9.5 EC MEKK3KO embryos were visually indistinguishable from control littermates, but E10.5 embryos appeared pale with poorly visible yolk sac vessels despite normal growth (Figure 1A; supplemental Figure 1). Histological sections of E9.5 and E10.5 yolk sacs revealed dilated vessels and a reduced number of luminal blood cells in EC MEKK3KO embryos, a phenotype that was more pronounced at E10.5 (Figure 1B; supplemental Figure 2A-B). Incomplete vascular remodeling from a primitive plexus to a fully hierarchical vascular network was evident in flat-mounted EC MEKK3KO yolk sacs stained for the endothelial cell marker CD31 (supplemental Figure 2C). Analysis of primitive erythroid progenitors (EryP-CFC) and the distribution of EryP, EryP-mixed lineage or macrophage colonies generated from E8.5 EC MEKK3KO and control yolk sacs revealed no differences (Figure 1C-D), indicating that the reduction in luminal blood cells observed in histological sections and overall pale appearance did not result from defects in primitive erythropoietic progenitors. Instead, MEKK3 is likely to be required for later stages of primitive erythropoiesis. Although KLF2 and KLF4 deficiency have been reported to impair embryonic β globin gene expression,45-47 analysis of E10 EC MEKK3KO yolk sacs revealed no loss of globin gene expression (supplemental Figure 2D). Thus, the basis for early anemia in EC MEKK3KO animals remains undefined.
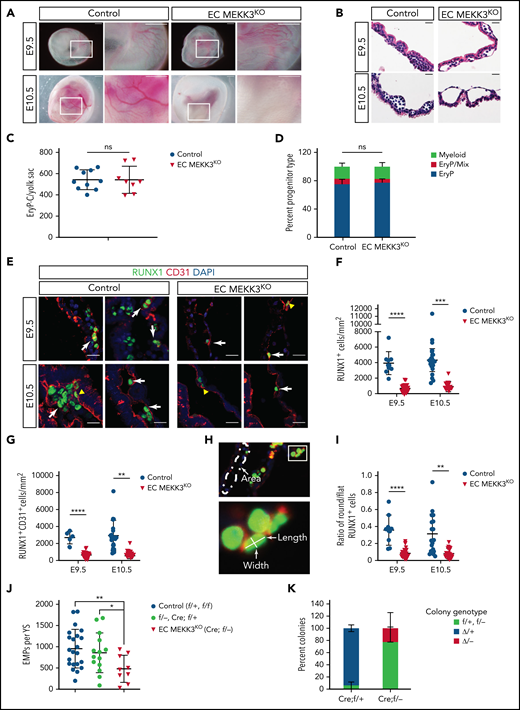
Loss of endothelial cell MEKK3 function impairs definitive hematopoiesis in the yolk sac. (A) Visual appearance of E9.5 and E10.5 control (Map3k3f/+ and Map3k3f/f) and EC MEKK3KO (Tie2-Cre; Map3k3f/-) embryos surrounded by intact yolk sacs. Boxed regions are shown at higher magnification in the image on the right. Note the pale appearance and lack of visible vasculature in the E10.5 EC MEKK3KO yolk sac. Images are representative of 8 to 10 embryos of each genotype at both timepoints. Scale bars, 500 μm. (B) Hematoxylin and eosin stained sections of E9.5 and E10.5 control and EC MEKK3KO yolk sacs showing dilated vascular spaces and lack of intravascular round hematopoietic cells in the E10.5 EC MEKK3KO yolk sac. Images are representative of 8 to 10 yolk sacs per genotype at both timepoints. Scale bars, 20 μm. (C) The number of primitive erythroid colony-forming progenitors (EryP-CFC) in E8.5 control and EC MEKK3KO yolk sacs. Each data point represents a single yolk sac. N = 10 control and 8 EC MEKK3KO embryos. Error bars represent mean ± standard deviation (SD) and significance determined by an unpaired, 2-tailed Student t test. (D) Fraction of myeloid, EryP/Mix (erythrocyte progenitors/mixed lineage), and EryP (erythrocyte progenitors) colonies identified from culture of E8.5 control and EC MEKK3KO yolk sacs. N = 10 control and 8 EC MEKK3KO yolk sacs. (E) Confocal image of E9.5 and E10.5 control and EC MEKK3KO yolk sac sections stained for CD31 and RUNX1. White arrows indicate rounded RUNX1+CD31+ cells; yellow arrowheads indicate flat RUNX1+ HECs. Scale bars, 20 μm. (F) Number of RUNX1+ cells per square millimeter (mm2) of vascular area in E9.5 and E10.5 control and EC MEKK3KO yolk sacs. N = 9 E9.5 control, 18 E10.5 control, 17 E9.5 EC MEKK3KO, and 10 E10.5 EC MEKK3KO yolk sacs. Each data point represents the mean of >25 vessels analyzed in a single animal’s yolk sac. Error bars represent mean ± SD with significance determined by an unpaired, 2-tailed Student t test. (G) Number of RUNX1+ CD31+ cells per mm2 of vascular area in E9.5 and E10.5 control and EC MEKK3KO yolk sacs. N = 9 E9.5 control, 18 E10.5 control, 17 E9.5 EC MEKK3KO, and 10 E10.5 EC MEKK3KO yolk sacs. Error bars represent mean ± SD with significance determined by an unpaired, 2-tailed Student t test. (H) Method of measuring vascular area and the number of round and flat RUNX1+ HECs. Vascular area measurement was determined using ImageJ after defining vascular borders based on CD31 expression (top). Flat endothelial cells were defined as those with a length/width ratio of >2:1, and round cells with a length/width ratio of ≤2:1. (I) Ratio of round/flat RUNX1+ cells in E9.5 and E10.5 control and EC MEKK3KO yolk sacs. N = 9 E9.5 control, 18 E10.5 control, 17 E9.5 EC MEKK3KO, and 10 E10.5 EC MEKK3KO yolk sacs. Error bars represent mean ± SD with significance determined by an unpaired, 2-tailed Student t test. (J) The number of EMPs per yolk sac (±SD), enumerated in methylcellulose colony-forming assays. f/+ = Map3k3f/+; f/- = Map3k3f-; Cre;f/+ = Tie2-Cre;Map3k3f/+; Cre;f/−= Tie2-Cre;Map3k3f/−. Cre;f/+ embryos were used to determine the deletion efficiency of the Map3k3f allele by Tie2-Cre. (K) Individual EMP colonies analyzed by polymerase chain reaction for deletion of Map3k3f alleles. f/+ represents colonies from Tie2-Cre; Map3k3f//+ yolk sacs in which the Map3k3f allele was not deleted, and Δ/+ represents colonies from Tie2-Cre; Map3k3f//+ yolk sacs in which the Map3k3f allele was deleted. f/− and Δ/− represent colonies from Tie2-Cre; Map3k3f//− yolk sacs in which the Map3k3f allele was not deleted (f/−) or deleted (Δ/−). Error bars represent mean ± SD of 7 individual Cre; f/+ and Cre; f/− embryos. The significance was determined by an unpaired, 2-tailed Student t test. In all panels **P < .01; ***P < .001; ****P < .0001.
Loss of endothelial cell MEKK3 function impairs definitive hematopoiesis in the yolk sac. (A) Visual appearance of E9.5 and E10.5 control (Map3k3f/+ and Map3k3f/f) and EC MEKK3KO (Tie2-Cre; Map3k3f/-) embryos surrounded by intact yolk sacs. Boxed regions are shown at higher magnification in the image on the right. Note the pale appearance and lack of visible vasculature in the E10.5 EC MEKK3KO yolk sac. Images are representative of 8 to 10 embryos of each genotype at both timepoints. Scale bars, 500 μm. (B) Hematoxylin and eosin stained sections of E9.5 and E10.5 control and EC MEKK3KO yolk sacs showing dilated vascular spaces and lack of intravascular round hematopoietic cells in the E10.5 EC MEKK3KO yolk sac. Images are representative of 8 to 10 yolk sacs per genotype at both timepoints. Scale bars, 20 μm. (C) The number of primitive erythroid colony-forming progenitors (EryP-CFC) in E8.5 control and EC MEKK3KO yolk sacs. Each data point represents a single yolk sac. N = 10 control and 8 EC MEKK3KO embryos. Error bars represent mean ± standard deviation (SD) and significance determined by an unpaired, 2-tailed Student t test. (D) Fraction of myeloid, EryP/Mix (erythrocyte progenitors/mixed lineage), and EryP (erythrocyte progenitors) colonies identified from culture of E8.5 control and EC MEKK3KO yolk sacs. N = 10 control and 8 EC MEKK3KO yolk sacs. (E) Confocal image of E9.5 and E10.5 control and EC MEKK3KO yolk sac sections stained for CD31 and RUNX1. White arrows indicate rounded RUNX1+CD31+ cells; yellow arrowheads indicate flat RUNX1+ HECs. Scale bars, 20 μm. (F) Number of RUNX1+ cells per square millimeter (mm2) of vascular area in E9.5 and E10.5 control and EC MEKK3KO yolk sacs. N = 9 E9.5 control, 18 E10.5 control, 17 E9.5 EC MEKK3KO, and 10 E10.5 EC MEKK3KO yolk sacs. Each data point represents the mean of >25 vessels analyzed in a single animal’s yolk sac. Error bars represent mean ± SD with significance determined by an unpaired, 2-tailed Student t test. (G) Number of RUNX1+ CD31+ cells per mm2 of vascular area in E9.5 and E10.5 control and EC MEKK3KO yolk sacs. N = 9 E9.5 control, 18 E10.5 control, 17 E9.5 EC MEKK3KO, and 10 E10.5 EC MEKK3KO yolk sacs. Error bars represent mean ± SD with significance determined by an unpaired, 2-tailed Student t test. (H) Method of measuring vascular area and the number of round and flat RUNX1+ HECs. Vascular area measurement was determined using ImageJ after defining vascular borders based on CD31 expression (top). Flat endothelial cells were defined as those with a length/width ratio of >2:1, and round cells with a length/width ratio of ≤2:1. (I) Ratio of round/flat RUNX1+ cells in E9.5 and E10.5 control and EC MEKK3KO yolk sacs. N = 9 E9.5 control, 18 E10.5 control, 17 E9.5 EC MEKK3KO, and 10 E10.5 EC MEKK3KO yolk sacs. Error bars represent mean ± SD with significance determined by an unpaired, 2-tailed Student t test. (J) The number of EMPs per yolk sac (±SD), enumerated in methylcellulose colony-forming assays. f/+ = Map3k3f/+; f/- = Map3k3f-; Cre;f/+ = Tie2-Cre;Map3k3f/+; Cre;f/−= Tie2-Cre;Map3k3f/−. Cre;f/+ embryos were used to determine the deletion efficiency of the Map3k3f allele by Tie2-Cre. (K) Individual EMP colonies analyzed by polymerase chain reaction for deletion of Map3k3f alleles. f/+ represents colonies from Tie2-Cre; Map3k3f//+ yolk sacs in which the Map3k3f allele was not deleted, and Δ/+ represents colonies from Tie2-Cre; Map3k3f//+ yolk sacs in which the Map3k3f allele was deleted. f/− and Δ/− represent colonies from Tie2-Cre; Map3k3f//− yolk sacs in which the Map3k3f allele was not deleted (f/−) or deleted (Δ/−). Error bars represent mean ± SD of 7 individual Cre; f/+ and Cre; f/− embryos. The significance was determined by an unpaired, 2-tailed Student t test. In all panels **P < .01; ***P < .001; ****P < .0001.
Definitive hematopoiesis is marked by the onset of RUNX1 expression in HECs that undergo subsequent molecular and morphological changes as they transition from a flat endothelial cell monolayer to round hematopoietic cluster cells that are loosely associated with the vessel wall.15,48,49 To determine whether RUNX1+ HECs are normally specified in the yolk sac of EC MEKK3KO embryos, we performed immunostaining for RUNX1 and the pan-endothelial cell marker CD31. Compared with control yolk sacs, E9.5 and E10.5 EC MEKK3KO yolk sacs contained fewer total RUNX1+ cells, including round RUNX1+ CD31+ hematopoietic cells (Figure 1E-G). To assess EHT morphologically, we measured the ratio of flat HECs in early stages of EHT (length/width ratio >2) to more rounded RUNX1+ cells in later stages of EHT (length/width ratio ≤2) in the yolk sacs of E9.5 and E10.5 embryos (Figure 1H). There was a reduced ratio of round/flat cells in E9.5 and E10.5 EC MEKK3KO yolk sacs, consistent with inefficient progression through EHT (Figure 1I). We next measured the number of functional EMPs in the yolk sac using colony-forming assays. There were significantly fewer EMPs in EC MEKK3KO embryos compared with controls (Figure 1J). Furthermore, polymerase chain reaction analysis of DNA from individual colonies revealed that most EMPs that emerged from EC MEKK3KO embryos had escaped Tie2-Cre deletion, as cells in the colonies retained a functional Map3k3f allele (Figure 1K). These findings reveal that loss of MEKK3 in endothelial cells impairs yolk sac vascular remodeling and EHT in the yolk sac.
Endothelial MEKK3 is required for EHT in the dorsal aorta
We next assessed whether MEKK3 is required for HEC specification and EHT in the AGM region, an established site of definitive hematopoiesis and HSC emergence in the embryo. Whole mount staining of E9.5 and E10.5 control embryos revealed RUNX1+CD31+c-Kithi intraaortic hematopoietic cluster (IAHC) cells along the aortic vessel wall within the AGM region (Figure 2A-B). In contrast, age-matched EC MEKK3KO embryos contained relatively few IAHC cells (Figure 2A-B) although no change was noted in the overall size and pattern of the vasculature in the AGM region when assessed using anti-CD31 wholemount staining (supplemental Figure 3). Flow cytometric analysis of cells in the AGM region demonstrated a 6-fold reduction in RUNX1+c-Kit+ IAHC cells within the population of cells expressing endothelial markers (defined as CD31+Ter119− CD61low/−CD144+CD44+) (Figure 2C-D; supplemental Figure 4A), confirming the morphological data. Flow cytometric analysis also revealed reduced RUNX1 protein levels in IAHC cells of EC MEKK3KO embryos, based on decreased median fluorescence intensity (MFI) of RUNX1 staining (Figure 2E-F). The number of HECs determined by confocal microscopy (Figure 2G) and the percentages of PROCR+ RUNX1+ or c-Kitlo/− RUNX1+ HECs within the CD44+ population of AE cells were also decreased in EC MEKK3KO embryos (Figure 2H-I; supplemental Figure 4B-E). Finally, E10.5 EC MEKK3KO embryos contained few lymphomyeloid biased progenitors (LMPs), measured by limiting dilution analysis on either OP9 stromal cells to identify progenitors with B and myeloid cell potential or on OP9 cells expressing the Notch ligand δ-like ligand 1 to measure progenitors with T-cell potential (Figure 2J; supplemental Figure 4F-G).50,51 Thus, immunostaining analysis of the aorta, flow cytometric analysis of the cells within the AGM region, and functional progenitor assays are concordant and demonstrate severely reduced numbers of HECs, IAHC cells, and LMPs in the dorsal aorta of EC MEKK3KO embryos.
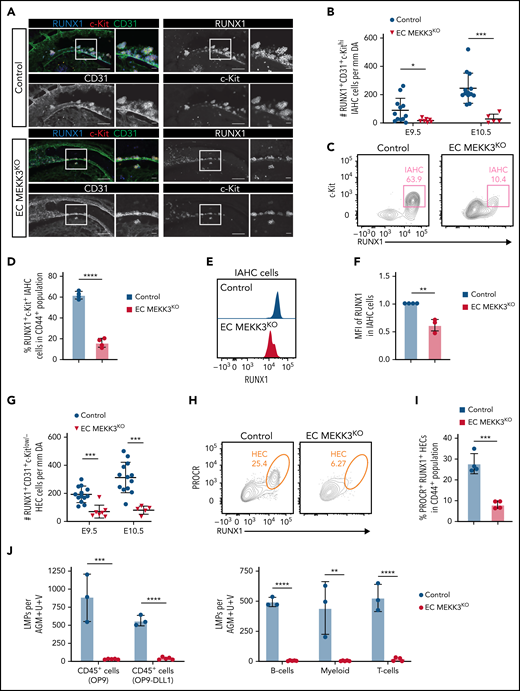
Loss of MEKK3 in endothelial cells impairs definitive hematopoiesis in the dorsal aorta. (A) Whole-mount of E10 control and EC MEKK3KO dorsal aortas stained for CD31, RUNX1, and c-Kit. Regions boxed are shown at higher magnification in images to their right. Scale bars, 100 μm (larger images) 20 μm (higher magnification views). Images are representative of 5 embryos of each genotype. (B) The number of RUNX1+CD31+c-Kithi IAHC cells per millimeter in the region of the dorsal aorta caudal to the vitelline artery in E9.5 and E10.5 control and EC MEKK3KO embryos determined from confocal microscopic images. N = 12 E9.5 control, 7 E9.5 EC MEKK3KO, 13 E10.5 control, and 5 E10.5 EC MEKK3KO embryos. Error bars represent ± standard deviation (SD), and significance was determined by an unpaired, 2-tailed Student t test. *P < .05; ***P < .001. (C) Contour flow plots of RUNX1+c-Kit+ IAHC cells within the Ter119−CD31+CD61low/−CD144+CD44+ population of cells from the AGM regions of E10.0 EC MEKK3KO and control embryos. (See supplemental Figure 4A for gating strategy.) (D) Summary of data from panel C. Error bars represent mean ± SD; N = pooled embryos from 4 different experiments; ****P < .0001. (E) Representative histogram of RUNX1 MFI in IAHC cells from pooled embryos of each genotype. IAHC cells are gated as shown in supplemental Figure 4A. (F) RUNX1 MFI in IAHCs relative to control embryos, summarized from data in panel E. Data are from pooled embryos from litters harvested on 4 separate days. Error bars represent mean ± SD. **P < .01. (G) Number of RUNX1+CD31+c-Kitlow/− HECs per millimeter of the dorsal aorta in E9.5 and E10.5 control and EC MEKK3KO embryos counted from confocal microscopic images. The number of embryos analyzed is the same as in panel B. (H) Representative contour flow plots of PROCR+ RUNX1+ HECs in the CD44+ subpopulation of CD45−Ter119−CD61low/−CD31+CD144+ cells from the AGM regions of E10.0 EC MEKK3KO and control embryos. (See supplemental Figure 4B for gating strategy.) (I) Summary of data from panel H. Data are from pooled embryos from litters harvested on 4 separate days. Error bars represent mean ± SD. ***P < .001. (J) Limiting dilution assays on OP9 stromal cells and OP9 cells expressing the Notch ligand DLL1 to determine the number of LMPs per AGM region in E10.5 control and EC MEKK3KO embryos. Number of progenitors scored based on the number of wells containing CD45+ cells (left). Number of B, T, and myeloid progenitors (right). B cells were scored after 12 days of culture as CD45+CD19+B220mid/lo, myeloid as Gr1+Mac1+ or Gr1+Mac1−, and T cells were CD90+ CD25+. Error bars represent mean ± SD. N = 3 experiments. (See supplemental Figure 4F-G for gating strategy.)
Loss of MEKK3 in endothelial cells impairs definitive hematopoiesis in the dorsal aorta. (A) Whole-mount of E10 control and EC MEKK3KO dorsal aortas stained for CD31, RUNX1, and c-Kit. Regions boxed are shown at higher magnification in images to their right. Scale bars, 100 μm (larger images) 20 μm (higher magnification views). Images are representative of 5 embryos of each genotype. (B) The number of RUNX1+CD31+c-Kithi IAHC cells per millimeter in the region of the dorsal aorta caudal to the vitelline artery in E9.5 and E10.5 control and EC MEKK3KO embryos determined from confocal microscopic images. N = 12 E9.5 control, 7 E9.5 EC MEKK3KO, 13 E10.5 control, and 5 E10.5 EC MEKK3KO embryos. Error bars represent ± standard deviation (SD), and significance was determined by an unpaired, 2-tailed Student t test. *P < .05; ***P < .001. (C) Contour flow plots of RUNX1+c-Kit+ IAHC cells within the Ter119−CD31+CD61low/−CD144+CD44+ population of cells from the AGM regions of E10.0 EC MEKK3KO and control embryos. (See supplemental Figure 4A for gating strategy.) (D) Summary of data from panel C. Error bars represent mean ± SD; N = pooled embryos from 4 different experiments; ****P < .0001. (E) Representative histogram of RUNX1 MFI in IAHC cells from pooled embryos of each genotype. IAHC cells are gated as shown in supplemental Figure 4A. (F) RUNX1 MFI in IAHCs relative to control embryos, summarized from data in panel E. Data are from pooled embryos from litters harvested on 4 separate days. Error bars represent mean ± SD. **P < .01. (G) Number of RUNX1+CD31+c-Kitlow/− HECs per millimeter of the dorsal aorta in E9.5 and E10.5 control and EC MEKK3KO embryos counted from confocal microscopic images. The number of embryos analyzed is the same as in panel B. (H) Representative contour flow plots of PROCR+ RUNX1+ HECs in the CD44+ subpopulation of CD45−Ter119−CD61low/−CD31+CD144+ cells from the AGM regions of E10.0 EC MEKK3KO and control embryos. (See supplemental Figure 4B for gating strategy.) (I) Summary of data from panel H. Data are from pooled embryos from litters harvested on 4 separate days. Error bars represent mean ± SD. ***P < .001. (J) Limiting dilution assays on OP9 stromal cells and OP9 cells expressing the Notch ligand DLL1 to determine the number of LMPs per AGM region in E10.5 control and EC MEKK3KO embryos. Number of progenitors scored based on the number of wells containing CD45+ cells (left). Number of B, T, and myeloid progenitors (right). B cells were scored after 12 days of culture as CD45+CD19+B220mid/lo, myeloid as Gr1+Mac1+ or Gr1+Mac1−, and T cells were CD90+ CD25+. Error bars represent mean ± SD. N = 3 experiments. (See supplemental Figure 4F-G for gating strategy.)
Single-cell RNA sequencing reveals altered fates for MEKK3-deficient AE cells
AE cells differentiate into IAHC cells through a series of distinct developmental transitions recently defined by single-cell RNA sequencing (scRNA-seq).51-53 The EHT trajectory described by Zhu et al51 begins with 2 populations of AE cells that express high and low levels of Wnt target genes, Wnthi AE and Wntlo AE, respectively (Figure 3A). Wnthi AE and Wntlo AE converge to form a population of endothelial cells called conflux AE, which in turn gives rise to pre-HE cells, HECs, and IAHC cells (Figure 3A). We examined cells along the EHT trajectory in E10.0 control and EC MEKK3KO embryos by profiling Ter119−CD41lo/−CD31+CD144+ESAM+ cells, which include endothelial cells, HECs, and IAHC cells, by scRNA-seq (supplemental Figure 5A). We projected the data onto a uniform manifold approximation and projection plot of wild-type cells from our previous study51 (Figure 3A). scRNA-seq identified arterial and venous endothelial cells in E10.0 EC MEKK3KO embryos (Figure 3A; supplemental Figure 5B), consistent with histologic detection of endothelial cells expressing the AE marker connexin 40 (CX40), smooth muscle actin (α-SMA) positive smooth muscle cells in the dorsal aorta, and endothelial cells positive for the venous marker EPHB4 in the cardinal vein (supplemental Figure 5C). Interestingly, not all cell types are equally affected by the loss of MEKK3. Cell type–specific differential expression and pathway analysis reveal that pre-HE has the highest number of unique differentially expressed genes (DEGs) compared with other cell types (Figure 3B; supplemental Tables 3-4), and many pathways known to promote HE specification, such as Notch and Wnt signaling, are dysregulated in pre-HE cells from MEKK3KO embryos (Figure 3C; supplemental Tables 3-4).
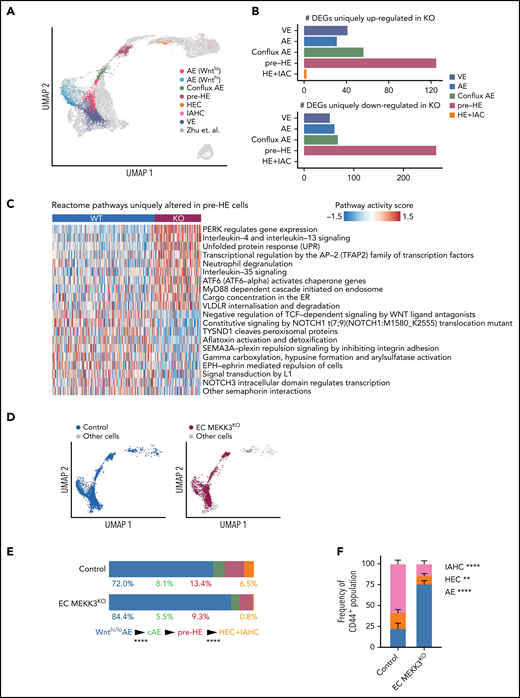
scRNA-seq analysis reveals the transitions along the EHT trajectory affected by MEKK3 loss in endothelial cells. (A) Projection of combined EC MEKK3KO and control endothelial, HEC, and IAHC cells (Ter119− CD41lo/− CD31+CD144+ ESAM+; gating strategy in supplemental Figure 5A) onto the EHT trajectory from Zhu et al51 labeled based on cell types. The inferred EHT trajectory from Zhu et al (cells represented by gray dots) was generated by uniform manifold approximation and projection and validated by several approaches, including scVelo.78 Cell types were annotated using a κ-nearest-neighbor classifier (see Materials and methods). AE cells are defined by positive arterial score (supplemental Figure 5B). (B) Number of DEGs uniquely up- or downregulated in MEKK3KO for each cell type, excluding the global DEGs (see Materials and methods). (C) Heatmap showing top Reactome pathways that are altered in pre-HE cells comparing MEKK3KO vs control. AUCell package79 was used to compute a pathway activity score for each cell. A 2-sided Student t test was used to identify cell type–specific pathways, and the global differentially regulated pathways were excluded (see Methods). (D) Separate projections of E10.0 EC MEKK3KO and control cells on the EHT trajectory. (E) Bar charts depicting the distribution of cells in Wnthi/lo AE, conflux AE (cAE), pre-HE, HEC, and IAHC cell populations in E10.0 EC MEKK3KO and control littermates. For each transition, the differences in the distributions of cells in EC MEKK3KO vs control cells were tested using a proportion test. HEC+IAHC cells were combined in the analysis due to the low cell numbers in these populations in the E10.0 EC MEKK3KO sample. ****P < .0001. (F) The proportion of AE, HEC, and IAHC cells within Ter119−CD61low/−CD31+CD144+CD44+ cells in E10.0 EC MEKK3KO AGM regions compared with littermate controls as determined by flow cytometry. (See supplemental Figure 5D for gating strategy.) Error bars represent mean ± SD. N = 4 experiments using pooled embryos. ****P < .0001; **P < .01.
scRNA-seq analysis reveals the transitions along the EHT trajectory affected by MEKK3 loss in endothelial cells. (A) Projection of combined EC MEKK3KO and control endothelial, HEC, and IAHC cells (Ter119− CD41lo/− CD31+CD144+ ESAM+; gating strategy in supplemental Figure 5A) onto the EHT trajectory from Zhu et al51 labeled based on cell types. The inferred EHT trajectory from Zhu et al (cells represented by gray dots) was generated by uniform manifold approximation and projection and validated by several approaches, including scVelo.78 Cell types were annotated using a κ-nearest-neighbor classifier (see Materials and methods). AE cells are defined by positive arterial score (supplemental Figure 5B). (B) Number of DEGs uniquely up- or downregulated in MEKK3KO for each cell type, excluding the global DEGs (see Materials and methods). (C) Heatmap showing top Reactome pathways that are altered in pre-HE cells comparing MEKK3KO vs control. AUCell package79 was used to compute a pathway activity score for each cell. A 2-sided Student t test was used to identify cell type–specific pathways, and the global differentially regulated pathways were excluded (see Methods). (D) Separate projections of E10.0 EC MEKK3KO and control cells on the EHT trajectory. (E) Bar charts depicting the distribution of cells in Wnthi/lo AE, conflux AE (cAE), pre-HE, HEC, and IAHC cell populations in E10.0 EC MEKK3KO and control littermates. For each transition, the differences in the distributions of cells in EC MEKK3KO vs control cells were tested using a proportion test. HEC+IAHC cells were combined in the analysis due to the low cell numbers in these populations in the E10.0 EC MEKK3KO sample. ****P < .0001. (F) The proportion of AE, HEC, and IAHC cells within Ter119−CD61low/−CD31+CD144+CD44+ cells in E10.0 EC MEKK3KO AGM regions compared with littermate controls as determined by flow cytometry. (See supplemental Figure 5D for gating strategy.) Error bars represent mean ± SD. N = 4 experiments using pooled embryos. ****P < .0001; **P < .01.
We next examined the distribution of cells along the EHT trajectory to pinpoint the specific transitions that were affected by loss of MEKK3. We previously showed that monoallelic mutations in Runx1 decreased the efficiency of the pre-HE to HE cell transition, whereas biallelic mutations in Sp3, which encodes a member of the Krüppel-like family of transcription factors, affected the transition from Wnthi/lo AE to conflux AE.51,54 Similar to SP3 mutant embryos, EC MEKK3KO embryos had an early defect at the transition between Wnthi/Wntlo AE cells and conflux AE, as evidenced by the accumulation of Wnthi/Wntlo AE cells (Figure 3D-E). Unlike SP3 mutant embryos, EC MEKK3KO embryos also had a later impairment at the pre-HE to HEC+IAHC cell transition (Figure 3D-E), consistent with the microscopic and flow cytometric analyses (Figure 2). Further immunophenotypic analysis confirmed that while the frequency of cells expressing the arterial marker CD44 was unchanged, the relative proportions of AE, HEC, and IAHC cells were altered in EC MEKK3 KO embryos (Figure 3E; supplemental Figure 5D-E). Neither scRNA-seq nor immunostaining identified a change in apoptotic endothelial cells in EC MEKK3 KO embryos (supplemental Figure 6). These scRNA-seq data suggest that AE cells in EC MEKK3KO embryos are limited in their ability to become specified as hemogenic and complete EHT to become IAHC cells, consistent with the morphologic, flow cytometric, and functional studies reported above.
The requirement for MEKK3 during EHT is independent of its role in cardiac development
Global MEKK3-deficient embryos have cardiac defects and die in mid-gestation,33 raising the possibility that the early defect in EHT could be a secondary effect of impaired cardiac function. EC MEKK3KO yolk sacs lacked a hierarchical vascular network of CD31+ cells (supplemental Figure 2C), and prior studies demonstrated that yolk sac vascular remodeling requires blood flow and hemodynamic shear forces.55 Thus, the yolk sac vascular defects could be secondary to impaired cardiac function rather than a primary effect of MEKK3 loss in endothelial cells. To distinguish between these possible mechanisms, we generated Lyve1-Cre;Mekk3fl/fl embryos (designated YS EC MEKK3KO) in which MEKK3 is specifically deleted in the yolk sac endothelium but not in the endocardial cells that line the heart.43 Cardiac development in YS EC MEKK3KO animals was indistinguishable from that in control littermates, consistent with a lack of Lyve1 expression in endocardial cells at this early embryonic timepoint43,56 (Figure 4A). Visual inspection of the yolk sac vasculature, wholemount immunostaining of YS endothelial cells, and hematoxylin-eosin staining of tissue sections revealed that the yolk sac vessels in E10.5 YS EC MEKK3KO embryos had a branched pattern and normal caliber (Figure 4B-D), findings consistent with preserved yolk sac vascular remodeling. The extent of remodeling appeared slightly reduced compared with control littermate yolk sacs (Figure 4D), likely reflecting the role of MEKK3 in transducing signals downstream of hemodynamic shear in endothelial cells.57 Despite preserved cardiac development and vascular remodeling, RUNX1+ and RUNX1+CD31+ cell numbers were significantly reduced in E10.5 YS EC MEKK3KO yolk sacs (Figure 4E-G), and the ratio of round/flat RUNX1+ endothelial cells was decreased (Figure 4H), phenocopying EC MEKK3KO yolk sacs. These genetic studies support an endothelial cell-autonomous requirement for MEKK3 during EHT that is independent of a role for MEKK3 in the developing heart.

Lyve1-Cre mediated loss of MEKK3 impairs definitive hematopoiesis in the yolk sac despite preserved cardiac development. (A) Hematoxylin and eosin (H&E)-stained sections of E10.5 control and Lyve1-Cre;Map3k3f/f (YS EC MEKK3KO) hearts. Scale bars, 50 μm. Boxed regions are shown at higher magnification on the right; scale bars, 20 μm. N = 3 for each genotype. (B) E10.5 control and YS EC MEKK3KO embryos surrounded by intact yolk sacs. Scale bars, 500 μm. Representative of n = 8 to 10 embryos of each genotype. (C) H&E-stained sections of E10.5 control and YS EC MEKK3KO yolk sacs. Note the reduced number of round hematopoietic cells in the YS EC MEKK3KO vascular lumen despite preserved vessel size. Representative of n = 8 to 10 embryos of each genotype at both timepoints. Scale bars, 20 μm. (D) Confocal images of E9.5 control and YS EC MEKK3KO yolk sacs stained for CD31. Scale bars, 100 μm. Boxed regions are shown at higher magnification on the right. Scale bars, 50 μm. Representative of 5 embryos per genotype. (E) E10.5 control and YS EC MEKK3KO yolk sac sections stained for CD31 and RUNX1. Scale bars, 20 μm. (F) The number of RUNX1+ cells per mm2 of vascular area. (G) The number of RUNX1+ CD31+ cells per mm2 of vascular area. (H) The ratio of round/flat RUNX1+ cells in E10.5 control and YS EC MEKK3KO yolk sacs. Each data point in panels F-G represents the mean of >25 vessels in a single animal’s yolk sac. N = 5 E10.5 control and 4 E10.5 YS EC MEKK3KO yolk sacs. Error bars represent ± standard deviation; significance determined by an unpaired, 2-tailed Student t test. *P < .05; **P < .01.
Lyve1-Cre mediated loss of MEKK3 impairs definitive hematopoiesis in the yolk sac despite preserved cardiac development. (A) Hematoxylin and eosin (H&E)-stained sections of E10.5 control and Lyve1-Cre;Map3k3f/f (YS EC MEKK3KO) hearts. Scale bars, 50 μm. Boxed regions are shown at higher magnification on the right; scale bars, 20 μm. N = 3 for each genotype. (B) E10.5 control and YS EC MEKK3KO embryos surrounded by intact yolk sacs. Scale bars, 500 μm. Representative of n = 8 to 10 embryos of each genotype. (C) H&E-stained sections of E10.5 control and YS EC MEKK3KO yolk sacs. Note the reduced number of round hematopoietic cells in the YS EC MEKK3KO vascular lumen despite preserved vessel size. Representative of n = 8 to 10 embryos of each genotype at both timepoints. Scale bars, 20 μm. (D) Confocal images of E9.5 control and YS EC MEKK3KO yolk sacs stained for CD31. Scale bars, 100 μm. Boxed regions are shown at higher magnification on the right. Scale bars, 50 μm. Representative of 5 embryos per genotype. (E) E10.5 control and YS EC MEKK3KO yolk sac sections stained for CD31 and RUNX1. Scale bars, 20 μm. (F) The number of RUNX1+ cells per mm2 of vascular area. (G) The number of RUNX1+ CD31+ cells per mm2 of vascular area. (H) The ratio of round/flat RUNX1+ cells in E10.5 control and YS EC MEKK3KO yolk sacs. Each data point in panels F-G represents the mean of >25 vessels in a single animal’s yolk sac. N = 5 E10.5 control and 4 E10.5 YS EC MEKK3KO yolk sacs. Error bars represent ± standard deviation; significance determined by an unpaired, 2-tailed Student t test. *P < .05; **P < .01.
The MEKK3 effectors KLF2 and KLF4 are required for EHT and definitive hematopoiesis
Recent studies have identified the transcription factors KLF2 and KLF4 as critical MEKK3 effectors required for endothelial responses to both fluid shear forces and inflammatory mediators such as LPS and IL-1,24,27-29,31,32,58-67 all of which affect EHT.11,14,19-21 Our scRNA-seq analysis revealed that expression of the MEKK3 target gene Klf4 was decreased in Wnthi/Wntlo AE and HEC+IAHC cells, and Klf2 expression was decreased in all populations along the EHT trajectory (Figure 5A). Because genetic studies demonstrated that KLF2 and KLF4 function redundantly and in a dose-dependent manner in endothelial cells in both the developing embryo30,68 and the mature animal,32,69 we compared EHT and definitive hematopoiesis in Tie2-Cre;Klf2fl/fl;Klf4fl/+ (EC KLF2KO/KLF4HET) animals that lack 2 Klf2 alleles and 1 Klf4 allele in endothelial cells. Unlike embryos in which both alleles of Klf2 and Klf4 are deleted, the survival of animals with this combination of KLF2/4 deleted alleles is not compromised at E9.5 and E10.5 (not shown). Klf2f/f;Klf4fl/+ littermates lacking Tie2-Cre served as controls. EC KLF2KO/KLF4HET animals exhibited pale yolk sacs with dilated vessels identical to those observed in EC MEKK3KO embryos (Figure 5B vs Figure 1A-B). E9.5 and E10.5 EC KLF2KO/KLF4HET yolk sacs also contained significantly fewer RUNX1+ and RUNX1+CD31+ cells and a decreased ratio of round/flat RUNX1+cells compared with control littermates (Figure 5C-E). The number of RUNX1+CD31+c-Kitlo/− HECs was reduced in the AGM region of EC KLF2KO/KLF4HET embryos, and there was severe loss of RUNX1+CD31+c-Kithi IAHCs at E9.5 and E10.5 (Figure 5F-H). These studies reveal a stringent requirement for endothelial KLF2 and KLF4 in both the yolk sac and AGM region for EHT that closely phenocopies that for endothelial MEKK3, suggesting that KLF2 and KLF4, which are known downstream effectors of MEKK3 signaling in endothelial cells, are also critical for EHT.
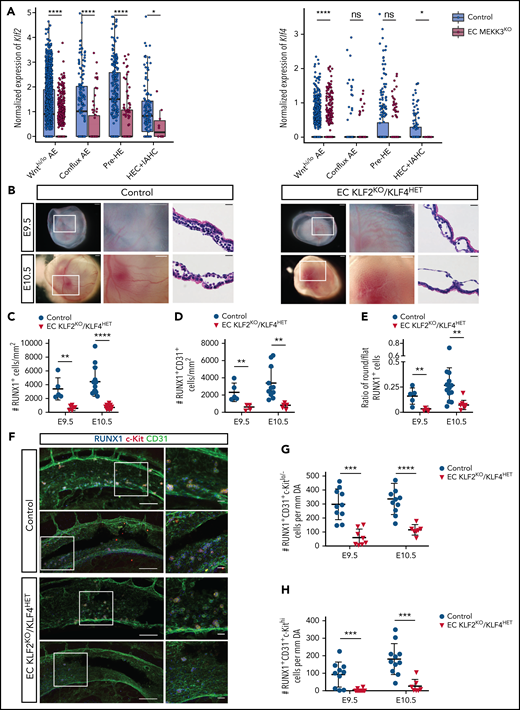
Loss of endothelial cell KLF2/4 function phenocopies endothelial MEKK3 loss in the yolk sac and AGM region. (A) Expression level (log2 size-factor-normalized UMI counts) of Klf2 and Klf4 in Wnthi/lo AE, conflux AE, pre-HE, and HEC + IAHC cell populations in E10.0 EC MEKK3KO and control littermates. An unpaired, 1-sided Mann-Whitney U test was applied to test if the expression of Klf2 and Klf4 was significantly lower in EC MEKK3KO endothelial cells compared with control. HEC+IAHC cells were combined in the analysis due to the low cell numbers in these populations in the E10.0 EC MEKK3KO sample. ****P < .0001; *P < .05. ns, not significant. (B) Stereo microscopic images and ematoxylin and eosin (H&E)-stained sections of E9.5 and E10.5 control and EC KLF2KO/KLF4HET yolk sacs. Images on the left are of intact embryos surrounded by yolk sacs. Boxed regions are shown at higher magnification in the images to their right. Images to the right are H&E-stained sections. Images are representative of 8 to 10 embryos per genotype at both timepoints. Scale bars of stereo microscopic images, 500 μm; H&E-stained sections, 20 μm. (C) Number of RUNX1+ cells per mm2 of vascular area in E9.5 and E10.5 control and EC KLF2KO/KLF4HET yolk sacs. (D) Number of RUNX1+ CD31+ cells per mm2 of vascular area in E9.5 and E10.5 control and EC KLF2KO/KLF4HET yolk sacs. (E) Ratio of round/flat RUNX1+ cells in E9.5 and E10.5 control and EC KLF2KO/KLF4HET yolk sacs. Each data point in B-D represents the mean of >25 vessels measured per yolk sac. N = 5 E9.5 control, 13 E10.5 control, 5 E9.5 EC KLF2KO/KLF4HET, and 9 E10.5 EC KLF2KO/KLF4HET yolk sacs. Error bars represent ± SD; significance determined by an unpaired, 2-tailed Student t test. **P < .01; ****P < .0001. (F) Wholemount confocal images of aortas from E9.5 control and EC KLF2KO/KLF4HET embryos stained for CD31, RUNX1, and c-Kit. Images on right show higher magnification views of boxed regions on the left. Images are representative of 5 embryos per genotype. Scale bars, 100 μm and 20 μm in panels on the left and right, respectively. (G) Number of RUNX1+CD31+c-Kitlo/− HECs per mm of dorsal aorta in E9.5 and E10.5 control and EC KLF2KO/KLF4HET embryos. N = 10 E9.5 control and EC KLF2KO/KLF4HET embryos, 11 E10.5 control, and 7 EC KLF2KO/KLF4HET embryos. (H) Number of RUNX1+CD31+c-Kithi IAHC cells per mm of dorsal aorta in E9.5 and E10.5 control and EC KLF2KO/KLF4HET embryos. N = 10 E9.5 control and EC KLF2KO/KLF4HET embryos, 11 E10.5 control, and 7 E10.5 EC KLF2KO/KLF4HET embryos. Error bars represent mean ± standard deviation; significance determined by an unpaired 2-tailed Student t test. ***P < .001; ****P < .0001.
Loss of endothelial cell KLF2/4 function phenocopies endothelial MEKK3 loss in the yolk sac and AGM region. (A) Expression level (log2 size-factor-normalized UMI counts) of Klf2 and Klf4 in Wnthi/lo AE, conflux AE, pre-HE, and HEC + IAHC cell populations in E10.0 EC MEKK3KO and control littermates. An unpaired, 1-sided Mann-Whitney U test was applied to test if the expression of Klf2 and Klf4 was significantly lower in EC MEKK3KO endothelial cells compared with control. HEC+IAHC cells were combined in the analysis due to the low cell numbers in these populations in the E10.0 EC MEKK3KO sample. ****P < .0001; *P < .05. ns, not significant. (B) Stereo microscopic images and ematoxylin and eosin (H&E)-stained sections of E9.5 and E10.5 control and EC KLF2KO/KLF4HET yolk sacs. Images on the left are of intact embryos surrounded by yolk sacs. Boxed regions are shown at higher magnification in the images to their right. Images to the right are H&E-stained sections. Images are representative of 8 to 10 embryos per genotype at both timepoints. Scale bars of stereo microscopic images, 500 μm; H&E-stained sections, 20 μm. (C) Number of RUNX1+ cells per mm2 of vascular area in E9.5 and E10.5 control and EC KLF2KO/KLF4HET yolk sacs. (D) Number of RUNX1+ CD31+ cells per mm2 of vascular area in E9.5 and E10.5 control and EC KLF2KO/KLF4HET yolk sacs. (E) Ratio of round/flat RUNX1+ cells in E9.5 and E10.5 control and EC KLF2KO/KLF4HET yolk sacs. Each data point in B-D represents the mean of >25 vessels measured per yolk sac. N = 5 E9.5 control, 13 E10.5 control, 5 E9.5 EC KLF2KO/KLF4HET, and 9 E10.5 EC KLF2KO/KLF4HET yolk sacs. Error bars represent ± SD; significance determined by an unpaired, 2-tailed Student t test. **P < .01; ****P < .0001. (F) Wholemount confocal images of aortas from E9.5 control and EC KLF2KO/KLF4HET embryos stained for CD31, RUNX1, and c-Kit. Images on right show higher magnification views of boxed regions on the left. Images are representative of 5 embryos per genotype. Scale bars, 100 μm and 20 μm in panels on the left and right, respectively. (G) Number of RUNX1+CD31+c-Kitlo/− HECs per mm of dorsal aorta in E9.5 and E10.5 control and EC KLF2KO/KLF4HET embryos. N = 10 E9.5 control and EC KLF2KO/KLF4HET embryos, 11 E10.5 control, and 7 EC KLF2KO/KLF4HET embryos. (H) Number of RUNX1+CD31+c-Kithi IAHC cells per mm of dorsal aorta in E9.5 and E10.5 control and EC KLF2KO/KLF4HET embryos. N = 10 E9.5 control and EC KLF2KO/KLF4HET embryos, 11 E10.5 control, and 7 E10.5 EC KLF2KO/KLF4HET embryos. Error bars represent mean ± standard deviation; significance determined by an unpaired 2-tailed Student t test. ***P < .001; ****P < .0001.
Stimulation of EHT by inflammatory mediators requires endothelial MEKK3 signaling
Endothelial cell MEKK3-KLF2/4 signaling is stimulated by hemodynamic shear forces and inflammatory mediators, both of which have been implicated in the specification of HECs and the initiation of definitive hematopoiesis.12,13,17-22,70 To test whether MEKK3 signaling is required for inflammatory stimulation of definitive hematopoiesis, we measured the number of HECs in the AGM of cultured E9.5 control and EC MEKK3KO embryo trunks incubated in the presence of inflammatory mediators previously demonstrated to drive EHT (Figure 6A). To ensure that overall embryonic viability was not excessively compromised during the 40-hour ex vivo incubation period, we restricted analysis to embryo trunks with detectable heartbeats at the end of the culture period. TLR4 signaling has been demonstrated to increase HEC specification in zebrafish embryos19 and stimulates MEKK3 signaling in endothelial cells of the postnatal brain.32 Exposure of control embryo trunks to the TLR4 ligand lipopolysaccharide (LPS) resulted in a variable but robust (∼3.4-fold) increase in RUNX1+CD31+ cells in the AGM region (Figure 6B-C). In contrast, exposure of EC MEKK3KO embryo trunks to LPS failed to induce a significant increase in RUNX1+CD31+ cells (Figure 6B-C).
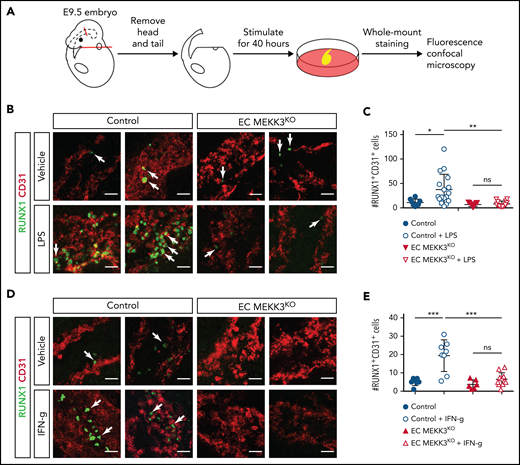
Stimulation of definitive hematopoiesis by the inflammatory mediators LPS and IFN-γ requires endothelial MEKK3. (A) Schematic of experimental procedure for ex vivo stimulation of embryonic trunk explants with inflammatory mediators. (B) Whole mount staining of control and EC MEKK3KO embryonic trunks for CD31 and RUNX1 after exposure to vehicle or LPS. Arrows denote RUNX1+ cells. Scale bars, 20 μm. (C) Average number of RUNX1+CD31+ cells per millimeter of dorsal aorta for each treatment cohort. Each data point represents the average number of RUNX1+CD31+ cells in a single embryo. N = 8 vehicle-treated and 17 LPS-treated control embryos; 9 vehicle-treated and 12 LPS-treated EC MEKK3KO embryos. (D) Whole mount staining of control and EC MEKK3KO embryo trunks for CD31 and RUNX1 after exposure to vehicle or IFN-γ. Arrows indicate examples of RUNX1+ cells. Scale bars, 20 μm. (E) Average number of RUNX1+CD31+ cells per millimeter of dorsal aorta per embryo. N = 7 vehicle- and 8 IFN-γ–treated control embryos; 6 vehicle- and 11 IFN-γ–treated EC MEKK3KO embryos. Error bars represent ± standard deviation; significance determined by an unpaired, 2-tailed Student t test. ns, not significant. *P < .05; **P < .01; ***P < .001.
Stimulation of definitive hematopoiesis by the inflammatory mediators LPS and IFN-γ requires endothelial MEKK3. (A) Schematic of experimental procedure for ex vivo stimulation of embryonic trunk explants with inflammatory mediators. (B) Whole mount staining of control and EC MEKK3KO embryonic trunks for CD31 and RUNX1 after exposure to vehicle or LPS. Arrows denote RUNX1+ cells. Scale bars, 20 μm. (C) Average number of RUNX1+CD31+ cells per millimeter of dorsal aorta for each treatment cohort. Each data point represents the average number of RUNX1+CD31+ cells in a single embryo. N = 8 vehicle-treated and 17 LPS-treated control embryos; 9 vehicle-treated and 12 LPS-treated EC MEKK3KO embryos. (D) Whole mount staining of control and EC MEKK3KO embryo trunks for CD31 and RUNX1 after exposure to vehicle or IFN-γ. Arrows indicate examples of RUNX1+ cells. Scale bars, 20 μm. (E) Average number of RUNX1+CD31+ cells per millimeter of dorsal aorta per embryo. N = 7 vehicle- and 8 IFN-γ–treated control embryos; 6 vehicle- and 11 IFN-γ–treated EC MEKK3KO embryos. Error bars represent ± standard deviation; significance determined by an unpaired, 2-tailed Student t test. ns, not significant. *P < .05; **P < .01; ***P < .001.
Interferon signaling has been identified in both fish21 and mice20,22 as an important activator of EHT but has not been previously associated with MEKK3 signaling. Exposure of control embryo trunks to IFN-γ significantly increased the number of RUNX1+CD31+ cells by ∼3.8-fold (Figure 6D-E). In contrast, IFN-γ failed to increase the number of RUNX1+CD31+ cells in EC MEKK3KO embryo trunks (Figure 6D-E). Together, these studies indicate that TLR4 and IFN-γ signaling require MEKK3 to promote the generation of RUNX1+CD31+ cells.
Hemodynamic stimulation of EHT requires endothelial MEKK3 signaling
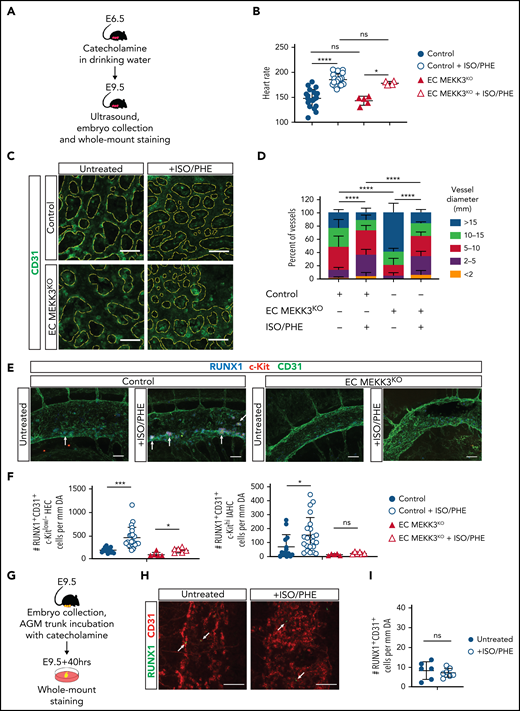
The findings described above and prior studies identifying MEKK3-KLF2/4 signaling as a common downstream pathway required for endothelial responses to both inflammatory mediators and hemodynamic shear forces suggested that MEKK3 might also mediate the stimulation of EHT by hemodynamic forces in the developing embryo. Catecholamines administered orally to pregnant females cross the placenta and efficiently rescue embryonic catecholamine deficiency,71,72 in part by raising embryonic heart rate and function.73 Because embryonic cardiomyocytes express adrenergic receptors known to stimulate both contractile rate and force,73 maternal catecholamine administration may also increase embryonic cardiac performance and vascular hemodynamic forces in embryos that do not lack endogenous catecholamines. Consistent with this prediction, we previously showed that lethal embryonic heart failure conferred by pan-endothelial loss of KLF2 can be prevented by maternal catecholamine administration.27,30 To test the role of endothelial MEKK3 signaling in hemodynamic regulation of EHT, we treated pregnant females carrying both EC MEKK3KO and control embryos with isoproterenol and phenylephrine (ISO/PHE), catecholamines that have been previously demonstrated to rescue catecholamine-deficient embryos (Figure 7A). Transabdominal ultrasound studies performed in lightly anesthetized pregnant females revealed that the heart rates of both untreated and catecholamine-treated EC MEKK3KO embryos were not significantly different from those of control littermates (Figure 7B). Maternal catecholamine treatment starting at E6.5 raised the mean heart rate of both control and EC MEKK3KO E9.5 embryos by ∼20% (Figure 7B), consistent with a strong positive effect on cardiac performance. Because hemodynamic shear forces cannot be directly measured in the E9.5 embryo, to determine if the increase in heart rate conferred by catecholamine treatment resulted in a significant increase in hemodynamic forces, we measured yolk sac vessel diameters to quantitate remodeling of the primitive vascular plexus to a heterogeneous, hierarchical vascular network, a process known to be driven by fluid shear forces.55,74,75 Yolk sacs from both control and EC MEKK3KO animals exposed to maternal catecholamine treatment displayed a greater number of smaller vessels and a more mature vascular pattern compared with animals of both genotypes that were not exposed to maternal catecholamine treatment (Figure 7C-D), a result consistent with increased blood flow and hemodynamic shear forces in both the control and the EC MEKK3KO groups.
Stimulation of definitive hematopoiesis by catecholamines requires endothelial MEKK3. (A) Experimental procedure for in vivo treatment of E9.5 embryos with isoproterenol and phenylephrine (ISO/PHE). (B) Heart rates of E9.5 control and EC MEKK3KO embryos with and without exposure to maternal ISO/PHE measured by transabdominal ultrasound. (C) CD31+ cells in whole mount E9.5 control and EC MEKK3KO yolk sacs +/− administration of ISO/PHE to pregnant dams. The CD31+ vascular pattern is outlined in yellow dotted lines. Images are representative of ≥5 embryos per genotype. Bars represent 50 μm. (D) Quantitative analysis of vessel diameters in the yolk sac of E9.5 control and EC MEKK3KO embryos isolated from vehicle and ISO/PHE-treated dams. N = 4 control and 5 EC MEKK3KO embryos from vehicle-treated dams; 6 control and 3 EC MEKK3KO embryos from ISO/PHE-treated dams. (E) Dorsal aortas from E9.5 control and EC MEKK3KO embryos isolated from pregnant dams treated with ISO/PHE, labeled with antibodies for CD31, RUNX1, and c-Kit. Bars represent 50 μm. (F) Number of RUNX1+CD31+c-Kitlo/− HECs (left) and RUNX1+CD31+c-Kithi IAHC cells (right) per mm of dorsal aorta in E9.5 control and EC MEKK3KO embryos ± ISO/PHE. N = 11 control and 12 EC MEKK3KO embryos from vehicle-treated dams; 5 control and 6 EC MEKK3KO embryos from ISO/PHE-treated dams. (G) Experimental procedure for stimulating EHT in E9.5 embryo trunks with ISO/PHE ex vivo. (H) Whole mount staining of E9.5 embryonic trunks for CD31 and RUNX1 following vehicle or ISO/PHE treatment ex vivo. Arrows denote sites of RUNX1+ cells. Bars represent 50 μm. (I) Number of RUNX1+CD31+ cells per mm of aorta in E9.5 control embryo trunks ± ISO/PHE. N = 6 vehicle- and 7 ISO/PHE-treated embryo trunk explants. Error bars represent ± SD; significance determined with unpaired two-tailed Student t test. ns, not significant. *P < .05; ***P < .001; ****P < .0001.
Stimulation of definitive hematopoiesis by catecholamines requires endothelial MEKK3. (A) Experimental procedure for in vivo treatment of E9.5 embryos with isoproterenol and phenylephrine (ISO/PHE). (B) Heart rates of E9.5 control and EC MEKK3KO embryos with and without exposure to maternal ISO/PHE measured by transabdominal ultrasound. (C) CD31+ cells in whole mount E9.5 control and EC MEKK3KO yolk sacs +/− administration of ISO/PHE to pregnant dams. The CD31+ vascular pattern is outlined in yellow dotted lines. Images are representative of ≥5 embryos per genotype. Bars represent 50 μm. (D) Quantitative analysis of vessel diameters in the yolk sac of E9.5 control and EC MEKK3KO embryos isolated from vehicle and ISO/PHE-treated dams. N = 4 control and 5 EC MEKK3KO embryos from vehicle-treated dams; 6 control and 3 EC MEKK3KO embryos from ISO/PHE-treated dams. (E) Dorsal aortas from E9.5 control and EC MEKK3KO embryos isolated from pregnant dams treated with ISO/PHE, labeled with antibodies for CD31, RUNX1, and c-Kit. Bars represent 50 μm. (F) Number of RUNX1+CD31+c-Kitlo/− HECs (left) and RUNX1+CD31+c-Kithi IAHC cells (right) per mm of dorsal aorta in E9.5 control and EC MEKK3KO embryos ± ISO/PHE. N = 11 control and 12 EC MEKK3KO embryos from vehicle-treated dams; 5 control and 6 EC MEKK3KO embryos from ISO/PHE-treated dams. (G) Experimental procedure for stimulating EHT in E9.5 embryo trunks with ISO/PHE ex vivo. (H) Whole mount staining of E9.5 embryonic trunks for CD31 and RUNX1 following vehicle or ISO/PHE treatment ex vivo. Arrows denote sites of RUNX1+ cells. Bars represent 50 μm. (I) Number of RUNX1+CD31+ cells per mm of aorta in E9.5 control embryo trunks ± ISO/PHE. N = 6 vehicle- and 7 ISO/PHE-treated embryo trunk explants. Error bars represent ± SD; significance determined with unpaired two-tailed Student t test. ns, not significant. *P < .05; ***P < .001; ****P < .0001.
To test the effect of catecholamine-induced increased shear forces on EHT, we next performed wholemount staining of E9.5 embryos and quantified RUNX1+CD31+c-Kitlo/− HECs and RUNX1+CD31+c-Kithi IAHCs in the AGM region as described above. Maternal catecholamine treatment resulted in a significant, 2.5-fold increase in the number of RUNX1+CD31+c-Kitlo/− HECs in E9.5 control embryos and a 2.2-fold increase in the number of RUNX1+CD31+c-Kithi IAHCs (Figure 7E-F). Maternal catecholamines also induced an ∼2-fold increase of HECs in EC MEKK3KO embryos but no increase in IAHCs (Figure 7E-F). These findings are consistent with studies in zebrafish embryos demonstrating that increased heart rate can augment EHT12 and suggest that MEKK3-mediated signaling in endothelial cells is required for increased EHT in response to hemodynamic forces. To confirm that increased hemodynamic forces were responsible for the increase in EHT, as opposed to catecholamines having a direct effect on endothelial cells, we compared the number of HECs in the AGM region of cultured E9.5 control embryo trunks that had been incubated in the presence or absence of ISO/PHE (Figure 7G). The number of RUNX1+CD31+ HECs in embryo trunks exposed to catecholamines was indistinguishable from that in untreated control embryo trunks (Figure 7H-I), suggesting that catecholamines augment EHT through effects on cardiac function and blood flow rather than directly affecting endothelial cells. Together, these studies demonstrate that the stimulation of EHT by hemodynamic forces and inflammatory signals requires endothelial MEKK3 signaling (supplemental Figure 7).
Discussion
Fluid shear forces and inflammatory mediators are environmental stimuli that promote EHT, but how such diverse environmental inputs are transduced and integrated is unknown. Our studies determined that MEKK3-KLF2/4 signaling is required to generate normal numbers of HECs and promote EHT, supporting a mechanism by which environmental inflammatory mediators and hemodynamic stimuli are integrated by a single molecular pathway.
The observations that both EHT and MEKK3-KLF2/4 signaling are driven by inflammatory and hemodynamic stimuli suggested that this pathway may link these environmental cues to EHT during embryonic development. MEKK3 was required for the increase in RUNX1+ cells in ex vivo–cultured AGM regions in response to the TLR4 ligand LPS or IFN-γ. It was previously shown that runx1 expression in the dorsal aorta of zebrafish embryos is promoted by TLR4 signaling through NF-κB.19 Our study shows that TLR4 also signals through MEKK3 to increase the number of RUNX1+ cells and promote EHT. Prior studies demonstrated that MEKK3-KLF2/4 signaling is required for inflammatory responses to LPS, IL-1, and TNF by both mouse embryonic fibroblasts ex vivo31 and endothelial cells in vivo.32 Thus, for these ligands, both NF-κB and MEKK3-KLF2/4 signaling are likely to transduce the signals required in endothelial cells to drive EHT. Although MEKK3 signaling is known to drive the production of IFN-γ,76 the molecular pathway(s) by which IFN-γ drives MEKK3 signaling and EHT is not yet defined.
Ex vivo studies of cells harvested from the mouse AGM have also demonstrated that shear forces are sufficient to drive the expression of RUNX1 and EHT in association with upregulation of KLF2 and its target gene endothelial nitric oxide synthase.13 These findings are consistent with studies in zebrafish embryos showing that blood flow and flow-stimulated KLF2 and nitric oxide stimulate EHT.12,14 Our studies place MEKK3 in this pathway. To test the requirement for MEKK3 signaling in the hemodynamic stimulation of EHT, we exposed developing embryos to catecholamines known to increase both the rate and strength of cardiac contraction.27,71-73 Transabdominal ultrasound studies confirmed that maternal catecholamine treatment increased the embryonic heart rate by >20% and was associated with accelerated yolk sac remodeling in both control and EC MEKK3KO embryos, consistent with augmented cardiac output and hemodynamic forces as well as vascular remodeling known to respond to such forces. In vivo catecholamine treatment elicited a significant increase in IAHC cell formation in control but not EC MEKK3KO embryos, whereas direct catecholamine treatment of wild-type embryo trunks ex vivo failed to increase the number of IAHCs. These studies provide additional evidence for hemodynamic forces as a driving mechanism in EHT and definitive hematopoiesis in mammalian embryos and support the conclusion that MEKK3 signaling plays a central role in transducing hemodynamic as well as inflammatory stimulation of EHT (supplemental Figure 7).
A notable aspect of this study is the use of scRNA-seq analysis to more fully define the role of MEKK3 signaling in AE cells during EHT. Recent studies have demonstrated a reproducible trajectory of aortic endothelial cells as they acquire hematopoietic cell fate.51-53 Our scRNA-seq data reveal that loss of MEKK3 impairs the transition between Wnthi/lo AE and conflux AE, a defect similar to that caused by loss of SP3, which is a member of the same family of transcription factors as KLF2/4.54 A second impairment occurs at the pre-HE to HEC+IAHC transition, similar to that caused by decreased levels of RUNX1.51 These findings are consistent with the loss of RUNX1 expression demonstrated by immunostaining of tissue sections and flow cytometric analysis of AGM endothelial cells and extend those observations to more fully define the role of MEKK3. It is likely that similar scRNA-seq analysis will be more broadly used as a tool to define defects in EHT at higher resolution and with greater precision in future studies.
Additional detailed molecular and genetic studies will be necessary to better understand how MEKK3-KLF2/4 signaling regulates EHT. Direct regulation of Runx1 expression by MEKK3-KLF2/4 is suggested by the enrichment of KLF/SP motifs in putative and known Runx1 enhancers under single-cell assay for transposase-accessible chromatin sequencing peaks.51 Alternatively, distinct downstream KLF2/4 targets such as nitric oxide could function indirectly to upregulate RUNX1 expression, as suggested by prior studies.12,13 Understanding this process may enable translational manipulation of MEKK3-KLF2/4 signaling to drive EHT in vitro and generate patient-specific HSPCs for therapeutic use.77
Acknowledgments
The authors thank MinMin Lu for her help with this work and many prior studies leading to it. The authors also thank Marielle Scherer-Crosbie for her technical expertise and advice.
This work was supported by the National Heart, Lung, and Blood Institute, National Institutes of Health (grant R01 HL142976 [M.L.K., K.T., and N.A.S.], grant R01HL091724 [N.A.S.], and grant T32HL007439 [L.B.]), and National Institute of Diabetes and Digestive and Kidney Diseases, National Institutes of Health (grant T32DK007780 [M.M.]).
Authorship
Contribution: Y.Y., M.M., Q.Z., D.S., T.K., L.B., Y.U., J.T., and P.G. designed and performed experiments and drafted the manuscript; C.H., M.C., J.Y., X.C., and S.A.T. performed experiments; S.S. performed transabdominal ultrasound studies of pregnant female mice; and K.T., N.A.S., and M.L.K. oversaw experimental design and writing of the manuscript.
Conflict-of-interest disclosure: The authors declare no competing financial interests.
Correspondence: Nancy A. Speck, 544 BRB II/III 421 Curie Blvd Philadelphia, PA 19104; e-mail: nancyas@upenn.edu; and Mark L. Kahn, 3400 Civic Center Blvd, Building 421, Translational Research Center, Room 11-123, Philadelphia, PA 19104-5159; e-mail: markkahn@pennmedicine.upenn.edu.
scRNA-seq data generated during this study have been deposited in the Gene Expression Omnibus with the accession number GSE179991.
Requests for data sharing may be submitted to Nancy A. Speck (nancyas@upenn.edu).
The online version of this article contains a data supplement.
The publication costs of this article were defrayed in part by page charge payment. Therefore, and solely to indicate this fact, this article is hereby marked “advertisement” in accordance with 18 USC section 1734.

This feature is available to Subscribers Only
Sign In or Create an Account Close Modal